Environmental Testing Market Outlook:
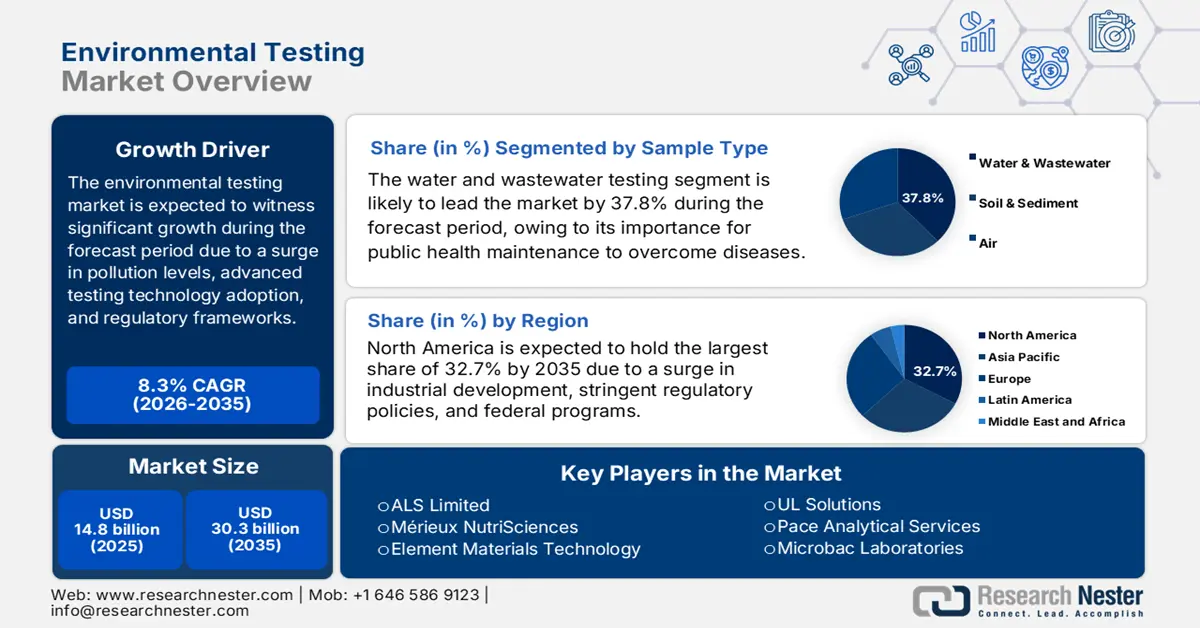
Environmental Testing Market size was over USD 14.8 billion in 2025 and is estimated to reach USD 30.3 billion by the end of 2035, expanding at a CAGR of 8.3% during the forecast timeline, i.e., 2026-2035. In 2026, In 2026, the industry size of environmental testing is evaluated at USD 16 billion.
The international environmental testing market is continuously experiencing growth, which reflects a rise in pollution levels, the adoption of innovative testing technologies, and evolving regulatory frameworks. Besides, environmental testing has emerged as the critical factor for communities, governments, and industries to effectively ensure compliance, support sustainable development, and protect ecosystems. According to an article published by the World Bank Organization in October 2025, approximately 2.3 billion people are readily exposed to outdoor fine particulate matter levels above 35 µg/m³. This has resulted in over 5.7 million deaths every year, along with economic expenses approaching 5% of the overall international gross development product (GDP). Besides, with the presence of current policies, the exposure is anticipated to increase by 15% over the upcoming 15 years, owing to economic and population growth. Moreover, the change in air quality is also gradually increasing the market’s demand globally.
Global Change in Air Quality (Previous Years versus 2023)
|
Pollutant Type |
1980 vs 2023 |
1990 vs 2023 |
2000 vs 2023 |
2010 vs 2023 |
|
Carbon Monoxide |
-88 |
-79 |
-65 |
-18 |
|
Lead |
- |
- |
- |
-87 |
|
Nitrogen Dioxide (Yearly) |
-68 |
-62 |
-54 |
-30 |
|
Nitrogen Dioxide (1-hour) |
-66 |
-55 |
-40 |
-23 |
|
Ozone (8-hour) |
-26 |
-18 |
-12 |
-1 |
|
PM10 (24-hour) |
- |
-29 |
-36 |
-0 |
|
PM2.5 (Yearly) |
- |
- |
-37 |
-15 |
|
PM2.5 (24-hour) |
- |
- |
-29 |
+1 |
|
Sulfur Dioxide (1-Hour) |
-95 |
-92 |
-87 |
-78 |
Source: EPA Government
Furthermore, the adoption of rapid testing technologies, integration of artificial intelligence (AI) and digitalized platforms, increased focus on emerging contaminants, such as microplastics and PFAS, as well as the expansion of outsourced testing services, are other drivers boosting the environmental testing market globally. As per an article published by the OECD in September 2025, 70% of countries utilized AI to optimize internal governmental processes, while only 33% utilized it to enhance policy design and implementation. Besides, 5% to 6% of businesses in the U.S. utilize this technology to produce goods and services, and 7% are readily planning to adopt it in the upcoming years. Moreover, approximately 26% of organizations have the capabilities required to derive real value from AI, and on the other hand, 4% have succeeded in generating significant value. Therefore, with this increased AI utilization, the environmental testing market is continuously gaining increased exposure.
Key Environmental Testing Market Insights Summary:
Regional Insights:
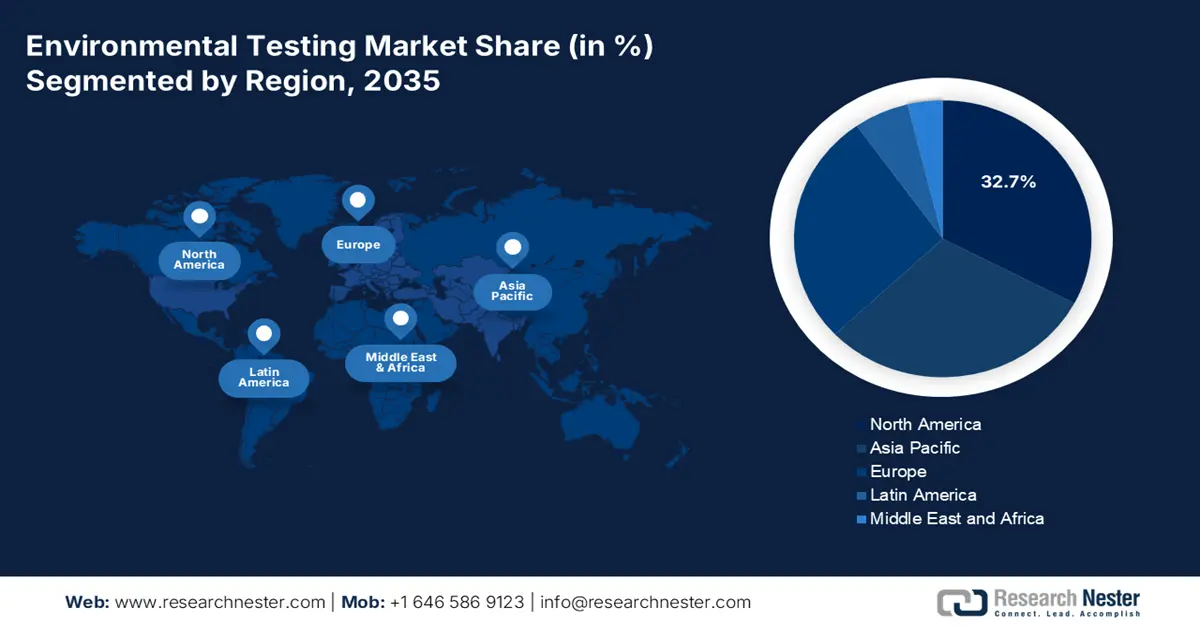
- North America is projected to command a 32.7% share by 2035 in the environmental testing market, supported by mature industrial ecosystems, rigorous regulatory oversight, and extensive federal monitoring programs across air, water, and soil.
- Europe is expected to register the fastest growth through 2035, strengthened by aggressive decarbonization initiatives, circular economy policies, and tighter contaminant thresholds across environmental matrices.
Segment Insights:
- The water and wastewater testing sub-segment is forecast to account for a 37.8% share by 2035 in the environmental testing market, underpinned by its critical role in public health protection, ecosystem preservation, regulatory adherence, and assurance of water safety across industrial, recreational, and drinking applications.
- The automated or online monitoring sub-segment is anticipated to secure the second-largest share by 2035, reinforced by real-time pollutant tracking capabilities enabled through IoT integration, AI-based analytics, and cloud-enabled compliance monitoring.
Key Growth Trends:
- Increase in urbanization and industrialization
- Focus on ESG awareness
Major Challenges:
- Increased expenses of innovative testing technologies
- Limitation of skilled professionals
Key Players: SGS SA, Bureau Veritas, Eurofins Scientific, Intertek Group plc, TÜV SÜD, TÜV Rheinland, ALS Limited, Mérieux NutriSciences, Element Materials Technology, UL Solutions, Pace Analytical Services, Microbac Laboratories, Eurofins TestAmerica, Agilent Technologies, Shimadzu Corporation, Korea Testing and Research Institute, Korea Conformity Laboratories, Vimta Labs, Spectro Analytical Labs, SIRIM Berhad.
Global Environmental Testing Market Forecast and Regional Outlook:
Market Size & Growth Projections:
- 2025 Market Size: USD 14.8 billion
- 2026 Market Size: USD 16 billion.
- Projected Market Size: USD 30.3 billion by 2035
- Growth Forecasts: 8.3% CAGR (2026-2035)
Key Regional Dynamics:
- Largest Region: North America (32.7% Share by 2035)
- Fastest Growing Region: Europe
- Dominating Countries: United States, Germany, China, Japan, United Kingdom
- Emerging Countries: India, Vietnam, Indonesia, Brazil, South Korea
Last updated on : 23 December, 2025
Environmental Testing Market - Growth Drivers and Challenges
Growth Drivers
- Increase in urbanization and industrialization: The rapid industrial growth in the Asia Pacific has resulted in increased pollution levels, which is driving the demand for the environmental testing market for evaluating hazardous waste, emissions, and effluents. According to a data report published by the UNIDO Organization in October 2024, the industrial performance in the region has successfully achieved 57% of the overall sustainable development goal target, and displays the region as a powerhouse in international industrial production. In addition, there has been rapid progress in the infrastructure development in the region by diminishing the infrastructure barrier by 2.4% points every year. Therefore, with this continuous growth in the industrial infrastructure, the market is proliferating.
- Focus on ESG awareness: Corporations and customers are readily prioritizing environmental, social, and governance (ESG) commitments, which is yet another driver for bolstering the environmental testing market globally. This has eventually increased investments in environmental certification and monitoring programs. As per an article published by the United Nations Organization in 2025, at present, almost 645 million people lack the accessibility to electricity, and 1.8 billion are poised to lack clean energy by the end of 2030. However, renewable energy sources tend to power 30% of energy consumption, particularly in the electricity industry as of 2022. In addition, the renewable energy share in the global energy consumption has increased from 15.6% to 17.9% in the same year, thereby making it suitable for uplifting the market internationally.
- Governmental funding for sustainable chemicals: The existence of programs, such as the U.S. EPA Green Chemistry and Europe’s Green Deal strategies, offers generous funding for sustainable chemical processes. These particular strategies indirectly bolster the demand for the environmental testing market to effectively validate compliance. As per an article published by the Invest India Government in March 2025, in terms of the Plastic Park Scheme for supporting need-based plastic parks, the government of India offers grant funding of almost 50% of the project cost, subject to a ceiling of ₹40 crore per project. Meanwhile, FDI inflows to the country’s chemicals sector, amounting to USD 22.1 billion, and the industry is further predicted to gain additional investments of ₹8 lakh crore by the end of 2025.
Challenges
- Increased expenses of innovative testing technologies: The environmental testing market increasingly relies on sophisticated instruments and rapid immunoassays. While these technologies deliver faster and more accurate results, they come with significant capital and operational costs. Smaller laboratories and emerging market players often struggle to afford these systems, limiting their ability to compete with global leaders. Additionally, maintenance, calibration, and skilled workforce requirements add recurring expenses. This cost barrier is particularly acute in developing regions, where budget constraints hinder adoption despite rising pollution levels. As regulations tighten worldwide, industries are compelled to outsource testing to certified labs, further concentrating environmental testing market power among large players.
- Limitation of skilled professionals: The environmental testing market requires highly trained professionals capable of handling complex analytical instruments, interpreting results, and ensuring compliance with international standards. However, there is a global shortage of such skilled personnel, especially in emerging economies. Besides, universities and training institutes often lag in updating curricula to match evolving technologies like PFAS detection, microplastics analysis, and AI-driven monitoring. This talent gap leads to longer turnaround times, reduced accuracy, and increased reliance on outsourcing. In regions such as Asia-Pacific, where industrial growth is rapid, the lack of skilled professionals creates a mismatch between demand and available capacity, thereby creating a hindrance in the market’s growth as well as expansion.
Environmental Testing Market Size and Forecast:
| Report Attribute | Details |
|---|---|
|
Base Year |
2025 |
|
Forecast Year |
2026-2035 |
|
CAGR |
8.3% |
|
Base Year Market Size (2025) |
USD 14.8 billion |
|
Forecast Year Market Size (2035) |
USD 30.3 billion |
|
Regional Scope |
|
Environmental Testing Market Segmentation:
Sample Type Segment Analysis
The water and wastewater testing sub-segment, which is part of the sample type, is anticipated to garner the highest share of 37.8% in the environmental testing market by the end of 2035. The segment’s upliftment is highly attributed to its importance for public health, deliberately combating waterborne disorders, environmental protection for safeguarding ecosystems from pollutants, and integrating regulatory compliance for different sectors, and developing public trust by confirming water safety for industrial, recreation, and drinking utilization. According to an article published by the CDC Government in April 2024, since the initial launch of the National Wastewater Surveillance System (NWSS), there has been the inclusion of over 1,200 testing sites, particularly in America. Additionally, in July 2022, a overall of 2 territories, 5 cities, and 46 states comprise wastewater surveillance systems, with samples collected that serve over 130 million people in the U.S.
Technology Segment Analysis
Based on the automated or online monitoring sub-segment, part of the technology segment, is projected to hold the second-largest share in the environmental testing market during the forecast period. The sub-segment’s growth is highly driven by enabling real-time, continuous measurement of pollutants across water, air, and soil. Unlike conventional laboratory-based methods, which require sample collection and delayed analysis, automated systems provide immediate data streams that enhance compliance and risk management. These systems integrate IoT sensors, AI-driven analytics, and cloud platforms, allowing industries and regulators to track pollutant levels remotely and respond quickly to exceedances. For instance, online water quality monitoring stations can detect changes in pH, turbidity, or heavy metal concentrations within minutes, supporting municipal utilities in ensuring safe drinking water.
Contaminant Type Segment Analysis
By the end of the stipulated timeline, the inorganic compounds (heavy metals) segment, as part of the contaminant type, is expected to account for the third-largest share in the environmental testing market. The segment’s development is highly propelled by its toxic, persistent, and bioaccumulative properties, posing severe risks to human health and ecosystems. Regulatory agencies worldwide, including the U.S. EPA, European Chemicals Agency (ECHA), and India’s Central Pollution Control Board (CPCB), have established strict thresholds for heavy metals in water, soil, and air. Testing demand is therefore consistently high, especially in regions with industrial activity such as mining, manufacturing, and electronics production. Heavy metals are commonly monitored in wastewater effluents, agricultural soils, and atmospheric emissions, requiring advanced analytical techniques, including Inductively Coupled Plasma Mass Spectrometry (ICP-MS) and atomic absorption spectroscopy.
Our in-depth analysis of the environmental testing market includes the following segments:
|
Segment |
Subsegments |
|
Sample Type |
|
|
Technology |
|
|
Contaminant Type |
|
|
End use Industry |
|
|
Test Standards |
|
|
Service Type |
|

Vishnu Nair
Head - Global Business DevelopmentCustomize this report to your requirements — connect with our consultant for personalized insights and options.
Environmental Testing Market - Regional Analysis
North America Market Insights
North America in the environmental testing market is anticipated to hold the largest share of 32.7% by the end of 2035. The market’s upliftment in the region is highly fueled by in-depth industrial ecosystems, strict regulatory frameworks, the presence of federal programs, along with standards that need routine monitoring across soil, air, and water. According to a data report published by the CISA Government in 2023, the chemical sector in the region, particularly in the U.S., has converted raw materials into over 70,000 diversified products, which are crucial to modernized life. In addition, these are readily distributed to over 750,000 end users throughout the nation. Besides, 700,000 chemical facilities in the U.S., usually ranging from chemical distributors to petrochemical manufacturers, to utilized, stored, manufactured, delivered, or transported chemicals, along with a global and complicated supply chain, thus suitable for the environmental testing market’s growth.
The U.S. Economy in the Chemical Sector in North America (2023)
|
Components |
Units |
|
Chemical Industry Valuation |
USD 486 billion |
|
Overall U.S. GDP |
25% |
|
Goods Manufactured |
96% |
|
Global Chemical Supply |
13% from the U.S. |
|
Direct Employment |
529,000 |
|
Job Opportunity |
6.8 jobs |
|
Jobs Created |
Over 4.1 million |
|
Chemical Exports |
USD 125.3 billion |
|
Chemicals and Related Products |
10% of every USD 1 of U.S. exports |
Source: CISA Government
The U.S. in the environmental testing market is growing significantly, owing to industrial scale driving the testing demand, regulatory drivers, the federal budget perspective, along with the sector’s importance and infrastructure. As per an article published by the Trade Government in 2025, the country effectively exported more than USD 494 billion worth of chemicals as of 2022. In addition, the country is considered a notable leader in chemical production, with more than 13% of the world’s chemicals emerging from the U.S. Moreover, this particular sector’s 14,000 establishments produce more than 70,000 products. Besides, in the middle of 2024, the country’s chemical manufacturing industry has directly employed more than 902,300 employees. Moreover, the overall FDI in the industry has been USD 766.7 billion as of 2023, thus denoting a positive impact on the market’s upliftment.
Canada in the environmental testing market is also growing due to the Environmental Protection Act, Environment and Climate Change Canada priorities, along with substance management, chemical safety standards, corporate sustainability, and the presence of government programs and expenditure. As stated in an article published by the Government of Canada in October 2025, a total of USD 29 billion has been successfully committed at the federal level for cleantech projects. In addition, more than 8,300 funding agreements have been readily signed with beneficiaries. Moreover, for funded cleantech projects, the medical deal value is USD 278,000, and meanwhile, the most common beneficiaries are non-profit organizations, having gained more than USD 21 billion in funding. Therefore, with such investments and deals, there is a huge growth opportunity for the environmental testing market in the country.
Cleantech Funding Committed in Canada (2016-2024)
|
Years |
Fund Amount (USD) |
|
2016 |
0.2 billion |
|
2017 |
1.4 billion |
|
2018 |
1.3 billion |
|
2019 |
1.8 billion |
|
2020 |
2.3 billion |
|
2021 |
4.1 billion |
|
2022 |
6.2 billion |
|
2023 |
7.7 billion |
|
2024 |
4.3 billion |
Source: Government of Canada
Europe Market Insights
Europe in the environmental testing market is expected to emerge as the fastest-growing region during the forecast period. The market’s development in the region is highly propelled by the existence of strict regulatory frameworks, decarbonization projects, circular economy strategies, and tightened contaminant thresholds for expanding testing across waste, air, soil, and water. According to an article published by the Europe Environment Agency in December 2024, 51% to 60% of rivers, along with 11% to 35% of lakes, and 47% to 100% of coastal and transitional waters have exceeded the yearly average environmental quality standards for perfluorooctane sulfonate (PFOS) in the overall region. Besides, the Forever Pollution project has readily estimated that there exist almost 23,000 per- and polyfluoroalkyl substances (PFAS), of which 2,300 are considered hotspots with increased pollution levels, thereby enhancing the market’s demand.
Germany in the environmental testing market is gaining increased exposure, owing to sustained growth in sustainable chemicals, strong standards implementation, and upscaling of its very own manufacturing and chemical base. As per an article published by the ITA in August 2025, the advanced manufacturing industry in the country amounts to USD 991,050 million in total exports, which is followed by USD 721,621 million in total imports. In addition, USD 36,753 million caters to imports from the U.S., USD 269,429 million in trade surplus, and 1.0 as the EUR-USD exchange rate. Moreover, organizations in the country are implementing futuristic plans to expand by 64% in Enterprise Resource Planning (ERP), 75% in Manufacturing Execution Systems (MES), 72% in cloud-based systems, and 70% in cybersecurity, thus creating an optimistic outlook for the market’s development.
France in the environmental testing market is also developing due to modernization in industrial testing infrastructure, sustainability initiatives, and escalated regulatory environments. Additionally, the presence of PFAS policies, stringent effluent and emissions controls, along with an increase in the adoption of online and rapid monitoring, are other drivers fueling the market’s growth in the country. As per an article published by NLM in December 2022, the country spends over USD 695 million on water pollution expenses, which has been allocated to diminish nitrate and pesticide emissions from agriculture. Besides, the human ecosystem and health impact, owing to the nitrogen pollution of seas and rivers, is almost USD 164 million in the overall region. Therefore, with all these expenses, there is a huge focus on treating water for human consumption, which in turn, is proliferating the market’s development.
APAC Market Insights
The Asia Pacific in the environmental testing market is projected to witness considerable growth by the end of the stipulated timeline. The market’s growth in the region is extremely propelled by the presence of stringent pollutant standards across air, soil, and water, increased urbanization, and industrial scale. According to an article published by the World Bank Organization in October 2025, industrial projects cater to 4.8% growth in regional projects. In this regard, Vietnam is gradually leading at a 6.6% growth, which is followed by 5.9% growth for Mongolia, and 5.3% growth for Philippines. Besides, Cambodia, Indonesia, and China are each expected to grow at 4.8%, and meanwhile, countries in Pacific Island are predicted to grow at 2.7%, along with Thailand at 2.0%. Therefore, with this continuous growth in industries, the market in the overall region is continuously expanding with huge growth opportunities.
The environmental testing market in China is gaining increased traction, owing to the presence of a massive chemical base, intensified environmental compliance, and continuous investment in advanced manufacturing and specialty chemicals. As per an article published by the ITIF Organization in April 2024, the country accounted for 44% of international chemical production, along with 46% of capital investment. However, the country is regarded as leading the world in terms of chemical industry sales, accounting for over 40% of the international market, with a major focus on basic chemicals. Besides, China accounts for almost 55% of the international capacity for acetic acid, nearly 50% of the global carbon black capacity, and about 45% of the worldwide capacity for titanium dioxide. Therefore, with these huge contributions in the world’s chemical sector, the market in the country is gaining increased importance.
The environmental testing market in India is also growing due to rapid industrial expansion, policy modernization, and capacity build-out across utilities, infrastructure, pharma, and chemicals. As stated in a data report published by the IBEF Organization in August 2025, manufacturing has emerged as the ultimate central pillar of the country’s economic growth, readily contributing to 16% to 17% of the GDP, and employing more than 27 million workers. The presence of government strategies, such as production-linked incentive (PLI) and Make in India schemes, has resulted in targeting manufacturing to cater to 25% of GDP in the future. Besides, there has been a surge in the industry’s momentum, when the HSBC India Manufacturing PMI successfully hit a 16-month high of 59.1, attributed to rapid increase in factory orders, thereby suitable for uplifting the market.
Key Environmental Testing Market Players:
- SGS SA (Switzerland)
- Company Overview
- Business Strategy
- Key Product Offerings
- Financial Performance
- Key Performance Indicators
- Risk Analysis
- Recent Development
- Regional Presence
- SWOT Analysis
- Bureau Veritas (France)
- Eurofins Scientific (Luxembourg)
- Intertek Group plc (U.K.)
- TÜV SÜD (Germany)
- TÜV Rheinland (Germany)
- ALS Limited (Australia)
- Mérieux NutriSciences (France)
- Element Materials Technology (U.K.)
- UL Solutions (U.S.)
- Pace Analytical Services (U.S.)
- Microbac Laboratories (U.S.)
- Eurofins TestAmerica (U.S.)
- Agilent Technologies (U.S.)
- Shimadzu Corporation (Japan)
- Korea Testing & Research Institute (KTR) (South Korea)
- Korea Conformity Laboratories (KCL) (South Korea)
- Vimta Labs (India)
- Spectro Analytical Labs (India)
- SIRIM Berhad (Malaysia)
- SGS SA is one of the largest global players in testing, inspection, and certification, with a strong footprint in environmental testing. Its extensive laboratory network enables compliance with international standards, supporting industries in water, soil, and air monitoring.
- Bureau Veritas provides comprehensive environmental testing and certification services, focusing on sustainability and regulatory compliance. The company’s expertise in emissions monitoring and waste management positions it as a key partner for industrial and municipal clients.
- Eurofins Scientific operates one of the world’s largest networks of environmental laboratories, offering advanced analytical services. Its leadership in PFAS testing and rapid detection technologies makes it a critical provider for evolving regulatory needs.
- Intertek Group plc delivers environmental testing solutions integrated with quality assurance and risk management. The company emphasizes innovation in rapid testing methods and digital compliance platforms, serving global industries under tightening environmental regulations.
- TÜV SÜD is one of the major Europe-based providers of environmental testing, certification, and auditing services. Its focus on industrial emissions, wastewater, and soil contamination testing aligns with EU sustainability directives and circular economy initiatives.
Here is a list of key players operating in the global market:
The international environmental testing market is concentrated among global TIC leaders and specialized labs expanding capabilities via acquisitions, lab network densification, and advanced analytics investments. Players pursue AI-enabled data platforms, automated/online monitoring, and PFAS-heavy method development to meet tightening standards. Cross‑border compliance services, sector-focused centers of excellence, and partnerships with public agencies enhance credibility and recurring revenue. Capacity scaling in semiconductor, water utilities, and industrial emissions testing reinforces differentiation, while digital chain‑of‑custody and rapid TAT offerings sharpen competitive edges. Besides, in December 2025, SGS has successfully gained an A-leadership score during the 2025 Carbon Disclosure Project (CDP) assessment. This readily reflected the company’s sustained efforts to expand transparent environmental disclosure as well as embed climate action into operational and tactical decisions, thereby driving the environmental testing market globally.
Corporate Landscape of the Environmental Testing Market:
Recent Developments
- In November 2025, Angelantoni Test Technologies S.r.l. (ATT) announced a huge corporate and business reorganization, which is aimed at enhancing and expanding its environmental testing service division domestically and globally.
- In September 2025, Intertek Group plc notified the acquisition of Envirolab for significantly establishing as one of the leaders in Australia’s attractive environmental testing sector by compelling commercial synergies through its wide-ranging client base and complementary industry resulting in sustainability solutions.
- Report ID: 2713
- Published Date: Dec 23, 2025
- Report Format: PDF, PPT
- Explore a preview of key market trends and insights
- Review sample data tables and segment breakdowns
- Experience the quality of our visual data representations
- Evaluate our report structure and research methodology
- Get a glimpse of competitive landscape analysis
- Understand how regional forecasts are presented
- Assess the depth of company profiling and benchmarking
- Preview how actionable insights can support your strategy
Explore real data and analysis
Frequently Asked Questions (FAQ)
About this Report
Connect with our Expert


Copyright @ 2026 Research Nester. All Rights Reserved.
