Global Enterprise AI Market
1. An Outline of the Global Enterprise AI Market
1.1. Market Definition and Segmentation
1.2. Study Assumptions and Abbreviations
2. Research Methodology & Approach
2.1. Primary Research
2.2. Secondary Research
2.3. Data Triangulation
2.4. SPSS Methodology
3. Executive Summary
4. Growth Drivers
5. Major Roadblocks
6. Opportunities
7. Prevalent Trends
8. Government Regulation
9. Growth Outlook
10. Competitive White Space Analysis – Identifying Untapped Market Gaps
11. Risk Overview
12. SWOT
13. Technological Advancement
14. Technology Maturity Matrix for the Enterprise AI Market: Recent News
15. Regional Demand
16. Global Enterprise AI by Geography – Strategic Comparative Analysis
17. Strategic Segment Analysis: Enterprise AI Demand Landscape
18. Enterprise AI Demand Trends Driven by intelligent automation, predictive analytics, customer experience personalization, cloud integration, generative AI innovation, and regulatory compliance solutions, collectively shaping how enterprises adopt and scale AI across industries (2026-2035)
19. Root Cause Analysis (RCA) for discovering problems of the Enterprise AI Market
20. Porter Five Forces
21. PESTLE
22. Comparative Positioning
23. Global Enterprise AI – Key Player Analysis (2035)
24. Competitive Landscape: Key Suppliers/Players
25. Competitive Model: A Detailed Inside View for Investors
26. Company Market Share, 2035 (%)
26.1. Amazon Web Services, Inc.
26.2. Baidu, Inc.
26.3. C3.ai, Inc.
26.4. Databricks
26.5. Google LLC (Alphabet Inc.)
26.6. International Business Machines Corporation
26.7. Infosys Limited
26.8. Microsoft Corporation
26.9. NVIDIA Corporation
26.10. Oracle Corporation
26.11. Salesforce, Inc.
26.12. Samsung SDS Co., Ltd.
26.13. SAP SE
26.14. ServiceNow, Inc.
26.15. UiPath
27. Global Enterprise AI Market Outlook
27.1. Market Overview
27.1.1. Market Revenue by Value (USD Million), and Compound Annual Growth Rate (CAGR)
27.2. Enterprise AI Market Segmentation Analysis (2026-2035)
27.2.1. By Component
27.2.1.1. Software and Platform, Market Value (USD Million), and CAGR, 2026-2035F
27.2.1.2. Services, Market Value (USD Million), and CAGR, 2026-2035F
27.2.1.3. Hardware Accelerators, Market Value (USD Million), and CAGR, 2026-2035F
27.2.1. By Organization Size
27.2.1.1. Large Enterprise (≥1,000 Employees), Market Value (USD Million), and CAGR, 2026-2035F
27.2.1.2. Mid-Enterprise (100-999), Market Value (USD Million), and CAGR, 2026-2035F
27.2.1.3. Small Enterprise (<100), Market Value (USD Million), and CAGR, 2026-2035F
27.2.2. By Functional Area
27.2.2.1. Customer-facing (CX, Marketing, Sales), Market Value (USD Million), and CAGR, 2026-2035F
27.2.2.2. Operations and Supply Chain, Market Value (USD Million), and CAGR, 2026-2035F
27.2.2.3. Finance and Risk, Market Value (USD Million), and CAGR, 2026-2035F
27.2.2.4. HR and Talent, Market Value (USD Million), and CAGR, 2026-2035F
27.2.3. By Technology
27.2.3.1. Machine Learning/Foundation Models, Market Value (USD Million), and CAGR, 2026-2035F
27.2.3.2. Natural-Language Processing, Market Value (USD Million), and CAGR, 2026-2035F
27.2.3.3. Computer-Vision, Market Value (USD Million), and CAGR, 2026-2035F
27.2.3.4. Decision Intelligence/Optimization, Market Value (USD Million), and CAGR, 2026-2035F
27.2.4. By Deployment Model
27.2.4.1. On-Premise, Market Value (USD Million), and CAGR, 2026-2035F
27.2.4.2. Cloud, Market Value (USD Million), and CAGR, 2026-2035F
27.2.4.3. Hybrid/Edge, Market Value (USD Million), and CAGR, 2026-2035F
27.2.5. By End use Industry
27.2.5.1. BFSI, Market Value (USD Million), and CAGR, 2026-2035F
27.2.5.2. Manufacturing, Market Value (USD Million), and CAGR, 2026-2035F
27.2.5.3. Automotive and Mobility, Market Value (USD Million), and CAGR, 2026-2035F
27.2.5.4. IT and Telecom, Market Value (USD Million), and CAGR, 2026-2035F
27.2.5.5. Media and Advertising, Market Value (USD Million), and CAGR, 2026-2035F
27.2.5.6. Healthcare and Life Sciences, Market Value (USD Million), and CAGR, 2026-2035F
27.2.5.7. Retail and e-Commerce, Market Value (USD Million), and CAGR, 2026-2035F
27.2.5.8. Energy and Utilities, Market Value (USD Million), and CAGR, 2026-2035F
27.2.5.9. Others, Market Value (USD Million), and CAGR, 2026-2035F
27.2.6. Regional Synopsis, Value (USD Million), 2026-2035
27.2.6.1. North America Market Value (USD Million) and CAGR & Y-o-Y Growth Trend, 2026-2035F
27.2.6.2. Europe Market Value (USD Million) and CAGR & Y-o-Y Growth Trend, 2026-2035F
27.2.6.3. Asia Pacific Market Value (USD Million) and CAGR & Y-o-Y Growth Trend, 2026-2035F
27.2.6.4. Latin America Market Value (USD Million) and CAGR & Y-o-Y Growth Trend, 2026-2035F
27.2.6.5. Middle East and Africa Market Value (USD Million) and CAGR & Y-o-Y Growth Trend, 2026-2035F
28. North America Market
28.2. Overview
28.2.1. Market Value (USD Million), Current and Future Projections, 2026-2035
28.2.2. Increment $ Opportunity Assessment, 2026-2035
28.3. Segmentation (USD Million), 2026-2035, By
27.2.2. By Component
27.2.2.1. Software and Platform, Market Value (USD Million), and CAGR, 2026-2035F
27.2.2.2. Services, Market Value (USD Million), and CAGR, 2026-2035F
27.2.2.3. Hardware Accelerators, Market Value (USD Million), and CAGR, 2026-2035F
28.3.1. By Organization Size
28.3.1.1. Large Enterprise (≥1,000 Employees), Market Value (USD Million), and CAGR, 2026-2035F
28.3.1.2. Mid-Enterprise (100-999), Market Value (USD Million), and CAGR, 2026-2035F
28.3.1.3. Small Enterprise (<100), Market Value (USD Million), and CAGR, 2026-2035F
28.3.2. By Functional Area
28.3.2.1. Customer-facing (CX, Marketing, Sales), Market Value (USD Million), and CAGR, 2026-2035F
28.3.2.2. Operations and Supply Chain, Market Value (USD Million), and CAGR, 2026-2035F
28.3.2.3. Finance and Risk, Market Value (USD Million), and CAGR, 2026-2035F
28.3.2.4. HR and Talent, Market Value (USD Million), and CAGR, 2026-2035F
28.3.3. By Technology
28.3.3.1. Machine Learning/Foundation Models, Market Value (USD Million), and CAGR, 2026-2035F
28.3.3.2. Natural-Language Processing, Market Value (USD Million), and CAGR, 2026-2035F
28.3.3.3. Computer-Vision, Market Value (USD Million), and CAGR, 2026-2035F
28.3.3.4. Decision Intelligence/Optimization, Market Value (USD Million), and CAGR, 2026-2035F
28.3.4. By Deployment Model
28.3.4.1. On-Premise, Market Value (USD Million), and CAGR, 2026-2035F
28.3.4.2. Cloud, Market Value (USD Million), and CAGR, 2026-2035F
28.3.4.3. Hybrid/Edge, Market Value (USD Million), and CAGR, 2026-2035F
28.3.5. By End use Industry
28.3.5.1. BFSI, Market Value (USD Million), and CAGR, 2026-2035F
28.3.5.2. Manufacturing, Market Value (USD Million), and CAGR, 2026-2035F
28.3.5.3. Automotive and Mobility, Market Value (USD Million), and CAGR, 2026-2035F
28.3.5.4. IT and Telecom, Market Value (USD Million), and CAGR, 2026-2035F
28.3.5.5. Media and Advertising, Market Value (USD Million), and CAGR, 2026-2035F
28.3.5.6. Healthcare and Life Sciences, Market Value (USD Million), and CAGR, 2026-2035F
28.3.5.7. Retail and e-Commerce, Market Value (USD Million), and CAGR, 2026-2035F
28.3.5.8. Energy and Utilities, Market Value (USD Million), and CAGR, 2026-2035F
28.3.5.9. Others, Market Value (USD Million), and CAGR, 2026-2035F
28.3.6. Country Level Analysis, Value (USD Million)
28.3.6.1. U.S. Market Value (USD Million) and CAGR & Y-o-Y Growth Trend, 2026-2035F
28.3.6.2. Canada Market Value (USD Million) and CAGR & Y-o-Y Growth Trend, 2026-2035F
29. Europe Market
29.2. Overview
29.2.1. Market Value (USD Million), Current and Future Projections, 2026-2035
29.2.2. Increment $ Opportunity Assessment, 2026-2035
29.3. Segmentation (USD Million), 2026-2035, By
27.2.3. By Component
27.2.3.1. Software and Platform, Market Value (USD Million), and CAGR, 2026-2035F
27.2.3.2. Services, Market Value (USD Million), and CAGR, 2026-2035F
27.2.3.3. Hardware Accelerators, Market Value (USD Million), and CAGR, 2026-2035F
29.3.1. By Organization Size
29.3.1.1. Large Enterprise (≥1,000 Employees), Market Value (USD Million), and CAGR, 2026-2035F
29.3.1.2. Mid-Enterprise (100-999), Market Value (USD Million), and CAGR, 2026-2035F
29.3.1.3. Small Enterprise (<100), Market Value (USD Million), and CAGR, 2026-2035F
29.3.2. By Functional Area
29.3.2.1. Customer-facing (CX, Marketing, Sales), Market Value (USD Million), and CAGR, 2026-2035F
29.3.2.2. Operations and Supply Chain, Market Value (USD Million), and CAGR, 2026-2035F
29.3.2.3. Finance and Risk, Market Value (USD Million), and CAGR, 2026-2035F
29.3.2.4. HR and Talent, Market Value (USD Million), and CAGR, 2026-2035F
29.3.3. By Technology
29.3.3.1. Machine Learning/Foundation Models, Market Value (USD Million), and CAGR, 2026-2035F
29.3.3.2. Natural-Language Processing, Market Value (USD Million), and CAGR, 2026-2035F
29.3.3.3. Computer-Vision, Market Value (USD Million), and CAGR, 2026-2035F
29.3.3.4. Decision Intelligence/Optimization, Market Value (USD Million), and CAGR, 2026-2035F
29.3.4. By Deployment Model
29.3.4.1. On-Premise, Market Value (USD Million), and CAGR, 2026-2035F
29.3.4.2. Cloud, Market Value (USD Million), and CAGR, 2026-2035F
29.3.4.3. Hybrid/Edge, Market Value (USD Million), and CAGR, 2026-2035F
29.3.5. By End use Industry
29.3.5.1. BFSI, Market Value (USD Million), and CAGR, 2026-2035F
29.3.5.2. Manufacturing, Market Value (USD Million), and CAGR, 2026-2035F
29.3.5.3. Automotive and Mobility, Market Value (USD Million), and CAGR, 2026-2035F
29.3.5.4. IT and Telecom, Market Value (USD Million), and CAGR, 2026-2035F
29.3.5.5. Media and Advertising, Market Value (USD Million), and CAGR, 2026-2035F
29.3.5.6. Healthcare and Life Sciences, Market Value (USD Million), and CAGR, 2026-2035F
29.3.5.7. Retail and e-Commerce, Market Value (USD Million), and CAGR, 2026-2035F
29.3.5.8. Energy and Utilities, Market Value (USD Million), and CAGR, 2026-2035F
29.3.5.9. Others, Market Value (USD Million), and CAGR, 2026-2035F
29.3.6. Country Level Analysis, Value (USD Million)
29.3.6.1. UK Market Value (USD Million) and CAGR & Y-o-Y Growth Trend, 2026-2035F
29.3.6.2. Germany Market Value (USD Million) and CAGR & Y-o-Y Growth Trend, 2026-2035F
29.3.6.3. France Market Value (USD Million) and CAGR & Y-o-Y Growth Trend, 2026-2035F
29.3.6.4. Italy Market Value (USD Million) and CAGR & Y-o-Y Growth Trend, 2026-2035F
29.3.6.5. Spain Market Value (USD Million) and CAGR & Y-o-Y Growth Trend, 2026-2035F
29.3.6.6. Netherlands Market Value (USD Million) and CAGR & Y-o-Y Growth Trend, 2026-2035F
29.3.6.7. Russia Market Value (USD Million) and CAGR & Y-o-Y Growth Trend, 2026-2035F
29.3.6.8. Switzerland Market Value (USD Million) and CAGR & Y-o-Y Growth Trend, 2026-2035F
29.3.6.9. Poland Market Value (USD Million) and CAGR & Y-o-Y Growth Trend, 2026-2035F
29.3.6.10. Belgium Market Value (USD Million) and CAGR & Y-o-Y Growth Trend, 2026-2035F
29.3.6.11. Rest of Europe Market Value (USD Million) and CAGR & Y-o-Y Growth Trend, 2026-2035F
30. Asia Pacific Market
30.2. Overview
30.2.1. Market Value (USD Million), Current and Future Projections, 2026-2035
30.2.2. Increment $ Opportunity Assessment, 2026-2035
30.3. Segmentation (USD Million), 2026-2035, By
27.2.4. By Component
27.2.4.1. Software and Platform, Market Value (USD Million), and CAGR, 2026-2035F
27.2.4.2. Services, Market Value (USD Million), and CAGR, 2026-2035F
27.2.4.3. Hardware Accelerators, Market Value (USD Million), and CAGR, 2026-2035F
30.3.1. By Organization Size
30.3.1.1. Large Enterprise (≥1,000 Employees), Market Value (USD Million), and CAGR, 2026-2035F
30.3.1.2. Mid-Enterprise (100-999), Market Value (USD Million), and CAGR, 2026-2035F
30.3.1.3. Small Enterprise (<100), Market Value (USD Million), and CAGR, 2026-2035F
30.3.2. By Functional Area
30.3.2.1. Customer-facing (CX, Marketing, Sales), Market Value (USD Million), and CAGR, 2026-2035F
30.3.2.2. Operations and Supply Chain, Market Value (USD Million), and CAGR, 2026-2035F
30.3.2.3. Finance and Risk, Market Value (USD Million), and CAGR, 2026-2035F
30.3.2.4. HR and Talent, Market Value (USD Million), and CAGR, 2026-2035F
30.3.3. By Technology
30.3.3.1. Machine Learning/Foundation Models, Market Value (USD Million), and CAGR, 2026-2035F
30.3.3.2. Natural-Language Processing, Market Value (USD Million), and CAGR, 2026-2035F
30.3.3.3. Computer-Vision, Market Value (USD Million), and CAGR, 2026-2035F
30.3.3.4. Decision Intelligence/Optimization, Market Value (USD Million), and CAGR, 2026-2035F
30.3.4. By Deployment Model
30.3.4.1. On-Premise, Market Value (USD Million), and CAGR, 2026-2035F
30.3.4.2. Cloud, Market Value (USD Million), and CAGR, 2026-2035F
30.3.4.3. Hybrid/Edge, Market Value (USD Million), and CAGR, 2026-2035F
30.3.5. By End use Industry
30.3.5.1. BFSI, Market Value (USD Million), and CAGR, 2026-2035F
30.3.5.2. Manufacturing, Market Value (USD Million), and CAGR, 2026-2035F
30.3.5.3. Automotive and Mobility, Market Value (USD Million), and CAGR, 2026-2035F
30.3.5.4. IT and Telecom, Market Value (USD Million), and CAGR, 2026-2035F
30.3.5.5. Media and Advertising, Market Value (USD Million), and CAGR, 2026-2035F
30.3.5.6. Healthcare and Life Sciences, Market Value (USD Million), and CAGR, 2026-2035F
30.3.5.7. Retail and e-Commerce, Market Value (USD Million), and CAGR, 2026-2035F
30.3.5.8. Energy and Utilities, Market Value (USD Million), and CAGR, 2026-2035F
30.3.5.9. Others, Market Value (USD Million), and CAGR, 2026-2035F
30.3.6. Country Level Analysis, Value (USD Million)
30.3.6.1. China Market Value (USD Million) and CAGR & Y-o-Y Growth Trend, 2026-2035F
30.3.6.2. India Market Value (USD Million) and CAGR & Y-o-Y Growth Trend, 2026-2035F
30.3.6.3. South Korea Market Value (USD Million) and CAGR & Y-o-Y Growth Trend, 2026-2035F
30.3.6.4. Australia Market Value (USD Million) and CAGR & Y-o-Y Growth Trend, 2026-2035F
30.3.6.5. Indonesia Market Value (USD Million) and CAGR & Y-o-Y Growth Trend, 2026-2035F
30.3.6.6. Malaysia Market Value (USD Million) and CAGR & Y-o-Y Growth Trend, 2026-2035F
30.3.6.7. Vietnam Market Value (USD Million) and CAGR & Y-o-Y Growth Trend, 2026-2035F
30.3.6.8. Thailand Market Value (USD Million) and CAGR & Y-o-Y Growth Trend, 2026-2035F
30.3.6.9. Singapore Market Value (USD Million) and CAGR & Y-o-Y Growth Trend, 2026-2035F
30.3.6.10. New Zealand Market Value (USD Million) and CAGR & Y-o-Y Growth Trend, 2026-2035F
30.3.6.11. Rest of Asia Pacific Excluding Japan Market Value (USD Million) and CAGR & Y-o-Y Growth Trend, 2026-2035F
31. Latin America Market
31.2. Overview
31.2.1. Market Value (USD Million), Current and Future Projections, 2026-2035
31.2.2. Increment $ Opportunity Assessment, 2026-2035
31.2.3. Year-on-Year Growth Forecast (%)
31.3. Segmentation (USD Million), 2026-2035, By
27.2.5. By Component
27.2.5.1. Software and Platform, Market Value (USD Million), and CAGR, 2026-2035F
27.2.5.2. Services, Market Value (USD Million), and CAGR, 2026-2035F
27.2.5.3. Hardware Accelerators, Market Value (USD Million), and CAGR, 2026-2035F
31.3.1. By Organization Size
31.3.1.1. Large Enterprise (≥1,000 Employees), Market Value (USD Million), and CAGR, 2026-2035F
31.3.1.2. Mid-Enterprise (100-999), Market Value (USD Million), and CAGR, 2026-2035F
31.3.1.3. Small Enterprise (<100), Market Value (USD Million), and CAGR, 2026-2035F
31.3.2. By Functional Area
31.3.2.1. Customer-facing (CX, Marketing, Sales), Market Value (USD Million), and CAGR, 2026-2035F
31.3.2.2. Operations and Supply Chain, Market Value (USD Million), and CAGR, 2026-2035F
31.3.2.3. Finance and Risk, Market Value (USD Million), and CAGR, 2026-2035F
31.3.2.4. HR and Talent, Market Value (USD Million), and CAGR, 2026-2035F
31.3.3. By Technology
31.3.3.1. Machine Learning/Foundation Models, Market Value (USD Million), and CAGR, 2026-2035F
31.3.3.2. Natural-Language Processing, Market Value (USD Million), and CAGR, 2026-2035F
31.3.3.3. Computer-Vision, Market Value (USD Million), and CAGR, 2026-2035F
31.3.3.4. Decision Intelligence/Optimization, Market Value (USD Million), and CAGR, 2026-2035F
31.3.4. By Deployment Model
31.3.4.1. On-Premise, Market Value (USD Million), and CAGR, 2026-2035F
31.3.4.2. Cloud, Market Value (USD Million), and CAGR, 2026-2035F
31.3.4.3. Hybrid/Edge, Market Value (USD Million), and CAGR, 2026-2035F
31.3.5. By End use Industry
31.3.5.1. BFSI, Market Value (USD Million), and CAGR, 2026-2035F
31.3.5.2. Manufacturing, Market Value (USD Million), and CAGR, 2026-2035F
31.3.5.3. Automotive and Mobility, Market Value (USD Million), and CAGR, 2026-2035F
31.3.5.4. IT and Telecom, Market Value (USD Million), and CAGR, 2026-2035F
31.3.5.5. Media and Advertising, Market Value (USD Million), and CAGR, 2026-2035F
31.3.5.6. Healthcare and Life Sciences, Market Value (USD Million), and CAGR, 2026-2035F
31.3.5.7. Retail and e-Commerce, Market Value (USD Million), and CAGR, 2026-2035F
31.3.5.8. Energy and Utilities, Market Value (USD Million), and CAGR, 2026-2035F
31.3.5.9. Others, Market Value (USD Million), and CAGR, 2026-2035F
31.3.6. Country Level Analysis, Value (USD Million)
31.3.6.1. Brazil Market Value (USD Million) and CAGR & Y-o-Y Growth Trend, 2026-2035F
31.3.6.2. Argentina Market Value (USD Million) and CAGR & Y-o-Y Growth Trend, 2026-2035F
31.3.6.3. Mexico Market Value (USD Million) and CAGR & Y-o-Y Growth Trend, 2026-2035F
31.3.6.4. Rest of Latin America Market Value (USD Million) and CAGR & Y-o-Y Growth Trend, 2026-2035F
32. Middle East & Africa Market
32.2. Overview
32.2.1. Market Value (USD Million), Current and Future Projections, 2026-2035
32.2.2. Increment $ Opportunity Assessment, 2026-2035
32.2.3. Year-on-Year Growth Forecast (%)
32.3. Segmentation (USD Million), 2026-2035, By
27.2.6. By Component
27.2.6.1. Software and Platform, Market Value (USD Million), and CAGR, 2026-2035F
27.2.6.2. Services, Market Value (USD Million), and CAGR, 2026-2035F
27.2.6.3. Hardware Accelerators, Market Value (USD Million), and CAGR, 2026-2035F
32.3.1. By Organization Size
32.3.1.1. Large Enterprise (≥1,000 Employees), Market Value (USD Million), and CAGR, 2026-2035F
32.3.1.2. Mid-Enterprise (100-999), Market Value (USD Million), and CAGR, 2026-2035F
32.3.1.3. Small Enterprise (<100), Market Value (USD Million), and CAGR, 2026-2035F
32.3.2. By Functional Area
32.3.2.1. Customer-facing (CX, Marketing, Sales), Market Value (USD Million), and CAGR, 2026-2035F
32.3.2.2. Operations and Supply Chain, Market Value (USD Million), and CAGR, 2026-2035F
32.3.2.3. Finance and Risk, Market Value (USD Million), and CAGR, 2026-2035F
32.3.2.4. HR and Talent, Market Value (USD Million), and CAGR, 2026-2035F
32.3.3. By Technology
32.3.3.1. Machine Learning/Foundation Models, Market Value (USD Million), and CAGR, 2026-2035F
32.3.3.2. Natural-Language Processing, Market Value (USD Million), and CAGR, 2026-2035F
32.3.3.3. Computer-Vision, Market Value (USD Million), and CAGR, 2026-2035F
32.3.3.4. Decision Intelligence/Optimization, Market Value (USD Million), and CAGR, 2026-2035F
32.3.4. By Deployment Model
32.3.4.1. On-Premise, Market Value (USD Million), and CAGR, 2026-2035F
32.3.4.2. Cloud, Market Value (USD Million), and CAGR, 2026-2035F
32.3.4.3. Hybrid/Edge, Market Value (USD Million), and CAGR, 2026-2035F
32.3.5. By End use Industry
32.3.5.1. BFSI, Market Value (USD Million), and CAGR, 2026-2035F
32.3.5.2. Manufacturing, Market Value (USD Million), and CAGR, 2026-2035F
32.3.5.3. Automotive and Mobility, Market Value (USD Million), and CAGR, 2026-2035F
32.3.5.4. IT and Telecom, Market Value (USD Million), and CAGR, 2026-2035F
32.3.5.5. Media and Advertising, Market Value (USD Million), and CAGR, 2026-2035F
32.3.5.6. Healthcare and Life Sciences, Market Value (USD Million), and CAGR, 2026-2035F
32.3.5.7. Retail and e-Commerce, Market Value (USD Million), and CAGR, 2026-2035F
32.3.5.8. Energy and Utilities, Market Value (USD Million), and CAGR, 2026-2035F
32.3.5.9. Others, Market Value (USD Million), and CAGR, 2026-2035F
32.3.6. Country Level Analysis, Value (USD Million)
32.3.6.1. Saudi Arabia Market Value (USD Million) and CAGR & Y-o-Y Growth Trend, 2026-2035F
32.3.6.2. UAE Market Value (USD Million) and CAGR & Y-o-Y Growth Trend, 2026-2035F
32.3.6.3. Israel Market Value (USD Million) and CAGR & Y-o-Y Growth Trend, 2026-2035F
32.3.6.4. Qatar Market Value (USD Million) and CAGR & Y-o-Y Growth Trend, 2026-2035F
32.3.6.5. Kuwait Market Value (USD Million) and CAGR & Y-o-Y Growth Trend, 2026-2035F
32.3.6.6. Oman Market Value (USD Million) and CAGR & Y-o-Y Growth Trend, 2026-2035F
32.3.6.7. South Africa Market Value (USD Million) and CAGR & Y-o-Y Growth Trend, 2026-2035F
32.3.6.8. Rest of Middle East & Africa Market Value (USD Million) and CAGR & Y-o-Y Growth Trend, 2026-2035F
33. Global Economic Scenario
33.2. World Economic Outlook
34. About Research Nester
34.2. Our Global Clientele
34.3. We Serve Clients Across World
Enterprise AI Market Outlook:
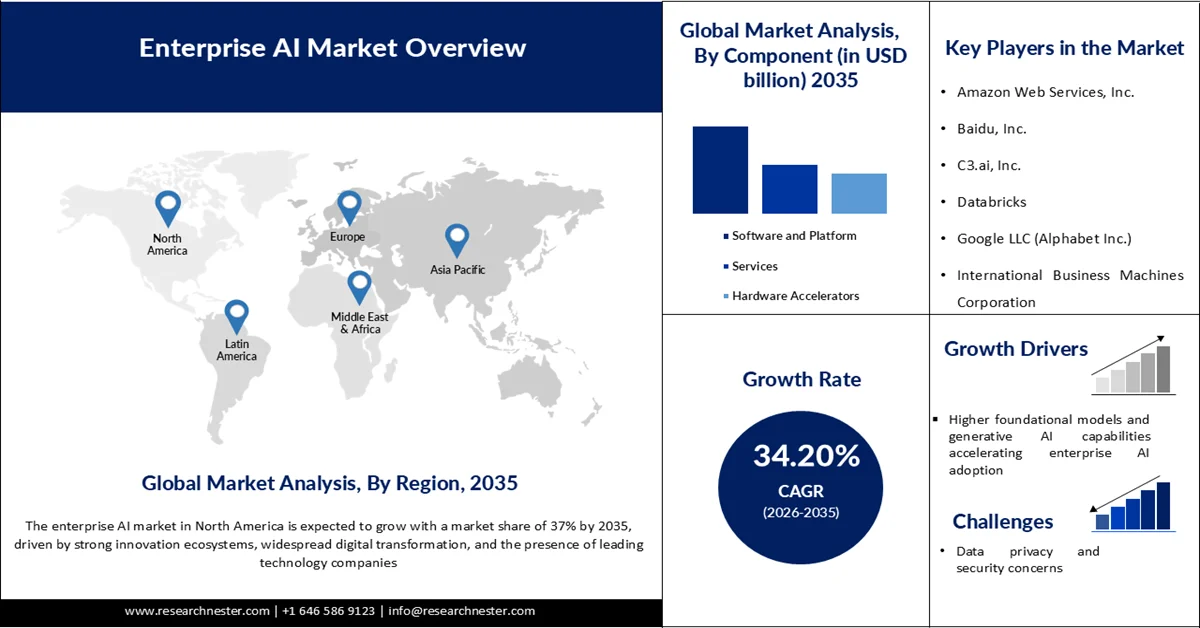
Enterprise AI Market size was valued at USD 30.18 billion in 2025 and is projected to reach USD 570.36 billion by the end of 2035, growing at a CAGR of 34.20% during the forecast period, i.e., 2026-2035. In 2026, the industry size of enterprise AI is evaluated at USD 40.41 billion.
The global enterprise AI market is being propelled by widespread adoption of AI technologies across business functions, particularly in professional services, finance, healthcare, and manufacturing. According to the Federal Reserve Board (FEDS Notes, 2026), about 18% of U.S. firms had adopted AI by the end of 2025, with adoption growing 68% year-over-year before a methodological adjustment. Globally, the International Data Center Authority (IDCA) reports that 87% of companies identify AI as a top business priority, with 76% already using AI and 69% deploying generative AI in at least one function. These statistics highlight how enterprises are leveraging AI to enhance efficiency, reduce costs, and create new value streams.
Beyond adoption rates, another major driver of the enterprise AI market is the explosion of data and the need for advanced analytics. Enterprises are generating unprecedented volumes of structured and unstructured data, and AI provides the tools to process, interpret, and act on this information in real time. This surge in data has made AI indispensable for predictive analytics, customer personalization, and operational efficiency. By enabling organizations to transform raw data into actionable insights, AI is not only improving decision-making but also creating new business models, reinforcing its role as the primary growth engine of the enterprise technology ecosystem.
Key Enterprise AI Market Insights Summary:
Regional Insights:
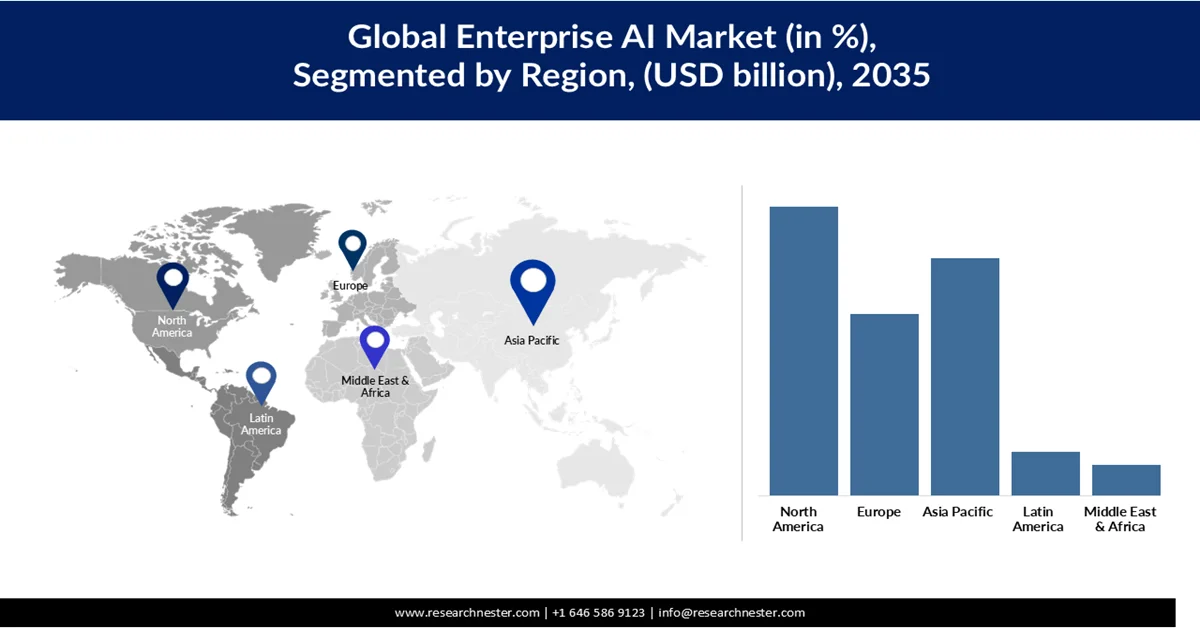
- The North America region is projected to account for 37% share of the enterprise AI market by 2035, fueled by strong innovation ecosystems, advanced digital infrastructure, widespread cloud adoption, and the presence of major technology companies
- Asia Pacific is anticipated to emerge as the fastest-growing region in the market throughout 2026-2035, accelerated by rapid digital transformation initiatives, increasing cloud technology adoption, and government-backed AI innovation programs across major economies
Segment Insights:
- The software and platform segment is anticipated to secure 49% of the enterprise AI market share by 2035, propelled by increasing enterprise dependence on scalable AI platforms and cloud-integrated software for automation, analytics, and operational transformation
- The large enterprises (≥1000 employees) segment is forecast to dominate with a 66.1% share by 2035, stimulated by rising investments in enterprise-wide AI transformation, scalable deployment ecosystems, and workforce upskilling initiatives
Key Growth Trends:
- Higher foundational models and generative AI capabilities accelerating enterprise AI adoption
- Widespread adoption of cloud-based AI infrastructure
Major Challenges:
- Data privacy and security concerns
- Data quality and availability issues
Key Players: Amazon Web Services, Inc., Baidu, Inc., C3.ai, Inc., Databricks, Google LLC (Alphabet Inc.), International Business Machines Corporation, Infosys Limited, Microsoft Corporation, NVIDIA Corporation, Oracle Corporation, Salesforce, Inc., Samsung SDS Co., Ltd., SAP SE, ServiceNow, Inc..
Global Enterprise AI Market Forecast and Regional Outlook:
Market Size & Growth Projections:
- 2025 Market Size: USD 30.18 billion
- 2026 Market Size: USD 40.41 billion
- Projected Market Size: USD 570.36 billion by 2035
- Growth Forecasts: 34.20% CAGR (2026-2035)
Key Regional Dynamics:
- Largest Region: North America (37% Share by 2035)
- Fastest Growing Region: Asia Pacific
- Dominating Countries: United States, China, Japan, Germany, United Kingdom
- Emerging Countries: India, Singapore, South Korea, United Arab Emirates, Brazil
Last updated on : 27 May, 2026
Enterprise AI Market - Growth Drivers and Challenges
Growth Drivers
- Higher foundational models and generative AI capabilities accelerating enterprise AI adoption: Advancements in foundational models and generative AI have significantly accelerated enterprise adoption by making AI systems more accessible, scalable, and versatile across industries. Modern generative AI tools can perform complex tasks such as content creation, coding, and decision support, reducing the need for extensive model training and customization. According to the OECD, more than one-third (36.8%) of individuals used generative AI tools in 2025, highlighting how rapidly these technologies have become mainstream. This widespread familiarity among the workforce is enabling enterprises to integrate AI into everyday business processes more easily. Additionally, the availability of general-purpose AI systems has lowered technical barriers, allowing organizations to deploy AI solutions faster and at lower cost. As these models continue to improve in capability and multimodal functionality, enterprises are increasingly embedding them into core operations. This shift is transforming AI from a niche innovation into a foundational business capability driving productivity and innovation.
- Widespread adoption of cloud-based AI infrastructure: The expansion of cloud-based infrastructure has played a critical role in enabling enterprise AI adoption by providing scalable computing power, storage, and on-demand access to advanced AI tools. Cloud platforms eliminate the need for heavy upfront investment in hardware, making AI deployment more cost-effective and accessible to organizations of all sizes. OECD data shows that AI adoption among firms reached 20.2% in 2025, up from 8.7% in 2023, more than doubling in just two years. This rapid growth is closely linked to improved infrastructure availability, particularly through cloud ecosystems that support data processing and model deployment at scale. Furthermore, AI adoption is significantly higher in digitally intensive sectors, with 57.3% of ICT firms using AI, demonstrating the importance of strong digital and cloud capabilities. Cloud infrastructure also enables real-time analytics, global scalability, and integration with enterprise systems, making it a key driver of AI adoption. As organizations continue to modernize their IT environments, cloud-based AI infrastructure will remain central to scaling enterprise AI initiatives.
Businesses using AI, OECD area, selected industries, % of enterprises
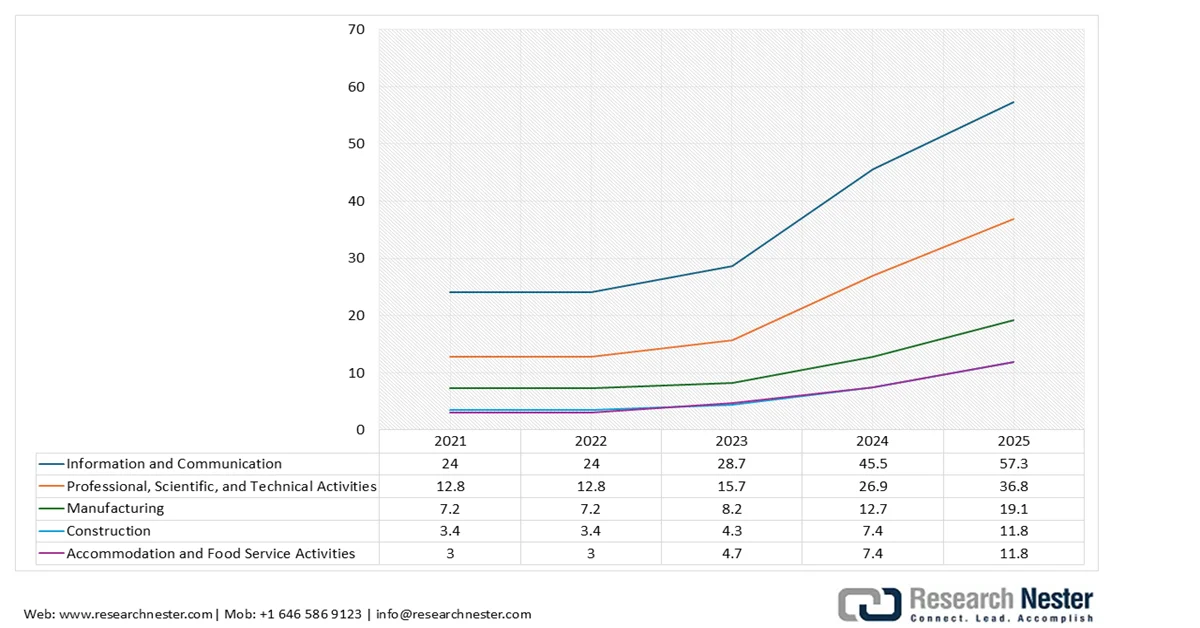
Source: oecd.org
- Surge in automation-driven operations: The increasing need for efficiency and productivity has led to a surge in automation-driven operations powered by AI technologies across enterprises. Organizations are leveraging AI to automate repetitive tasks, enhance decision-making, and optimize workflows in areas such as customer service, manufacturing, and logistics. OECD findings indicate that while AI adoption in core business functions is still developing, it remains relatively low, ranging from about 1.9% in Japan to 6.1% in the U.S. in 2024, highlighting significant potential for future automation growth. Automation driven by AI improves accuracy, reduces operational costs, and enhances scalability, enabling organizations to respond more effectively to enterprise AI market demands. As adoption deepens, enterprises are expected to move from partial automation to fully AI-integrated operations. This trend is reshaping traditional business models and driving the transition toward more agile, data-driven enterprises.
Challenges
- Data privacy and security concerns: Data privacy and security concerns remain a major restraint on AI adoption, as enterprises must handle vast amounts of sensitive and personal data while complying with strict regulatory frameworks. Laws such as the General Data Protection Regulation (GDPR) and evolving national data protection rules impose heavy compliance requirements, increasing the cost and complexity of AI deployments. Organizations also face rising risks of data breaches, model misuse, and cyberattacks targeting AI systems, which can expose confidential information or compromise decision-making processes. The use of generative AI further amplifies concerns around data leakage and unauthorized access to proprietary data. As a result, many enterprises proceed cautiously, delaying or limiting AI adoption until robust governance, encryption, and risk management frameworks are in place.
- Data quality and availability issues: The effectiveness of AI systems heavily depends on the quality, consistency, and availability of data, making poor data management a key restraint for enterprises. Many organizations struggle with fragmented, incomplete, or biased datasets, which can lead to inaccurate predictions and unreliable AI outputs. Inconsistent data standards across departments and legacy systems further complicate data integration and model training. Additionally, limited access to large, well-labeled datasets, especially in regulated industries, restricts the development of high-performing AI solutions. Issues such as data silos and a lack of real-time data availability also hinder scalability and operational efficiency. Consequently, enterprises must invest significantly in data governance, cleaning, and infrastructure before fully realizing AI’s potential.
Enterprise AI Market Size and Forecast:
| Report Attribute | Details |
|---|---|
|
Base Year |
2025 |
|
Forecast Period |
2026-2035 |
|
CAGR |
34.20% |
|
Base Year Market Size (2025) |
USD 30.18 billion |
|
Forecast Year Market Size (2035) |
USD 570.36 billion |
|
Regional Scope |
|
Enterprise AI Market Segmentation:
Component Segment Analysis
The software and platform segment is expected to hold 49% of the enterprise AI market share by 2035, driven by its central role in enabling organizations to efficiently deploy, scale, and integrate AI capabilities across diverse business functions. AI software, ranging from pre-built applications to customizable platforms, simplifies the adoption process and enables firms to integrate AI into their operations, decision-making, and customer interactions. According to the Organization for Economic Co-operation and Development, Between 53% and 64% of enterprises depend on either customized AI solutions developed by third-party providers or commercially available off-the-shelf software and hardware, underscoring the strong reliance on external technologies to accelerate AI adoption while reducing in-house development complexity. These platforms also drive digital transformation by pushing firms to upgrade data infrastructure and internal capabilities as AI usage expands. Moreover, software solutions support a wide range of applications such as R&D, analytics, and automation, making them the most widely used AI components across industries. As enterprises increasingly adopt scalable, cloud-integrated AI software, this segment continues to lead overall enterprise AI market expansion.
Organization Size Segment Analysis
The large enterprises (≥1000 employees) segment is dominating the organization size segment and is expected to hold a share of 66.1% by 2035. The segment is a key force behind enterprise AI growth, driven by significant investments in organization-wide AI transformation, advanced data ecosystems, and scalable deployment platforms. These firms integrate AI across core functions such as finance, operations, supply chain, and customer experience to improve efficiency, agility, and decision-making. For instance, in September 2025, Databricks introduced its AI Accelerator Program to help large enterprises rapidly scale next-generation AI applications, upskill their workforce, and deploy enterprise-grade solutions. This reflects a broader trend among large organizations to prioritize scalable platforms, talent development, and end-to-end AI integration.
Technology Segment Analysis
The machine learning and foundation models segment is expected to dominate the enterprise AI market between 2026 and 2035, fueled by the rapid adoption of large language models (LLMs), multimodal systems, and domain-specific foundation models. These technologies enable advanced capabilities such as content generation, process automation, and complex decision support. Enterprises are increasingly leveraging pre-trained and fine-tuned models to accelerate deployment, reduce development time, and optimize costs. By building on existing model architectures, organizations can focus more on application-level innovation rather than foundational development. For instance, in January 2026, IBM partnered with e& to launch agentic AI solutions powered by advanced machine learning and foundation models. These solutions are designed to automate governance, compliance, and regulatory workflows, underscoring the expanding role of LLMs and domain-specific models in driving intelligent automation and scalable enterprise AI adoption.
Our in-depth analysis of the enterprise AI market includes the following segments:
|
Segments |
Subsegments |
|
Component |
|
|
Organization Size |
|
|
Functional Area |
|
|
Technology |
|
|
Deployment Model |
|
|
End use Industry |
|

Vishnu Nair
Head - Global Business DevelopmentCustomize this report to your requirements — connect with our consultant for personalized insights and options.
Enterprise AI Market - Regional Analysis
North America Market Insights
The enterprise AI market in North America is expected to hold a share of 37% by 2035, driven by strong innovation ecosystems, widespread digital transformation, and the presence of leading technology companies. Businesses across industries are increasingly embedding AI into their operations to improve efficiency, enhance customer experiences, and gain competitive advantages. The region benefits from advanced infrastructure, a mature cloud ecosystem, and a highly skilled workforce, which together accelerate adoption. Government initiatives supporting AI research and ethical frameworks also contribute to a favorable environment for growth. With continuous investment in AI platforms, software, and hardware, North America remains the global hub for enterprise AI innovation and expansion.
In the U.S., the enterprise AI market is expanding rapidly due to strong adoption across industries, large-scale investments, and government-backed initiatives. The U.S. Census Bureau reports that AI adoption among businesses rose from 3.7% in 2022 to 6.6% in 2023, with larger firms exceeding 15% adoption. Federal Reserve data highlights that leading technology companies invested over USD 400 billion in AI-related capital expenditures in 2025, underscoring the scale of commitment. This growth is reinforced by the expansion of AI labs and chipmakers, with Nvidia’s market capitalization increasing nearly 975% between 2022 and 2025. Together, these factors position the U.S. as the global leader in enterprise AI innovation and enterprise AI market growth.
In Canada, the enterprise AI market is also growing steadily, supported by government initiatives and strong research ecosystems. According to Statistics Canada, AI adoption among Canadian businesses increased from 3% in 2019 to 7% in 2023, with higher uptake among larger firms and knowledge-based industries. The Canadian government has invested heavily in AI research through the Pan-Canadian AI Strategy, allocating USD 443 million in 2021 to strengthen AI talent and commercialization. Canada’s AI hubs in Toronto, Montreal, and Edmonton are recognized globally, fostering collaboration between academia and industry. This combination of policy support, research excellence, and business adoption is driving Canada’s enterprise AI market forward, making it a key player in North America’s AI ecosystem.
Asia Pacific Market Insights
The enterprise AI market in Asia Pacific is expanding rapidly, driven by strong digital transformation efforts and widespread adoption of cloud technologies. Businesses across industries are using AI to automate processes, improve customer experiences, and scale operations efficiently. Governments in countries like India, China, and Japan are actively supporting AI innovation through policies and infrastructure investments. Overall, the region is characterized by fast adoption, experimentation, and large-scale deployments.
China enterprise AI market is expanding rapidly, driven by strong government support and widespread digital transformation across industries. Enterprises in manufacturing, finance, logistics, retail, and e-commerce are increasingly adopting AI for automation, predictive analytics, and operational efficiency. According to Chinese state-backed reports, enterprise adoption of generative AI accelerated significantly after 2021, with many firms integrating AI into customer service, intelligent manufacturing, and decision-making systems. National initiatives focused on smart infrastructure and industrial modernization are also encouraging businesses to scale AI implementation across operations. Overall, China is emerging as a global leader in enterprise AI through sustained investment in AI innovation, cloud infrastructure, and large-scale enterprise deployment.
India enterprise AI landscape is expanding quickly, with adoption now moving beyond pilots into core business operations. According to IndiaAI, about 59% of large enterprises in India have already deployed AI, placing the country among global leaders in adoption. Government-backed insights also suggest nearly 87% of firms are in mid-to-advanced stages of AI maturity, indicating deeper integration across functions. Studies from NASSCOM highlight that a growing share of organizations now run multiple AI use cases in production, reflecting a shift toward scaled implementation. Additionally, policy support through initiatives like the National AI Strategy is accelerating enterprise adoption. Overall, India’s enterprise AI growth is being driven by strong digital infrastructure, a large talent pool, and increasing enterprise willingness to embed AI into decision-making.
Europe Market Insights
Europe enterprise AI market is growing steadily, shaped by a strong focus on regulation, data privacy, and ethical AI use. Enterprises are integrating AI into sectors such as manufacturing, finance, and healthcare to enhance productivity and decision-making. The presence of clear regulatory frameworks encourages responsible innovation but can slow rapid deployment compared to other regions. As a result, growth in Europe is more structured and compliance-driven while still maintaining strong momentum.
The enterprise AI market in the UK is growing steadily as businesses increasingly integrate AI into operations, customer service, and productivity tools. According to the UK government’s Department for Science, Innovation and Technology, around 1 in 6 UK businesses (16%) already use at least one AI technology, while adoption among large enterprises has reached 36%. The UK’s AI sector also recorded strong expansion in 2024, with the number of AI firms increasing by 58% year-over-year and AI-related employment rising by 33%. AI adoption is especially high in finance, IT, and business services, where companies are scaling generative AI and automation initiatives. Government-backed programs and investments in digital innovation are further accelerating enterprise AI deployment across industries.
In Germany, enterprise AI adoption has accelerated significantly since 2021, especially across manufacturing, automotive, logistics, and industrial sectors. According to KfW, around 20% of German SMEs used AI between 2022 and 2024, compared with only 4% before 2018, showing strong recent momentum. The study also found that 36% of companies with more than 50 employees now deploy AI, reflecting growing enterprise-scale implementation. Research from the ifo Institute reported that 13.3% of German companies were actively using AI in 2023, while many others were planning adoption or evaluating use cases. German enterprises are increasingly using AI for predictive maintenance, intelligent automation, and data-driven operations while aligning with EU regulations such as GDPR and the AI Act. Overall, Germany is strengthening its position as a leading European enterprise AI hub through industrial innovation, digital transformation, and sustained investment in AI technologies.
Key Enterprise AI Market Players:
- Amazon Web Services, Inc. (U.S.)
- Baidu, Inc. (China)
- C3.ai, Inc. (U.S.)
- Databricks (U.S.)
- Google LLC (Alphabet Inc.) (U.S.)
- International Business Machines Corporation (U.S.)
- Infosys Limited (India)
- Microsoft Corporation (U.S.)
- NVIDIA Corporation (U.S.)
- Oracle Corporation (U.S.)
- Salesforce, Inc. (U.S.)
- Samsung SDS Co., Ltd. (South Korea)
- SAP SE (Germany)
- ServiceNow, Inc. (U.S.)
- UiPath (U.S.)
- Company Overview
- Business Strategy
- Key Product Offerings
- Financial Performance
- Key Performance Indicators
- Risk Analysis
- Recent Development
- Regional Presence
- SWOT Analysis
- Microsoft is a leading player in the global enterprise AI market, driven by its strong cloud ecosystem and generative AI capabilities. Through Azure AI and Copilot solutions, the company enables enterprises to automate workflows, improve productivity, and enhance decision-making. Its strategic partnership with OpenAI has strengthened its position in enterprise generative AI adoption across industries. Microsoft continues to expand AI integration across business applications, cybersecurity, and analytics platforms.
- Amazon Web Services (AWS) is driving enterprise AI market adoption through scalable cloud-based AI and machine learning services. The company offers tools for data analytics, generative AI, and model development that help enterprises accelerate digital transformation. AWS focuses heavily on industry-specific AI solutions across healthcare, finance, retail, and manufacturing sectors. Its continuous investments in AI infrastructure and partnerships support global enterprise AI expansion.
- Google is strengthening its enterprise AI market presence through Google Cloud AI, generative AI tools, and advanced data analytics capabilities. The company provides AI-driven solutions for automation, customer engagement, and intelligent decision-making across enterprises. Its Gemini AI models and cloud infrastructure are helping businesses deploy scalable AI applications efficiently. Google also emphasizes responsible AI development and secure enterprise AI implementation.
- IBM remains a major enterprise AI market provider through its Watson AI platform and hybrid cloud strategy. The company focuses on AI solutions for automation, predictive analytics, and enterprise data management, particularly in regulated industries such as banking and healthcare. IBM also promotes trustworthy and explainable AI to support enterprise governance and compliance requirements. Its consulting and AI integration services continue to strengthen enterprise adoption globally.
- SAP SE is expanding its enterprise AI market footprint by embedding AI capabilities into enterprise resource planning (ERP) and business management software. The company helps organizations improve operational efficiency, automate business processes, and gain real-time insights through AI-powered analytics. SAP’s focus on industry-specific AI applications supports adoption across manufacturing, supply chain, and finance sectors. Its partnerships and cloud-based AI innovations are further driving enterprise digital transformation.
Below is the list of the key players operating in the global enterprise AI market:
Key players in the enterprise AI market are driving growth through continuous investments in generative AI, cloud-based AI platforms, automation, and advanced analytics solutions. Companies such as Amazon Web Services, Microsoft, Google, IBM, and NVIDIA are expanding AI capabilities by integrating machine learning and AI-powered tools into enterprise software and cloud ecosystems. Firms like SAP, Salesforce, ServiceNow, and UiPath are helping businesses automate workflows, improve customer experiences, and enhance operational efficiency across industries. Additionally, strategic partnerships, AI-focused acquisitions, and rising investments in responsible AI and cybersecurity are accelerating enterprise adoption and global enterprise AI market expansion.
Corporate Landscape of the Global Enterprise AI Market:
Recent Developments
- In February 2026, Microsoft Corporation launched the AI QuickStart program, an initiative designed to help digitally mature organizations, including SMEs and large enterprises, accelerate the deployment of practical and enterprise-ready AI solutions. Supported by Infocomm Media Development Authority and United Overseas Bank (UOB), the program focuses on driving AI adoption across key business functions, including knowledge mining, customer engagement, operations automation, content creation, and conversational analytics. The initiative aims to enable enterprises to integrate AI more efficiently into day-to-day operations while enhancing productivity, decision-making, and customer experience.
- In January 2026, ServiceNow, the AI control tower for business reinvention, announced an expanded strategic collaboration with OpenAI to accelerate agentic AI experiences and enterprise transformation. The partnership brings together OpenAI technical advisors and ServiceNow engineers to leverage frontier models, enabling customers to access advanced AI capabilities and deploy customized ServiceNow AI solutions aligned with their specific roadmaps, without the need for bespoke development. As part of this collaboration, ServiceNow will build direct speech-to-speech capabilities powered by OpenAI models to enable more natural interactions and overcome language barriers. By integrating the latest OpenAI models, including GPT-5.2, the initiative aims to unlock a new class of AI-driven automation for large enterprises, improving speed, scalability, and overall business outcomes.
- Report ID: 8096
- Published Date: May 27, 2026
- Report Format: PDF, PPT
- Explore a preview of key market trends and insights
- Review sample data tables and segment breakdowns
- Experience the quality of our visual data representations
- Evaluate our report structure and research methodology
- Get a glimpse of competitive landscape analysis
- Understand how regional forecasts are presented
- Assess the depth of company profiling and benchmarking
- Preview how actionable insights can support your strategy
Explore real data and analysis
Frequently Asked Questions (FAQ)
Enterprise AI Market Report Scope
Free Sample includes current and historical market size, growth trends, regional charts & tables, company profiles, segment-wise forecasts, and more.
Connect with our Expert


Copyright @ 2026 Research Nester. All Rights Reserved.
