Direct Reduced Iron Market Size & Share by Forms (Pellets, Lumps); Production Process (Gas Based, Coal Based); Application (Steel Making, Construction) - Global Supply & Demand Analysis, Growth Forecasts, Statistics Report 2024-2036

  • Report ID: 4416
  • Published Date: Dec 08, 2023
  • Report Format: PDF, PPT

Direct Reduced Iron Market TOC

  1. An Outline of the Global Direct Reduced Iron Market
    1. Market Definition
    2. Market Segmentation
    3. Industry Overview
  2. Assumptions & Abbreviations
  3. Research Methodology & Approach
    1. Research Process
    2. Primary Research
      1. Manufacturers
      2. Suppliers/ Distributors
      3. End Users
    3. Secondary Research
    4. Market Size Estimation
  4. Summary of the Report for Key Decision Makers
  5. Forces of Market Constituents
    1. Factors/drivers impacting the growth of the market
    2. Market trends for better business practices
  6. Key Market Opportunities for Business Growth
    1. Based on the form
    2. Based on the production process
    3. Based on the application
    4. Based on the geographical presence
  7. Major Roadblocks for the Market Growth
  8. Decarbonization Strategy and Carbon Credit Benefits for Market Players
    1. Global Government Decarbonization Plans/Goals by Each Country under 2015 Agreement Agreed by 200 Countries
    2. Measures taken by Countries to Reduce Carbon Footprints
    3. Carbon Credits and Subsidy Plans/Benefits Rolled out by the Government for Market Players
    4. Effective Ways to Harness Carbon-Credits and Impact on Profit Margins
    5. Demand Impact on the Companies Opting for Carbon Credits
  9. Government Regulation: How they would aid business?
  10. Industry Risk Analysis
  11. Global Economic Outlook: Challenges for Global Recovery and its Impact on Global Direct Reduced Iron Market
    1. Ukraine-Russia crisis
    2. Potential US economic slowdown
    3. Impact of Recession on the Global economy
  12. Industry Supply Chain Analysis
  13. Patent Analysis
  14. Comparative feature analysis
  15. EXIM Analysis of Ferrous Products Obtained by Direct Reduction of Iron Ore
  16. Analysis on Technology used in DRI Production
  17. Analysis on the Type of Refractory
    1. Acidic
    2. Basic
    3. Neutral
  18. Types and Characteristics of Raw Materials used in Refractory Manufacture
  19. Analysis of the Refractories Used in Various Industries
  20. Recent Trend of using DRI Shaft furnaces in Combination with EAF Furnaces for Steel Production
    1. Expansion of ironmaking process using iron scrap
    2. Others
  21. SWOT Analysis
  22. PEST Analysis
  23. Porter Five Forces Analysis
  24. Analysis of Details of Direct Reduction of Iron Plants
  25. Competitive Positioning: Strategies to differentiate a company from its competitors
    1. Gallantt Group of Industries
    2. Nucor Corporation
    3. Jindal Shadeed Iron & Steel
    4. Tosyali Algerie
    5. Suez Steel Co.
    6. JFE Steel Corporation
    7. Tata Steel
    8. JSW Group
    9. SABIC
    10. Welspun Group
  26. Competitive Model: A Detailed Inside View for Investors
    1. Market share of major companies profiled, 2023
    2. Business Profiles of Key Enterprises
      1. Detailed overview
      2. Assessment of key offering
      3. Analysis of growth strategies
      4. Exhaustive analysis on key financial indicators
      5. Recent developments and strategies
    3. Gallantt Group of Industries
    4. Nucor Corporation
    5. Jindal Shadeed Iron & Steel
    6. Tosyali Algerie
    7. Suez Steel Co.
    8. JFE Steel Corporation
    9. Tata Steel
    10. JSW Group
    11. SABIC
    12. Welspun Group
  27. Global Direct Reduced Iron Market Outlook & Projections, Opportunity Assessment, 2023 to 2036
    1. Market Overview
    2. Market Revenue by Value (USD Million) and Compound Annual Growth Rate (CAGR)
    3. Market Revenue by Volume (Million Tons)
    4. Year-on-Year (Y-o-Y) Growth Trend Analysis
  28. Global Direct Reduced Iron Market Outlook & Projections, Opportunity Assessment by Form, 2023-2036
    1. Pellet, Market Value (USD Million) & Volume (Million Tons), CAGR & Y-o-Y Growth Trend, 2023-2036F
    2. Lumps, Market Value (USD Million) & Volume (Million Tons), CAGR & Y-o-Y Growth Trend, 2023-2036F
    3. Others, Market Value (USD Million) & Volume (Million Tons), CAGR & Y-o-Y Growth Trend, 2023-2036F
  29. Global Direct Reduced Iron Market Outlook & Projections, Opportunity Assessment by Production Process, 2023-2036
    1. Gas-based, Market Value (USD Million), CAGR & Y-o-Y Growth Trend, 2023-2036F
    2. Coal-based, Market Value (USD Million), CAGR & Y-o-Y Growth Trend, 2023-2036F
  30. Global Direct Reduced Iron Market Outlook & Projections, Opportunity Assessment by Application, 2023-2036
    1. Steel Making, Market Value (USD Million), CAGR & Y-o-Y Growth Trend, 2023-2036F
    2. Construction, Market Value (USD Million), CAGR & Y-o-Y Growth Trend, 2023-2036F
  31. Market Overview
    1. Market Revenue by Value (USD Million), Volume (Million Tons), and Compound Annual Growth Rate (CAGR)
    2. Year-on-Year (Y-o-Y) Growth Comparative Analysis
      1. North America
      2. Europe
      3. Asia Pacific
      4. Latin America
      5. Middle East and Africa
    3. Cross Analysis of Form w.r.t. Application (USD Million), 2023-2036
  32. North America Direct Reduced Iron Market Demand Outlook & Projections, 2023 to 2036: A Comprehensive Study for Stakeholders
    1. Market Overview
    2. Analysis on Govt. Guidelines, Technology in the region & Impact on Y-O-Y Revenue
    3. Market Revenue by Value (USD Million) and Compound Annual Growth Rate (CAGR)
    4. Market Revenue by Volume (Million Tons)
    5. Year-on-Year (Y-o-Y) Growth Trend Analysis
  33. North America Direct Reduced Iron Market Outlook & Projections, Opportunity Assessment by Form, 2023-2036
    1. Pellets, Market Value (USD Million) & Volume (Million Tons), CAGR & Y-o-Y Growth Trend, 2023-2036F
    2. Lumps, Market Value (USD Million) & Volume (Million Tons), CAGR & Y-o-Y Growth Trend, 2023-2036F
    3. Others, Market Value (USD Million) & Volume (Million Tons), CAGR & Y-o-Y Growth Trend, 2023-2036F
  34. North America Direct Reduced Iron Market Outlook & Projections, Opportunity Assessment by Production Process, 2023-2036
    1. Gas-based, Market Value (USD Million), CAGR & Y-o-Y Growth Trend, 2023-2036F
    2. Coal-based, Market Value (USD Million), CAGR & Y-o-Y Growth Trend, 2023-2036F
  35. North America Direct Reduced Iron Market Outlook & Projections, Opportunity Assessment by Application, 2023-2036
    1. Steel Making, Market Value (USD Million), CAGR & Y-o-Y Growth Trend, 2023-2036F
    2. Construction, Market Value (USD Million), CAGR & Y-o-Y Growth Trend, 2023-2036F
  36. North America Direct Reduced Iron Market Outlook & Projections, Opportunity Assessment by Country, 2023-2036
    1. United States, Market Value (USD Million), Volume (Million Tons), CAGR & Y-o-Y Growth Trend, 2023- 2033F
    2. Canada, Market Value (USD Million), Volume (Million Tons) CAGR & Y-o-Y Growth Trend, 2023- 2033F
  37. Europe Direct Reduced Iron Market Demand Outlook & Projections, 2023 to 2036: A Comprehensive Study for Stakeholders
    1. Market Overview
    2. Analysis on Govt. Guidelines, Technology in the region & Impact on Y-O-Y Revenue
    3. Market Revenue by Value (USD Million) and Compound Annual Growth Rate (CAGR)
    4. Market Revenue by Volume (Million Tons)
    5. Year-on-Year (Y-o-Y) Growth Trend Analysis
  38. Europe Direct Reduced Iron Market Outlook & Projections, Opportunity Assessment by Form, 2023-2036
    1. Pellets, Market Value (USD Million) & Volume (Million Tons), CAGR & Y-o-Y Growth Trend, 2023-2036F
    2. Lumps, Market Value (USD Million) & Volume (Million Tons), CAGR & Y-o-Y Growth Trend, 2023-2036F
    3. Others, Market Value (USD Million) & Volume (Million Tons), CAGR & Y-o-Y Growth Trend, 2023-2036F
  39. Europe Direct Reduced Iron Market Outlook & Projections, Opportunity Assessment by Production Process, 2023-2036
    1. Gas-based, Market Value (USD Million), CAGR & Y-o-Y Growth Trend, 2023-2036F
    2. Coal-based, Market Value (USD Million), CAGR & Y-o-Y Growth Trend, 2023-2036F
  40. Europe Direct Reduced Iron Market Outlook & Projections, Opportunity Assessment by Application, 2023-2036
    1. Steel Making, Market Value (USD Million), CAGR & Y-o-Y Growth Trend, 2023-2036F
    2. Construction, Market Value (USD Million), CAGR & Y-o-Y Growth Trend, 2023-2036F
  41. Europe Direct Reduced Iron Market Outlook & Projections, Opportunity Assessment by Country, 2023-2036
    1. UK, Market Value (USD Million), Volume (Million Tons), CAGR & Y-o-Y Growth Trend, 2023- 2036F
    2. France, Market Value (USD Million), Volume (Million Tons), CAGR & Y-o-Y Growth Trend, 2023- 2036F
    3. Spain, Market Value (USD Million), Volume (Million Tons), CAGR & Y-o-Y Growth Trend, 2023- 2036F
    4. Italy, Market Value (USD Million), Volume (Million Tons), CAGR & Y-o-Y Growth Trend, 2023- 2036F
    5. Germany, Market Value (USD Million), Volume (Million Tons), CAGR & Y-o-Y Growth Trend, 2023- 2036F
    6. NORDIC, Market Value (USD Million), Volume (Million Tons), CAGR & Y-o-Y Growth Trend, 2023- 2036F
    7. Russia, Market Value (USD Million), Volume (Million Tons), CAGR & Y-o-Y Growth Trend, 2023- 2036F
    8. Rest of Europe, Market Value (USD Million), Volume (Million Tons), CAGR & Y-o-Y Growth Trend, 2023- 2036F
  42. Asia Pacific Direct Reduced Iron Market Demand Outlook & Projections, 2023 to 2036: A Comprehensive Study for Stakeholders
    1. Market Overview
    2. Analysis on Govt. Guidelines, Technology in the Region & Impact on Y-O-Y Revenue
    3. Market Revenue by Value (USD Million) and Compound Annual Growth Rate (CAGR)
    4. Market Revenue by Volume (Million Tons)
    5. Year-on-Year (Y-o-Y) Growth Trend Analysis
  43. Asia Pacific Direct Reduced Iron Market Outlook & Projections, Opportunity Assessment by Form, 2023-2036
    1. Pellets, Market Value (USD Million) & Volume (Million Tons), CAGR & Y-o-Y Growth Trend, 2023-2036F
    2. Lumps, Market Value (USD Million) & Volume (Million Tons), CAGR & Y-o-Y Growth Trend, 2023-2036F
    3. Others, Market Value (USD Million) & Volume (Million Tons), CAGR & Y-o-Y Growth Trend, 2023-2036F
  44. Asia Pacific Direct Reduced Iron Market Outlook & Projections, Opportunity Assessment by Production Process, 2023-2036
    1. Gas-based, Market Value (USD Million), CAGR & Y-o-Y Growth Trend, 2023-2036F
    2. Coal-based, Market Value (USD Million), CAGR & Y-o-Y Growth Trend, 2023-2036F
  45. Asia Pacific Direct Reduced Iron Market Outlook & Projections, Opportunity Assessment by Application, 2023-2036
    1. Steel Making, Market Value (USD Million), CAGR & Y-o-Y Growth Trend, 2023-2036F
    2. Construction, Market Value (USD Million), CAGR & Y-o-Y Growth Trend, 2023-2036F
  46. Asia Pacific Direct Reduced Iron Market Outlook & Projections, Opportunity Assessment by Country, 2023-2036
    1. China, Market Value (USD Million), Volume (Million Tons), CAGR & Y-o-Y Growth Trend, 2023-2036F
    2. India, Market Value (USD Million), Volume (Million Tons), CAGR & Y-o-Y Growth Trend, 2023-2036F
    3. Singapore, Market Value (USD Million), Volume (Million Tons), CAGR & Y-o-Y Growth Trend, 2023-2036F
    4. Japan, Market Value (USD Million), Volume (Million Tons), CAGR & Y-o-Y Growth Trend, 2023-2036F
    5. South Korea, Market Value (USD Million), Volume (Million Tons), CAGR & Y-o-Y Growth Trend, 2023-2036F
    6. Australia, Market Value (USD Million), Volume (Million Tons), CAGR & Y-o-Y Growth Trend, 2023-2036F
    7. Malaysia, Market Value (USD Million), Volume (Million Tons), CAGR & Y-o-Y Growth Trend, 2023-2036F
    8. Thailand, Market Value (USD Million), Volume (Million Tons), CAGR & Y-o-Y Growth Trend, 2023-2036F
    9. Vietnam, Market Value (USD Million), Volume (Million Tons), CAGR & Y-o-Y Growth Trend, 2023-2036F
    10. Rest of Asia Pacific, Market Value (USD Million), Volume (Million Tons), CAGR & Y-o-Y Growth Trend, 2023-2036F
  47. Latin America Direct Reduced Iron Market Demand Outlook & Projections, 2023 to 2036: A Comprehensive Study for Stakeholders
    1. Market Overview
    2. Analysis on Govt. Guidelines, Technology in the region & Impact on Y-O-Y Revenue
    3. Market Revenue by Value (USD Million) and Compound Annual Growth Rate (CAGR)
    4. Market Revenue by Volume (Million Tons)
    5. Year-on-Year (Y-o-Y) Growth Trend Analysis
  48. Latin America Direct Reduced Iron Market Outlook & Projections, Opportunity Assessment by Form, 2023-2036
    1. Pellets, Market Value (USD Million) & Volume (Million Tons), CAGR & Y-o-Y Growth Trend, 2023-2036F
    2. Lumps, Market Value (USD Million) & Volume (Million Tons), CAGR & Y-o-Y Growth Trend, 2023-2036F
    3. Others, Market Value (USD Million) & Volume (Million Tons), CAGR & Y-o-Y Growth Trend, 2023-2036F
  49. Latin America Direct Reduced Iron Market Outlook & Projections, Opportunity Assessment by Production Process, 2023-2036
    1. Gas-based, Market Value (USD Million), CAGR & Y-o-Y Growth Trend, 2023-2036F
    2. Coal-based, Market Value (USD Million), CAGR & Y-o-Y Growth Trend, 2023-2036F
  50. Latin America Direct Reduced Iron Market Outlook & Projections, Opportunity Assessment by Application, 2023-2036
    1. Steel Making, Market Value (USD Million), CAGR & Y-o-Y Growth Trend, 2023-2036F
    2. Construction, Market Value (USD Million), CAGR & Y-o-Y Growth Trend, 2023-2036F
  51. Latin America Direct Reduced Iron Market Outlook & Projections, Opportunity Assessment by Country, 2023-2036
    1. Brazil, Market Value (USD Million), Volume (Million Tons), CAGR & Y-o-Y Growth Trend, 2023-2036F
    2. Mexico, Market Value (USD Million), Volume (Million Tons), CAGR & Y-o-Y Growth Trend, 2023-2036F
    3. Argentina, Market Value (USD Million), Volume (Million Tons), CAGR & Y-o-Y Growth Trend, 2023-2036F
    4. Rest of Latin America, Market Value (USD Million), Volume (Million Tons), CAGR & Y-o-Y Growth Trend, 2023-2036
  52. Middle East & Africa Direct Reduced Iron Market Demand Outlook & Projections, 2023 to 2036: A Comprehensive Study for Stakeholders
    1. Market Overview
    2. Analysis on Govt. Guidelines, Technology in the region & Impact on Y-O-Y Revenue
    3. Market Revenue by Value (USD Million) and Compound Annual Growth Rate (CAGR)
    4. Market Revenue by Volume (Million Tons)
    5. Year-on-Year (Y-o-Y) Growth Trend Analysis
  53. Middle East and Arica Direct Reduced Iron Market Outlook & Projections, Opportunity Assessment by Form, 2023-2036
    1. Pellets, Market Value (USD Million) & Volume (Million Tons), CAGR & Y-o-Y Growth Trend, 2023-2036F
    2. Lumps, Market Value (USD Million) & Volume (Million Tons), CAGR & Y-o-Y Growth Trend, 2023-2036F
    3. Others, Market Value (USD Million) & Volume (Million Tons), CAGR & Y-o-Y Growth Trend, 2023-2036F
  54. Middle East and Arica Direct Reduced Iron Market Outlook & Projections, Opportunity Assessment by Production Process, 2023-2036
    1. Gas-based, Market Value (USD Million), CAGR & Y-o-Y Growth Trend, 2023-2036F
    2. Coal-based, Market Value (USD Million), CAGR & Y-o-Y Growth Trend, 2023-2036F
  55. Middle East and Arica Direct Reduced Iron Market Outlook & Projections, Opportunity Assessment by Application, 2023-2036
    1. Steel Making, Market Value (USD Million), CAGR & Y-o-Y Growth Trend, 2023-2036F
    2. Construction, Market Value (USD Million), CAGR & Y-o-Y Growth Trend, 2023-2036F
  56. Middle East & Africa Direct Reduced Iron Market Outlook & Projections, Opportunity Assessment by Country, 2023-2036
    1. GCC, Market Value (USD Million), Volume (Million Tons), CAGR & Y-o-Y Growth Trend, 2023-2036F
    2. Israel, Market Value (USD Million), Volume (Million Tons), CAGR & Y-o-Y Growth Trend, 2023-2036F
    3. South Africa, Market Value (USD Million), Volume (Million Tons), CAGR & Y-o-Y Growth Trend, 2023-2036F
    4. Rest of the Middle East and Africa, Market Value (USD Million), Volume (Million Tons), CAGR & Y-o-Y Growth Trend, 2023-2036F


Global Market Size, Forecast, and Trend Highlights Over 2024-2036

Direct Reduced Iron Market size is anticipated to reach USD 131.32 billion by the end of 2036, growing at a CAGR of 9.26% during the forecast period i.e., 2024-2036. In the year 2023, the industry size of direct reduced iron was over USD 41.73 billion. 
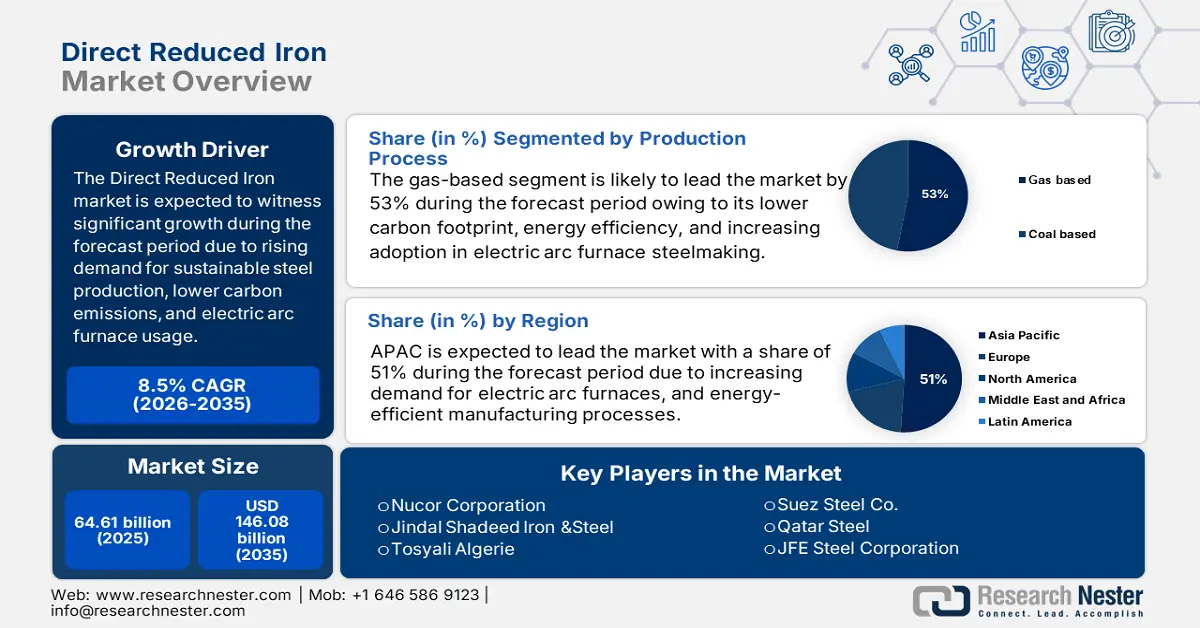
Globally steel industry is the biggest contributor to greenhouse gas emissions in the atmosphere. Generally, iron is produced with the help of a blast furnace route which is one reason behind high carbon emissions. However, the directly reduced iron does not produce a high amount of greenhouse gases, particularly carbon dioxide. It enables more environment-friendly approaches to be adopted by steel producers, which reduces their carbon footprint and mitigates climate change. The growing demand for direct reduced iron as a primary raw material for steel production due to its low carbon emissions compared with traditional Iron Production Process is an important factor driving the development of the direct reduced iron market driven by increasing focus on energy efficiency and reducing greenhouse gas emissions in the steel industry. Thus, growing steel production is predicted to drive the growth of the market in the forecast period. According to the World Steel Association, global crude steel production stood at 1,950.5 million tons in 2021 and is expected to grow by 3.7% compared with 1,880.4 million tons in 2020.    

Steel is a principal raw material for products and projects in many sectors, including construction, the automobile sector as well as industry. The growth of infrastructure, urbanization, automotive manufacturing and industrial production is having a positive impact on steel demand. In view of continued increases in steel consumption, there is a corresponding need for iron production, which constitutes an essential part of the manufacture of steel.


Direct Reduced Iron Market
Get more information on this report: Request Free Sample PDF

Direct Reduced Iron Sector: Growth Drivers and Challenges

Growth Drivers

  • Growing Integration of Gas Based Direct Reduction Technologies Instead of Coal Based Methods - The gas-based technologies aid in reducing carbon footprints in steel-making procedures. These methods reduce or eliminate reliance on coal and coke, both of which are major carbon emitters, through the use of natural gas or hydrogen as a reducing agent. The adoption of gas-fueled direct reaction technologies is an effective means for reducing carbon emissions and promoting sustainability in the steel sector, given that firms are seeking to achieve carbon neutrality as well as comply with more stringent environmental regulations. Direct reduction using natural gas is a proven method that has been in use for many years. In 2019, its production rate was close to 82 million tons.
  • Integration of Industry 4.0 Technologies - Efficiency enhancement and advanced process optimization are enabled with the integration of Industry 4.0 in DRI production. Automation and robotics have the potential to replace significant procedures such as mixing, material handling, feeding, and discharge operations. Operational efficiency can be substantially improved through the automation of redundant tasks and reductions in human intervention. In order to determine trends, patterns, and anomalies that optimize the parameters in the production process, reduce waste as well and improve total productivity, AI-powered algorithms may also analyze manufacturing data from an instant point of view.

Challenges

  • High Initial Status and Operational Costs - Significant capital investment is required for the establishment of a DRI plant. Complicated engineering, procurement, and construction processes including the installation of technology like Direct Reduced Reactors, Gas Reforming Systems, or Gas Turbines are required to build a DRI plant. There may be considerable costs associated with building and commissioning a power station, as well as the necessary infrastructure. Apart from the capital investments, there may also be substantial operational costs associated with DRI production. These are predicted to hamper the direct reduced iron market expansion in the projected period.
  • Fluctuation in Raw Material Prices Especially in Natural Gas - There are generally long-term planning and development phases in DRI projects. Anyhow, the possibility of these projects depends on their price assumptions and current market conditions. Such calculations are subject to uncertainty as a result of volatility in gas prices. It can lead to unfavorable financial results that render the DRI project economically unviable if prices are higher than projections made at the initial evaluation stage. This could harm the growth of the globally distributed renewable energy market, by making potential investors and companies hesitate to invest in such power plants.
  • Impact of the COVID-19 pandemic is set to hamper the market growth in the estimated period.

Direct Reduced Iron Market: Key Insights

Base Year

2023

Forecast Year

2024 - 2036

CAGR

9.26%

Base Year Market Size (2023)

USD 41.73 Billion

Forecast Year Market Size (2036)

USD 131.32 Billion

Regional Scope

  • North America (U.S., and Canada) 
  • Latin America (Mexico, Argentina, Rest of Latin America) 
  • Asia-Pacific (Japan, China, India, Indonesia, Malaysia, Australia, Rest of Asia-Pacific) 
  • Europe (U.K., Germany, France, Italy, Spain, Russia, NORDIC, Rest of Europe) 
  • Middle East and Africa (Israel, GCC North Africa, South Africa, Rest of the Middle East and Africa) 
Get more information on this report: Request Free Sample PDF

Direct Reduced Iron Segmentation

Forms (Pellets, Lumps)

In terms of form segmentation, the pellets segment in the direct reduced iron market is predicted to hold the largest revenue share of USD 61.68 billion up from USD 19.74 in 2023. The direct reduced iron pellets are made up of run-of-mine iron ores. In addition, iron ore pellets can provide several advantages, such as the common size and composition of iron ore pallets that help to ensure that there will be consistent feedstocks in the DRI process. With the consistency of these iron balls, it is thus easier to achieve a safe and controlled reduction process. The iron ore pellets have a high iron content of around 70%, which allows them to be more efficient in reducing and results in increased dried mineralization yields.

Production Process (Gas Based, Coal Based)

Direct reduced iron market size from the gas based segment is expected to surpass more than USD 70.57 billion by the end of 2036 up from USD 21.51 billion in the year 2023. Gas-based production is essentially a reverse current process in which hot and highly reducing gases are used to make lump iron ore or pellets into metallic iron. Compared to other processes, gas-based production is relatively efficient in terms of benefits provided by the Gas Production Process. The way this is done makes it possible to control the reduction process as precisely as other iron-making processes, resulting in lower energy consumption. Furthermore, owing high adoption of natural gas and considering environmental concerns the growth of this segment is predicted to grow in the projected period. The world's consumption of natural gas amounted to approximately 3,84 trillion cubic meters in 2022.

Our in-depth analysis of the global market includes the following segments: 

          Forms

  • Pellets
  • Lumps

          Production Process

  • Gas Based
  • Coal Based

          Application

  • Steel Making
  •  Construction

Want to customize this research report as per your requirements? Our research team will cover the information you require to help you take effective business decisions.

Customize this Report

Direct Reduced Iron Industry - Regional Synopsis

APAC Market Forecasts

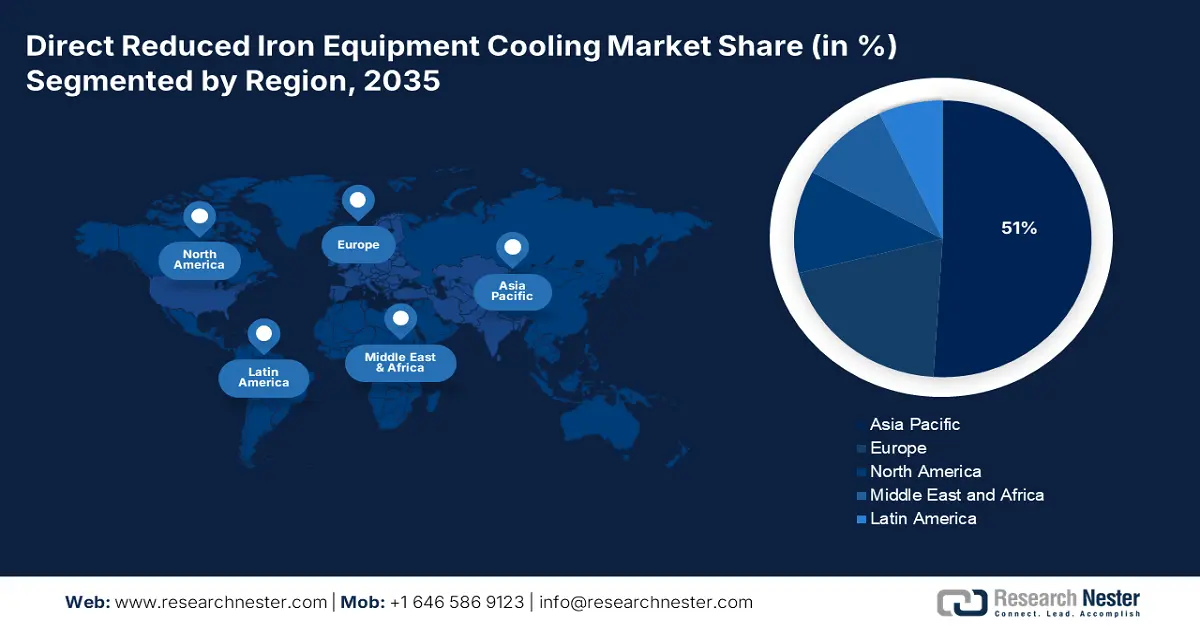
The Asia Pacific direct reduced iron market is predicted to hold the largest revenue share of USD 66.27 billion by the end of 2036. The Asia-Pacific region is a major hub for steel production, with countries such as China, India, and Japan leading the way. As steel demand continues to increase in sectors such as construction, automotive, and infrastructure development, a stable and cost-effective supply of steel is required. DRI provides a reliable and efficient alternative to traditional steelmaking methods. Its use in steel production will help meet the growing demand for steel in the region, thereby driving the growth of the DRI market. Rapid infrastructure development, growing investment in development, and urbanization in countries such as China and India are driving demand for steel in the Asia-Pacific region. Welspun announced plans to invest about USD 5 billion in Telangana over the next five years, across segments such as IT and ITES clusters and logistic parks, in September 2023. Welspun World Chairman B.K. Goenka said that it would create around 50,000 jobs, including 20,000 direct and 30,000 indirect ones.

European Market Statistics

The direct reduced iron market in the Europe region is expected to grow substantially by the end of 2036. In the production process, operational efficiency and energy consumption have been greatly improved due to the development of advanced DRI technologies in the region. The modern generation of distributed renewable energy plants offers enhanced energy recovery systems and optimized process parameters that lead to a reduced power requirement for each tonne of DRI produced. Given the increased energy costs and environmental concerns, energy efficiency is an essential factor for Europe's steel producers.

Research Nester
Direct Reduced Iron Market Size
Get more information on this report: Request Free Sample PDF

Companies Dominating the Direct Reduced Iron Landscape

top-features-companies
    • Gallantt Group of Industries
      • Company Overview 
      • Business Strategy 
      • Key Product Offerings 
      • Financial Performance 
      • Key Performance Indicators 
      • Risk Analysis 
      • Recent Development 
      • Regional Presence 
      • SWOT Analysis 
    • Nucor Corporation
    • Jindal Shadeed Iron & Steel
    • Tosyali Algerie
    • Suez Steel Co.
    • Qatar Steel
    • JFE Steel Corporation
    • Tata Steel
    • JSW Group
    • ArcelorMittal
    • SABIC
    • Welspun Group

In the News

  • IBM and JFE Steel have entered into a partnership in September 2023 with the aim of providing JAVA's mAIster and fault recovery systems, supported by IBM Watson AL. It was initially designed for the application of JFE steel itself in domestic and international markets but has now been extended to include such applications.
  • By buying the majority of Voestalpine's shares in Texas, ArcelorMittal made a deal to acquire Voestalpine in 2022. Acquiring the HBI facilities is an essential component of this acquisition. It's the kind of iron that is directly reduced.

Author Credits:  Rajrani Baghel


  • Report ID: 4416
  • Published Date: Dec 08, 2023
  • Report Format: PDF, PPT

Frequently Asked Questions (FAQ)

The major factors driving the growth of the market are surge in demand for eco-friendly products that emit less greenhouse gases, growing integration of Industry 4.0 and integration of gas based direct technologies.

The market size of enhanced geothermal systems is anticipated to attain a CAGR of 9.26% over the forecast period, i.e., 2023-2035.

The major players in the market are Suez Steel Co., Qatar Steel, JFE Steel Corporation, Tata Steel, JSW Group, ArcelorMittal, SABIC, Welspun Group., and others.

The pellets segment is anticipated to garner the largest market size by the end of 2035 and display significant growth opportunities.

The market in the Asia Pacific region is projected to hold the largest market share by the end of 2035 and provide more business opportunities in the future.
Direct Reduced Iron Market Report Scope
logo
  GET A FREE SAMPLE

FREE Sample Copy includes market overview, growth trends, statistical charts & tables, forecast estimates, and much more.

 Request Free Sample Copy

Have questions before ordering this report?

Inquiry Before Buying