D-lactic Acid Market Outlook:
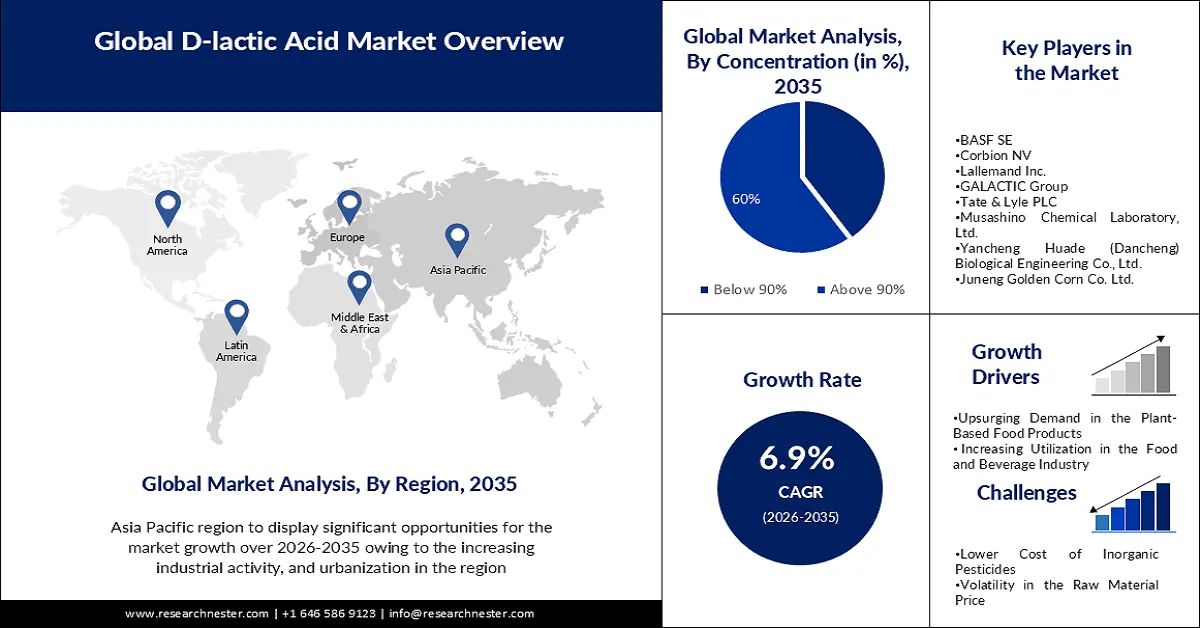
D-lactic Acid Market size was over USD 299.02 million in 2025 and is anticipated to cross USD 582.74 million by 2035, witnessing more than 6.9% CAGR during the forecast period i.e., between 2026-2035. In the year 2026, the industry size of D-lactic acid is estimated at USD 317.59 million.
The growth of the market can be attributed to the globally increasing utilization of agrochemicals and the rising demand for D-lactic acid in the manufacture of agricultural chemicals. For instance, the value of the worldwide agrochemical market, which was predicted to be around 234 billion dollars in 2019, is expected to surpass 300 billion dollars by 2025.
Further, the D-lactic acid market is anticipated to grow as farmers increase their reliance on specialty chemicals for higher production. According to the World Health Organization, more than a thousand different types of pesticides are used worldwide to keep pests from damaging or destroying crops. Furthermore, D-lactic acid is primarily utilized in the manufacture of PLA, a biodegradable thermoplastic manufactured from renewable sources like lactic acid produced through fermentation processes. The United States Food & Drug Administration has designated PLA as generally recognized as safe (GRAS), giving it a large market potential in the food business.
Key D-lactic Acid Market Insights Summary:
Regional Insights:
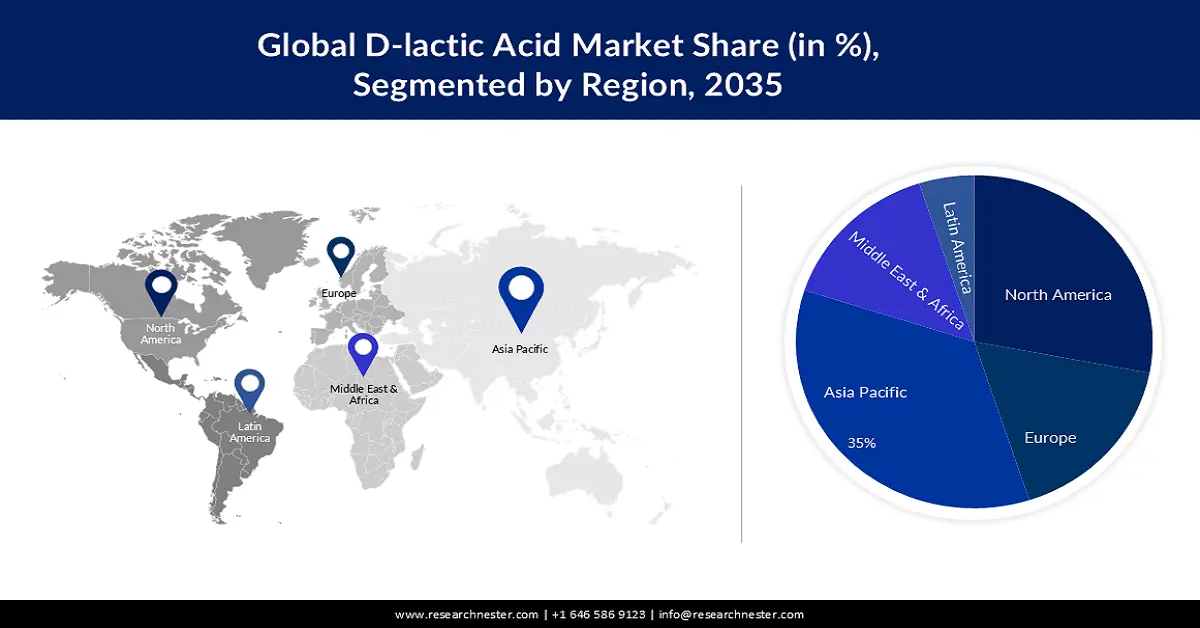
- Across 2026–2035, Asia Pacific is anticipated to secure a 35% revenue share in the d-lactic acid market, stimulated by its expanding middle-class population and rising adoption of bio-based, sustainable materials.
- North America is projected to capture a major share by 2035, underpinned by strong industrial utilization of D-lactic acid across pharmaceuticals and chemicals.
Segment Insights:
- By 2035, the above 90% segment in the d-lactic acid market is expected to hold a 60% share, propelled by escalating demand for high-purity D-lactic-acid-based biodegradable plastics.
- The pesticide segment is set to attain a prominent share by 2035, supported by the substantial economic efficiencies associated with pesticide application in agriculture.
Key Growth Trends:
- Upsurging Demand in Plant Based Food Products
- Increasing Utilization in the Food and Beverage Industry
Major Challenges:
- Lack of Availability of Raw Material
- Lower Cost of Inorganic Pesticides
Key Players: Isagro S.p.A, BASF SE, Corbion NV, Lallemand Inc., GALACTIC Group, Tate & Lyle PLC, Musashino Chemical Laboratory, Ltd., Yancheng Huade (Dancheng) Biological Engineering Co., Ltd., Juneng Golden Corn Co. Ltd., Archer-Daniels-Midland Company (ADM).
Global D-lactic Acid Market Forecast and Regional Outlook:
Market Size & Growth Projections:
- 2025 Market Size: USD 299.02 million
- 2026 Market Size: USD 317.59 million
- Projected Market Size: USD 582.74 million by 2035
- Growth Forecasts: 6.9%
Key Regional Dynamics:
- Largest Region: Asia Pacific (35% Share by 2035)
- Fastest Growing Region: Asia Pacific
- Dominating Countries: United States, China, Germany, Japan, South Korea
- Emerging Countries: India, Brazil, Vietnam, Indonesia, Mexico
Last updated on : 20 November, 2025
D-lactic Acid Market - Growth Drivers and Challenges
Growth Drivers
- Upsurging Demand in Plant-Based Food Products- As more consumers switch to plant-based diets such as plant-based meat, as there is a growing demand for plant-based food products made with natural ingredients. D-lactic acid, which is frequently obtained from plant sources, is becoming increasingly popular as an ingredient in these products. As per the recent analysis, the unit sales of plant-based meat have raised by more than 15 % since 2019.
- Increasing Utilization in the Food and Beverage Industry- D-lactic acid is used as a food additive and preservative in the food and beverage industry. As per the report in 2022, the food and beverage industry makes up more than 2.5 % of India’s GDP.
- Upsurging Consumer Preferences for Natural Ingredients - There is a growing preference among consumers for natural ingredients in food and beverage products. D-lactic acid, which is produced through the fermentation of natural sugars is considered a natural ingredient and as a result, becoming increasingly popular.
- Growth of the Probiotic Market- According to research, the global probiotics market is expected to reach USD 75 billion during the upcoming years.
Challenges
- Lack of Availability of Raw Material- D-lactic acid is typically produced through the fermentation of carbohydrates such as glucose or corn syrup. The availability of these raw materials may be limiting the market growth of the D-lactic acid market.
- Lower Cost of Inorganic Pesticides
- Volatility in the Raw Material Price
D-lactic Acid Market Size and Forecast:
| Report Attribute | Details |
|---|---|
|
Base Year |
2025 |
|
Forecast Year |
2026-2035 |
|
CAGR |
6.9% |
|
Base Year Market Size (2025) |
USD 299.02 million |
|
Forecast Year Market Size (2035) |
USD 582.74 million |
|
Regional Scope |
|
D-lactic Acid Market Segmentation:
Concentration Segment Analysis
The above 90% segment is estimated to hold 60% share of the global D-lactic acid market during the forecast period owing to its use in the tanning, leather, and textile industries, pesticides, agrochemicals, production of biodegradable plastic, and others. The growth of the segment can be attributed to the increasing demand for biodegradable plastics produced from above 90% concentrated D-lactic acid which has high strength, and transparency, and use heat resistance, suitable for the utilization of applications such as packaging, disposable products, and much more. Upsurging demand for environmentally friendly and sustainable products, combined with government initiatives encouraging the use of biodegradable plastics, is expected to propel high demand for biodegradable plastics during the forecast period.
Application Segment Analysis
D-lactic acid market from the pesticide segment is predicted to hold a tremendous share in the near future. As per the report by FAO, in 2018, globally around 4.12 million tonnes of pesticides were used in agriculture. Moreover, the use of pesticides has huge economic benefits for the farmer, as well as, the overall food & beverages industry. For instance, as per the study by World Health Organization (WHO), every USD 1 spent on pesticides for crops can result in up to USD 4 saved in crops. This indicates that for every USD 10 billion spent on pesticides, an additional USD 40 billion can be saved in crop losses owing to insect and weed damage.
Our in-depth analysis of the global market includes the following segments:
|
Concentration |
|
|
Application |
|

Vishnu Nair
Head - Global Business DevelopmentCustomize this report to your requirements — connect with our consultant for personalized insights and options.
D-lactic Acid Market - Regional Analysis
APAC Market Insights
Asia Pacific industry is anticipated to dominate majority revenue share of 35% by 2035. The market is expanding owing to the area's large population and rapidly growing and evolving middle class, which is driving demand for products that are environmentally friendly and sustainable. The increasing industrial activity and urbanization in the Asia Pacific additionally fuel the need for D-lactic acid in sectors including industrial packaging, textiles, and plastics. As many local governments and organizations are supporting green initiatives along with more people becoming aware of the benefits of using bio-based materials, the market for D-lactic acid is growing. Furthermore, increased agricultural activity in the area, backed by rising pesticide use, can be credited to the market's expansion. In 2018, the Food and Agriculture Organization (FAO) reported that Asia accounted for more than 50% of all worldwide pesticide consumption. China utilized a total of 1,774 thousand tonnes of insecticides in the same year. Apart from this, a large section of the population in the APAC region is involved in agriculture. According to a World Bank estimate, 60.4% of land, and 56.1% of land in China in India were used for agricultural purposes in 2018.
North American Market Insights
The market in North America, is projected to hold a majority of the share by the end of 2035. The demand for D-lactic acid for a variety of applications, including pharmaceuticals, and industrial applications, is driven by the region's significant presence of key companies in the chemical and biotechnology industries. Additionally, owing to increasing chemical imports and consumption in the region, the market in North America is expected to increase its market share over the forecast period.
D-lactic Acid Market Players:
- Isagro S.p.A
- Company Overview
- Business Strategy
- Key Product Offerings
- Financial Performance
- Key Performance Indicators
- Risk Analysis
- Recent Development
- Regional Presence
- SWOT Analysis
- BASF SE
- Corbion NV
- Lallemand Inc.
- GALACTIC Group
- Tate & Lyle PLC
- Musashino Chemical Laboratory, Ltd.
- Yancheng Huade (Dancheng) Biological Engineering Co., Ltd.
- Juneng Golden Corn Co. Ltd.
- Archer-Daniels-Midland Company (ADM)
Recent Developments
- BASF SE announced that it has signed an agreement with AgBiome to launch a new fungicide in Europe and for key countries in Africa and the Middle East.
- Isagro S.p.A. announced the successful acquisition Phoenix-Del S.r.l. for a transactional value of around USD 4.23 Million. The acquisition will help Isagro to advance in the field of copper-based fungicides and bio-solutions.
- Report ID: 3952
- Published Date: Nov 20, 2025
- Report Format: PDF, PPT
- Explore a preview of key market trends and insights
- Review sample data tables and segment breakdowns
- Experience the quality of our visual data representations
- Evaluate our report structure and research methodology
- Get a glimpse of competitive landscape analysis
- Understand how regional forecasts are presented
- Assess the depth of company profiling and benchmarking
- Preview how actionable insights can support your strategy
Explore real data and analysis
Frequently Asked Questions (FAQ)
About this Report
Connect with our Expert

Report, 2026-2035


Copyright @ 2026 Research Nester. All Rights Reserved.
