Carbon Monoxide Market Outlook:
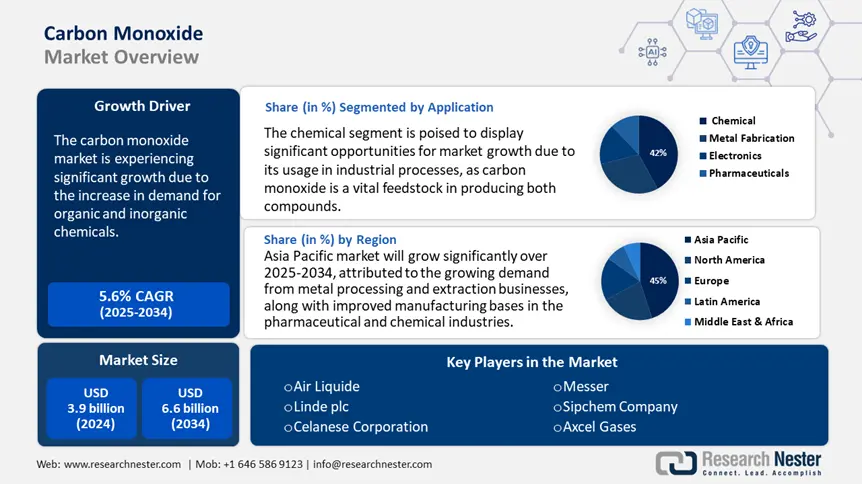
Carbon Monoxide Market size was valued at USD 3.9 billion in 2024 and is projected to reach USD 6.6 billion by the end of 2034, rising at a CAGR of 5.6% during the forecast period, i.e., 2025-2034. In 2025, the industry size of carbon monoxide is assessed at USD 4.1 billion.
The market is undergoing substantial growth, primarily driven by a surge in demand for organic and inorganic chemicals, as well as high demand for CO from various industries, including plastics and polymers, pharmaceuticals, and automotive. Additionally, the increasing global metal extraction and mining activities are also fueling market expansion. For instance, a report on "the era of reinvention" that was published in June 2023 claimed that metal extraction operations were heavily concentrated worldwide, with the United States leading by supplying 50% of the seven minerals and China supplying over 50% of the 18 minerals. The democratic republic of Congo produced 76% global cobalt, while China controlled 69% of rare-earth mine output and 92% of processing.
Furthermore, CO is a crucial compound that is employed in the production of water gas or syngas. Syngas is a synthesis gas, which is a combination of 60-65% carbon monoxide, 25-30% hydrogen, methane, and carbon dioxide in trace amounts. In various industrial procedures, syngas or water gas is deployed as a fuel across different applications. Previously, syngas was broadly used for spark-ignition engines during World War II. This growing use of syngas, due to its higher flame speed and as an industrial fuel gas, is projected to drive the market.
Carbon Monoxide Market - Growth Drivers and Challenges
Growth Drivers
- Growing industrial applications: The rise in the use of industrial procedures, as carbon monoxide serves as a significant intermediate in the manufacturing of numerous chemicals such as methanol, phosgene, and acetic acid, significantly contributes to the market expansion. For instance, the production of methanol was projected to surpass 111 million metric tons, representing a surge of around 4% compared to the previous year. CO is a key preference in several industries, such as food packaging and pharmaceuticals, for processing applications and synthesis. Moreover, as global industrialization develops, the demand for CO in the form of chemical feedstock continues to develop, particularly in emerging economies.
- Technological advancements in carbon capture and utilization: The market is also witnessing a significant surge due to the innovations and developments in carbon capture utilization (CCU) technologies. Advanced CCU systems allow the effective extraction of carbon monoxide from industrial emissions, which can further be utilized in various other applications such as chemical synthesis and fuel production. In addition, environmental regulations and various government initiatives that endorse clean energy solutions also contribute towards supporting these technologies.
1.Production Capacity Analysis for Carbon Monoxide
Global Production Capacity by Company & Location (2023)
|
Company |
Location |
Capacity (kT/year) |
Process |
|
Linde plc |
USA, Germany |
1,200 |
Steam Methane Reforming |
|
Air Liquide |
France, China |
950 |
Partial Oxidation |
|
BASF |
Germany, USA |
700 |
Coal Gasification |
|
Dow Chemical |
USA, Netherlands |
600 |
Steam Reforming |
|
Mitsubishi Gas |
Japan, Singapore |
500 |
Auto-Thermal Reforming |
|
Sinopec |
China |
1,500 |
Coal Gasification |
(Sources: ICIS, ACC)
Demand Analysis by End-Use, Grade & Type
End-Use Demand Growth (2018–2023)
|
Application |
Annual Growth (%) |
Key Driver |
|
Pharmaceuticals |
6.5% |
Drug intermediates & antibiotics |
|
Agrochemicals |
5.2% |
Pesticide & herbicide production |
|
Electronics |
8.1% |
Lithium-ion battery electrolytes |
|
Metals & Mining |
4.0% |
Steel & aluminum processing |
Sales Channel Performance (2023)
|
Channel |
Market Share (%) |
Growth (YoY) |
|
Direct Sales |
65% |
+4.2% |
|
E-Commerce |
20% |
+12.5% |
|
Distributors |
15% |
+3.0% |
Trade Data & Customer Insights
Port-Wise Carbon Monoxide Trade (2019–2023, $B)
|
Port |
2019 |
2020 |
2021 |
2022 |
2023 |
|
Shanghai (China) |
2.1 |
1.8 |
2.5 |
3.0 |
3.4 |
|
Rotterdam (EU) |
1.5 |
1.3 |
1.7 |
2.0 |
2.2 |
|
Houston (USA) |
1.2 |
1.0 |
1.4 |
1.6 |
1.8 |
|
Singapore |
0.9 |
0.8 |
1.1 |
1.3 |
1.5 |
(Source: UN Comtrade)
Top Buyers of Specialty Chemicals in Asia-Pacific (2023)
|
Company |
Country |
Volume (kT) |
Primary Use Case |
|
LG Chem |
South Korea |
250 |
Battery electrolytes |
|
Toray Industries |
Japan |
180 |
High-performance polymers |
|
Reliance Industries |
India |
150 |
Petrochemicals |
|
Formosa Plastics |
Taiwan |
120 |
Plastic manufacturing |
|
PTT Global |
Thailand |
100 |
Industrial gases |
2.Government Subsidies Impacting Carbon Monoxide Industry (2014-2024)
|
Country |
Subsidy Program |
Allocation (USD Billion) |
Impact on CO Industry |
|
China |
Made in China 2025 |
$1.5 |
+25% production capacity (2020-2024) |
|
U.S. |
DOE Clean Energy Grants |
$0.8 |
12 new CO capture plants (2018-2023) |
|
Germany |
National Hydrogen Strategy |
$1.2 |
30% rise in syngas R&D (2019-2024) |
(Sources: China Ministry of Industry, U.S. DOE, German Federal Ministry for Economic Affairs)
Tax Incentives in U.S. vs. EU
|
Region |
Incentive |
Value |
Impact |
|
U.S. |
Section 45Q Tax Credit |
$50/ton CO₂ stored |
18% increase in CCS projects (2020-2024) |
|
EU |
Innovation Fund |
€10B (2020-2030) |
40+ low-carbon chemical plants funded |
|
EU |
ETS Free Allowances |
€25/ton CO₂ |
8% reduction in emissions (2019-2023) |
(Sources: IRS, European Commission)
Regulatory Frameworks in EU & India
|
Region |
Regulation |
Compliance Cost Increase |
Environmental Impact |
|
EU |
REACH |
+15% (2018-2024) |
22% fewer hazardous chemicals (2015-2023) |
|
India |
CPCB Emission Norms |
+10% (2020-2024) |
12% lower industrial emissions (2019-2023) |
(Sources: ECHA, Central Pollution Control Board India)
3.Market Overview: Japan’s Carbon Monoxide Market (2018–2023)
Composition of Carbon Monoxide Chemical Shipments (Japan, 2018–2023)
|
Category |
2018 (¥T) |
2023 (¥T) |
% Share (2023) |
CAGR |
|
Petrochemicals |
10.5 |
12.0 |
45% |
2.7% |
|
Polymers |
6.8 |
8.2 |
31% |
3.8% |
|
Specialty Chemicals |
4.2 |
5.5 |
21% |
5.5% |
|
Others |
1.5 |
1.3 |
3% |
-2.9% |
(Source: Japan Chemical Industry Association, 2024)
Value of Shipments by Manufacturing Industry (¥T)
|
Sector |
2018 |
2023 |
CAGR |
Global Avg. CAGR |
|
Automotive |
5.2 |
7.6 |
8.0% |
5.2% |
|
Electronics |
4.8 |
6.9 |
7.5% |
6.8% |
|
Pharmaceuticals |
3.1 |
4.3 |
6.8% |
7.0% |
|
Construction |
2.4 |
2.6 |
1.6% |
2.4% |
(Sources: METI, ICIS, 2023)
R&D and Capital Investment Trends (Top 5 Firms, 2023)
|
Company |
R&D Spend (¥B) |
Focus Area |
Capital Investment (¥B) |
|
Mitsubishi Chemical |
150 |
Bioplastics, CCS |
200 |
|
Shin-Etsu Chemical |
120 |
Semiconductor materials |
180 |
|
Sumitomo Chemical |
95 |
Batteries, Agrochemicals |
150 |
|
Toray Industries |
80 |
Carbon fiber |
120 |
|
Asahi Kasei |
70 |
Hydrogen technologies |
100 |
Top Chemical Companies: Financial Performance (2023)
|
Company |
Revenue (¥T) |
Profit (¥B) |
Margin (%) |
|
Shin-Etsu Chemical |
3.5 |
1,200 |
34.3 |
|
Mitsubishi Chemical |
3.2 |
950 |
29.7 |
|
Sumitomo Chemical |
2.8 |
780 |
27.9 |
|
Toray Industries |
2.5 |
700 |
28.0 |
|
Asahi Kasei |
2.3 |
650 |
28.3 |
Challenges
- Health and environmental hazards: The poisonous nature of carbon monoxide is one of the primary challenges. It is an odorless and colorless gas that can cause severe health complications, such as death, at high levels of exposure. Stringent safety regulations and rising public health issues have resulted in a standardized control over different operations, including handling transportation and production of CO. For instance, OSHA mandates that the exposure of CO not exceed the permissible limit of 50 ppm averaged over 8 hours in workplaces. These regulatory restraints and increasing operational costs can prevent the entry of new market players, thereby adversely impacting the overall market.
-
Limited awareness and infrastructure in developing regions: Lack of undeveloped or developing infrastructure and improper awareness about the handling of carbon monoxide, particularly in various developing countries, is another key challenge. While developed countries have advanced technologies, industries, as well as safety systems that aid in managing CO, emerging economies face issues with insufficient safety measures and technological advancements.
Carbon Monoxide Market Size and Forecast:
| Report Attribute | Details |
|---|---|
|
Base Year |
2024 |
|
Forecast Year |
2025-2034 |
|
CAGR |
5.6% |
|
Base Year Market Size (2024) |
USD 3.9 billion |
|
Forecast Year Market Size (2034) |
USD 6.6 billion |
|
Regional Scope |
|
Carbon Monoxide Market Segmentation:
Application Segment Analysis
The chemical segment is expected to gain the largest carbon monoxide market share of 42% during the projected period. This growth is attributed to their usage in industrial processes. In addition, CO is a vital feedstock in producing both compounds. Within the chemicals, the application of acetic acid varies from textiles, plastics, and food industries, whereas methanol is a key component in solvents and fuels. The upward demand from evolving economies and advancements in CCU further propels the use of carbon monoxide in chemical synthesis.
End use Segment Analysis
The chemical manufacturing segment is anticipated to rise significantly with a carbon monoxide market share of 38% by 2034, owing to its wide-ranging use as a raw material in the production of several chemicals such as phosgene and methanol. As the demand for these chemicals in industries including agrochemicals, plastics, and pharmaceuticals increases, the requirement for carbon monoxide continues to surge. For instance, the global agrochemical market was estimated at USD 223 billion in 2022, with the projected growth of USD 285 billion by 2030. Furthermore, development in synthesis technology and the demand for cleaner manufacturing approaches with their use have led to a surge in the adoption of the product in large-scale chemical production globally.
Source Segment Analysis
The steam reforming segment is projected to constitute the most significant growth by 2034, with a 35% market share, driven by its cost efficacy and proficiency. Steam reforming is a highly used method for manufacturing high-purity carbon monoxide, particularly in large-scale industrial infrastructure. The presence of abundant natural gas and its lower cost make it a viable feedstock. Moreover, the increasing demand for CO in the production of fuel and chemical synthesis boosts the dependence on steam reforming due to its scalability and reliability.
Our in-depth analysis of the global carbon monoxide market includes the following segments:
|
Segment |
Subsegment |
|
Application |
|
|
End Use |
|
|
Source |
|

Vishnu Nair
Head - Global Business DevelopmentCustomize this report to your requirements — connect with our consultant for personalized insights and options.
Carbon Monoxide Market - Regional Analysis
Asia Pacific Market Insights
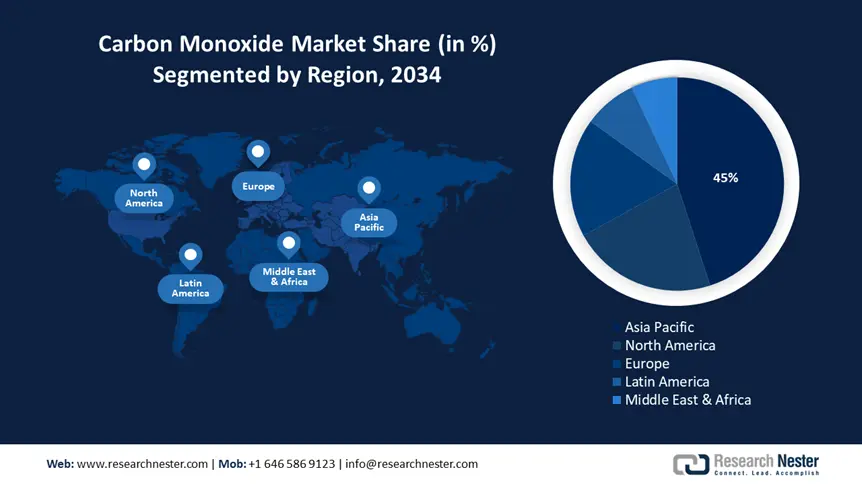
By 2034, Asia Pacific is expected to hold 45% of the carbon monoxide market share due to the developing demand from metal processing and extraction businesses, along with improved manufacturing bases in the pharmaceutical and chemical industries. Furthermore, the budding need for high-purity and electronic-grade carbon monoxide from nations including China and Japan, especially for circuits and semiconductor manufacturing, is projected to boost the market in the region. For instance, the semiconductor market in China is anticipated to reach USD 206.7 billion in 2025. In addition, integrated circuits are expected to contribute $ 164.9 billion, reaching USD 282.6 billion by 2030 due to the growing demand for advanced electronics. Moreover, the presence of end end-user sector makes the Asia Pacific a core market.
China’s market is projected to witness a significant rise over the forecast period, owing to rapid industrialization, particularly in the metal and steel processing sector. China’s focus on fueling the production of syngas for methanol manufacturing and chemical synthesis further drives the market. In addition, the expansion of coal gasification plants and large-scale urban infrastructure further propels the demand for CO in the country. For instance, in 2023, the coal gasification sector of China experienced an increase of 18%, with a consumption of over 340 million tons of coal for the production of chemicals through coal-to-syngas procedures.
The market in India is also expected to experience an upward trend, driven by the surging demand from several industries, particularly the agrochemicals and pharmaceutical industries, where carbon monoxide is utilized as a synthesis gas. In addition, government initiatives promoting ‘Make in India’ and indirect foreign investments in manufacturing have resulted in various small and medium-scale startups, indirectly supporting the market in the country. Furthermore, the rise of the automotive industry with the rising application of CO in the surface treatment and metal refining is also expected to fuel the market expansion in the country.
APAC Carbon Monoxide Market: Country-Wise Insights
|
Country |
Industrialization (Key Sectors) |
Urbanization Rate (2023) |
Health & Safety Awareness Initiatives |
CO-Related Regulations |
|
China |
Steel, chemicals, electronics, automotive |
64% |
Strict workplace exposure limits (20 ppm); national CO detector mandates in residential buildings (2021) |
GB 30871-2022 (workplace safety), MEPS for industrial emissions |
|
India |
Petrochemicals, textiles, refining |
35% |
Rising adoption of CO sensors in industries; OSHA-compliant training programs (15% increase since 2020) |
CPCB norms (1-hour avg. limit: 10 mg/m³) |
|
Japan |
Advanced materials, electronics |
92% |
Mandatory CO alarms in homes (100% compliance); industry-funded R&D for low-emission tech |
Industrial Safety and Health Act |
|
South Korea |
Shipbuilding, semiconductors, batteries |
82% |
Public health campaigns (30% reduction in CO poisoning cases since 2018) |
KOSHA standards (25 ppm workplace threshold) |
|
Vietnam |
Textiles, cement, food processing |
38% |
Pilot projects for CO monitoring in Hanoi/HPH (2022); limited enforcement |
Draft National Technical Regulation (QCVN 19:2023) |
|
Indonesia |
Mining, palm oil, plastics |
57% |
Ministry of Health CO awareness programs (5M people reached in 2023) |
MOE Regulation No. 21/2008 (vehicle emissions) |
|
Thailand |
Automotive, rubber, agrochemicals |
52% |
Workplace safety grants (500 factories upgraded with CO detectors in 2022) |
Factory Act B.E. 2535 (1992) |
(Sources: World Bank Urbanization Data, National Health Ministries, ILO Safety Reports)
North America Market Insights
The North American carbon monoxide market is expected to gain a substantial share of 21.9%, over the forecast period, attributed to the presence of several manufacturers in the U.S. In addition, the rise in mining processes and activities, as well as the surge in examination of metal ores, also contribute to the market development. For instance, according to the U.S. Geological Survey (USGS), in 2024, the production of non-fuel mineral value stood at $106 billion, an increase of 1% from the previous year. In addition, the industrial minerals were valued at $72.1 billion, accounting for approximately 68% of the total mine production in the country, which was valued at $33.5 billion, propelled by the high prices of gold and silver.
U.S. carbon monoxide market dominated the region and held the largest market share in 2024, owing to the rising petrochemical industries and oil refineries, as these industries utilize CO in chemical synthesis processes. For instance, as per the U.S. Energy Information Administration, the country operated 132 refineries with a distillation capacity of 18.4 million barrels per calendar day as of 2024. This marks an increase of 2% from the start of 2023. The Beaumont capacity of ExxonMobil rose from 369,000 to 609,000 b/cd, Valero’s Port Arthur rising by 25,000 b/cd, plus 50,000 b/cd coking capacity. In addition, the increasing demand in the chemical manufacturing sector, especially for the production of phosgene and acetic acid, also boosts the market.
Canada’s market is anticipated to grow at a substantial rate by the end of 2034, driven by the increasing adoption of carbon monoxide in metallurgical applications, particularly in nickel refining and iron ore reduction. In addition, rising fabrication industries and increased infrastructure advancements, which require purified CO for surface treatments and welding processes, are driving the market in the country. Furthermore, Canada’s focus on low-emission processing technologies and sustainable mining also supports the use of syngas.
Europe Market Insights
The market in Europe is projected to register a significant share of 17.8% during the forecast period, driven by the rising product demand from the pharmaceutical and metal fabrication sectors. In addition, the presence of recognized market players and a large product manufacturing base also supports the market in the region. Furthermore, with key contributions from countries such as the UK, France, and Germany, the region’s focus on green chemical applications and sustainability is expected to fuel the market in Europe.
Europe Carbon Monoxide Market: Country-Wise Industrial Insights
|
Country |
Key Industries Using CO |
Industrial Contribution to GDP (2023) |
CO Utilization Examples |
Regulatory Framework |
|
Germany |
Automotive, Chemicals, Steel |
26.7% |
CO in syngas for methanol production |
TA Luft (emission limits), REACH compliance |
|
France |
Petrochemicals, Aerospace, Pharmaceuticals |
19.4% |
CO for acetic acid synthesis |
ICPE regulations (CO workplace exposure ≤ 30 ppm) |
|
Italy |
Rubber/Plastics, Refining, Machinery |
22.1% |
CO in polycarbonate manufacturing |
Legislative Decree 81/2008 (occupational safety) |
|
Netherlands |
Chemicals, Agrochemicals, Energy |
18.9% |
CO for oxo-alcohols |
Dutch Emissions Guidelines (NER) |
|
Poland |
Steel, Fertilizers, Automotive Components |
24.3% |
CO in blast furnaces |
Polish PN-EN standards (industrial emissions) |
|
Spain |
Automotive, Cement, Specialty Chemicals |
20.6% |
CO for phosgene production |
Royal Decree 117/2003 (air quality) |
|
UK |
Pharmaceuticals, Refining, Coatings |
17.8% |
CO in carbonylation reactions |
COSHH Regulations (workplace ≤ 20 ppm) |
(Sources: Eurostat, National Industry Reports, ECHA, OSHA Europe)
Key Carbon Monoxide Market Players:
- Company Overview
- Business Strategy
- Key Product Offerings
- Financial Performance
- Key Performance Indicators
- Risk Analysis
- Recent Development
- Regional Presence
- SWOT Analysis
The market is intensely competitive due to the presence of several prominent market players. Strategic application of distribution channels, sustainability credentials, and purification technologies is among the major elements of the competitive dynamics in the market. Key market players are focusing on the development of membrane separation and adsorption systems and aim to offer ultra-high purity grades to generate high margins in the niche end-applications. Furthermore, to better serve the short-cycle online and offline orders. The mid-level companies are focusing on enhancing operational agility and optimizing assets.
|
Company |
Country |
Market Share (2024) |
|
Linde plc |
Germany/USA |
18.5% |
|
Air Liquide |
France |
15.2% |
|
BASF SE |
Germany |
12.8% |
|
Dow Chemical |
USA |
9.6% |
|
Mitsubishi Gas Chemical |
Japan |
7.4% |
|
Sinopec (China Petrochemical) |
China |
xx% |
|
Shell Chemicals |
Netherlands |
xx% |
|
Reliance Industries |
India |
xx% |
|
LyondellBasell |
Netherlands/USA |
xx% |
|
Chevron Phillips Chemical |
USA |
xx% |
|
LG Chem |
South Korea |
xx% |
|
Petronas Chemicals |
Malaysia |
xx% |
|
CSBP (Wesfarmers Chemicals) |
Australia |
xx% |
Here are a few areas of focus covered in the competitive landscape of the market:
Recent Developments
- In January 2024, Linde Plc announced the startup for the supply of clean hydrogen and captured carbon dioxide to Celanese at its Clear Lake, Texas. The site uses a carbon monoxide and hydrogen production unit, allowing effective CCU. The captured carbon dioxide derived from the processing of CO supports Celanese's sustainable chemical products. This strategic move reinforces Linde’s role in decarbonization and clean energy efforts while displaying the industrial value of carbon monoxide in integrated gas supply as well as carbon management solutions.
- In May 2023, Air Products company revealed plans to increase its Gulf Coast carbon monoxide infrastructure by building two new world-scale CO production facilities in Texas. The project aims to meet the rising demand from industries that require high-purity CO for chemical manufacturing. This strategic launch strengthens Air Products’ control in the infrastructure of carbon monoxide supply and further supports the region’s petrochemical sector with reliable, large-scale CO delivery and improved operational effectiveness.
- Report ID: 7932
- Published Date: Jul 25, 2025
- Report Format: PDF, PPT
- Explore a preview of key market trends and insights
- Review sample data tables and segment breakdowns
- Experience the quality of our visual data representations
- Evaluate our report structure and research methodology
- Get a glimpse of competitive landscape analysis
- Understand how regional forecasts are presented
- Assess the depth of company profiling and benchmarking
- Preview how actionable insights can support your strategy
Explore real data and analysis
Frequently Asked Questions (FAQ)
Carbon Monoxide Market Report Scope
Free Sample includes current and historical market size, growth trends, regional charts & tables, company profiles, segment-wise forecasts, and more.
Connect with our Expert


