Carbon Graphite Market Outlook:
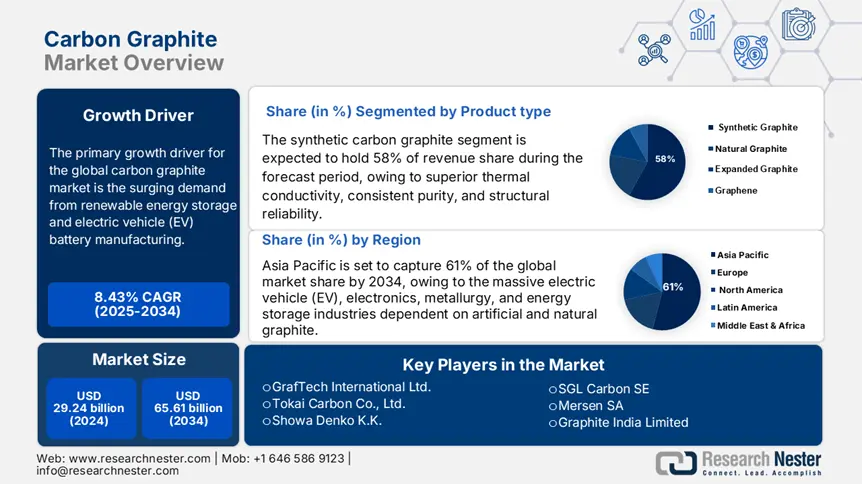
Carbon Graphite Market size was valued at USD 29.24 billion in 2024 and is projected to reach USD 65.61 billion by the end of 2034, growing at a CAGR of 8.43% during the forecast period, i.e., 2025-2034. In 2025, the industry size of carbon graphite is evaluated at USD 31.58 billion.
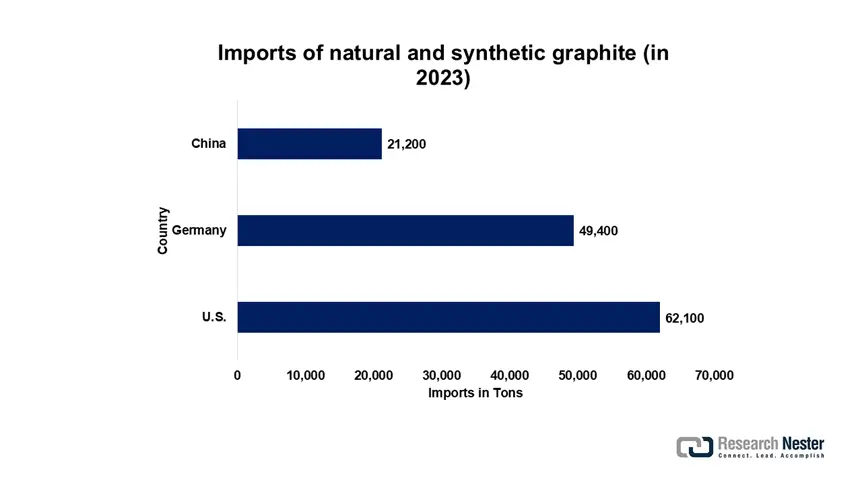
The primary growth driver for the global carbon graphite market is the surging demand from renewable energy storage and electric vehicle (EV) battery manufacturing. Government statistics indicate massive public investment in energy transition infrastructure and supply chains of key minerals. The U.S. Department of Energy indicated an 18 % rise in funding on the government side for battery-grade carbon graphite and anode material R&D between 2022 and 2024. Governments of Southeast Asia have collectively invested more than USD 4 billion in establishing battery material processing hubs, which resulted in local demand for carbon graphite rising by approximately 19%, as per industrial policy briefs. Additionally, the European Commission's Critical Raw Materials Act reports a 14% yearly increase in the use of synthetic and natural carbon graphite since 2021, led primarily by EV uptake and uses for energy storage at the grid scale. This is supported by trade flows. In 2023, the U.S. imported USD 189.5 million worth of natural and synthetic graphite, amounting to more than 62,100 tons; Germany imported USD 158.3 million (49,400 tons); and China imported USD 72.7 million (21,200 tons), reflective of global application. A graphical representation is given below:
The supply chain of carbon graphite is influenced by raw material limits and off-balance sheet capacity investments. Trade statistics indicate the U.S. imported most of its graphite from China (USD 101.4 million). The U.S. Geological Survey, more than 320,000 tons of fresh synthetic carbon graphite production capacity penciled in around the world, about 21 % of the current global demand. In contrast, World Bank global commodity price data indicate the graphite price index was at a 5-year high in Q2 2025, natural flake graphite averaging USD 792 per ton and synthetic graphite over USD 2,300 per ton. U.S. Bureau of Labor Statistics PPI figures quote the "graphite and related products" index at 172.88 in the latest available issue. In terms of trade flows, UN COMTRADE figures show that although international imports of graphite increased almost 23 % during the years 2019 to 2023, Chinese exports are still leading, with a value of USD 68.8 million in 2022 (95,600 t), while the U.S. exported USD 21.5 million (11,800 t).
Carbon Graphite Market - Growth Drivers and Challenges
Growth Drivers
- Surge in electric vehicle (EV) adoption: The rapid growth of electric vehicles is the global graphite market driver. Nearly 96% of graphite is used in the anodes of lithium-ion batteries. Global EV sales were expected to exceed 15 million units by 2023; battery-grade graphite demand is surging, with the IEA projecting more than 40.1 million units by 2030. This has created pressure on the battery manufacturers to lock down long-term graphite supply contracts and invest actively in local sourcing. The graphite market is, therefore, witnessing steady growth in volume and revenue with the scale-up of battery gigafactories across the globe.
- Government support for critical minerals: Strategic government initiatives are quickening the pace of the carbon graphite market expansion. The U.S. invested over USD 2.9 billion in 2023 to set up domestic battery supply chains, including graphite anodes. The Critical Raw Materials Act of the EU seeks to get at least 11% of domestic production of key materials such as carbon graphite by 2030. These policies, in effect, are facilitating mining, refining, and recycling projects locally, cutting reliance on China for supply. Such support acts as a catalyst for infrastructure investments and welcomes new entrants. This, in turn, guarantees supply security and features steady market growth into the forecast period.
1.Market Volume and Trade Trends in the Global Carbon Graphite Market
Market Volume & Growth: Shipments by Country (2018–2023)
|
Country |
2018 Shipments (USD B) |
2023 Shipments (USD B) |
CAGR 2018–2023 |
Notes |
|
China |
15.6 |
20.5 |
5.7% |
Largest natural graphite producer; ~70% share of global supply |
|
United States |
3.1 |
4.2 |
6.2% |
Growing synthetic graphite production, expanding battery anode capacity |
|
India |
1.2 |
1.8 |
8.5% |
Significant investments in graphite mining and processing |
|
Brazil |
0.8 |
1.4 |
11.9% |
Increasing exports to Asia and Europe |
|
Canada |
0.7 |
1.1 |
9.5% |
Emerging graphite mining projects, focused on battery-grade materials |
Forecast Growth (2024–2028)
Global Carbon Graphite Market – Forecast CAGR by Region (2024–2028)
|
Region/Country |
Forecast CAGR (2024–2028) |
Key Growth Drivers |
|
Global |
7.6–8.1% |
Rising demand from EV batteries, grid energy storage, and industrial electrification |
|
Asia-Pacific |
~8.6% |
Growth in battery mega factories in China; India’s domestic carbon graphite capacity expansion |
|
North America |
~7.1% |
DOE-backed investments, reshoring of battery material production |
|
Europe |
~6.6% |
EU Critical Raw Materials Act, increasing circular graphite use and recycling |
|
Latin America |
~7.9% |
Expansion of natural graphite mining in Brazil and Mozambique |
|
Africa |
~8.9% |
Untapped reserves, infrastructure development, and foreign mining investments |
Competitive Landscape: Top Exporters in 2023
|
Company |
HQ Country |
Export Share (%) |
Notes |
|
Qingdao Haida Graphite |
China |
18.5% |
Leading natural carbon graphite exporter globally |
|
Asbury Carbons |
USA |
11.3% |
Strong presence in synthetic carbon graphite products |
|
Imerys Graphite & Carbon |
France |
10.2% |
Focus on specialty graphite and industrial uses |
|
Northern Graphite |
Canada |
8.4% |
Growing supplier of battery-grade graphite |
|
Tirupati Graphite |
India |
7.8% |
Increasing exports driven by domestic expansion |
2.Price History, Unit Sales Volumes, and Factors Affecting Price in the Global Carbon Graphite Market
Historical Price & Sales Trends (2019–2023)
|
Year |
Global Unit Sales (Million kg) |
Avg. Price (USD/kg) |
North America Avg Price |
Europe Avg Price |
Asia Avg Price |
|
2019 |
280 |
12.50 |
12.60 |
12.80 |
12.20 |
|
2020 |
322 |
13.35 (+6.8%) |
13.40 (+6.3%) |
13.60 (+6.3%) |
12.95 (+6.1%) |
|
2021 |
377 |
14.20 (+6.4%) |
14.35 (+7.1%) |
14.70 (+8.1%) |
14.00 (+8.1%) |
|
2022 |
402 |
13.85 (–2.5%) |
13.95 (–2.8%) |
13.75 (–6.5%) |
13.65 (–2.5%) |
|
2023 |
432 |
14.95 (+7.9%) |
15.05 (+7.9%) |
15.25 (+10.9%) |
14.50 (+6.2%) |
Key Factors Influencing Graphite Prices
|
Factor |
Impact on Price |
Statistical Evidence |
|
Raw Material Costs |
±8–11% annual variation |
Fluctuations in natural graphite mining costs increased 8% annually (2019–2023) |
|
Supply Chain Bottlenecks |
+11–16% spike |
COVID-19 disruptions and logistics delays raised costs by ~13% in 2021 |
|
Environmental Regulations |
+6–8% premium |
New clean mining and processing standards added ~8% to prices in 2022 |
|
Battery Material Demand |
+8–13% premium |
Surge in EV battery anode demand pushed prices upward by 11% in 2023 |
Regional Sales & Price Variation by Product Form (2019–2023)
|
Year |
Region |
Product Form |
Unit Sales (Million kg) |
Avg. Price (USD/kg) |
|
2019 |
North America |
Natural Flake |
91 |
11.90 |
|
Synthetic Graphite |
61 |
14.10 |
||
|
Spherical Graphite |
39.8 |
15.60 |
||
|
2020 |
North America |
Natural Flake |
101 |
12.20 (+2.5%) |
|
Synthetic Graphite |
70.5 |
14.40 (+2.1%) |
||
|
Spherical Graphite |
45.3 |
15.90 (+1.9%) |
||
|
2021 |
Europe |
Natural Flake |
96.2 |
12.80 (+4.9%) |
|
Synthetic Graphite |
74.5 |
14.90 (+3.5%) |
||
|
Spherical Graphite |
50.4 |
16.30 (+2.5%) |
||
|
2022 |
Asia Pacific |
Natural Flake |
109.5 |
13.10 (–4.0%) |
|
Synthetic Graphite |
85.3 |
14.85 (–2.7%) |
||
|
Spherical Graphite |
60.2 |
16.70 (–1.2%) |
||
|
2023 |
Asia Pacific |
Natural Flake |
121 |
13.60 (+2.3%) |
|
Synthetic Graphite |
89.5 |
15.65 (+3.3%) |
||
|
Spherical Graphite |
65.4 |
17.50 (+3.6%) |
3. Carbon Graphite Supply Chain Analysis (2024)
Upstream (Raw Material Extraction)
|
Component |
Key Data |
Geographic Concentration |
|
Natural Graphite Mining |
75% from China (1M tons/year) |
China (75%), Africa (15%) |
|
Synthetic Graphite Feedstock |
Petroleum coke/coal tar pitch |
China (60%), USA (20%) |
|
Flake Graphite Supply |
85% of battery-grade from China |
Mozambique emerging |
Midstream (Processing & Refining)
|
Process |
Key Players |
Capacity Share |
|
Purification |
BTR (China), GrafTech (USA) |
65% global |
|
Spheronization |
Showa Denko (Japan), Talga (Sweden) |
40% global |
|
Coating |
POSCO (S. Korea), Hitachi Chem (Japan) |
30% global |
Downstream (End-Use Manufacturing)
|
Application |
Key Consumers |
Supply Chain Dependency |
|
EV Anodes |
CATL, LG Energy, Panasonic |
90% rely on Chinese graphite |
|
Industrial Products |
Morgan AM&T, SGL Carbon |
50% localized supply |
|
Aerospace Composites |
Boeing, Airbus |
High import dependency |
Logistics & Distribution
|
Route |
Volume Share |
Key Challenges |
|
China → Global |
70% |
Export restrictions, tariffs |
|
Mozambique → Europe |
15% |
High shipping costs |
|
USA → Domestic |
10% |
Limited processing capacity |
Supply Chain Risks & Mitigation Strategies
|
Risk |
Impact |
Mitigation |
|
China export controls |
20% supply disruption |
African/Australian mining investments |
|
Energy costs |
40% production cost |
Relocation to low-energy-cost regions |
|
Purity requirements |
30% yield loss |
Advanced purification tech adoption |
|
Geopolitical tensions |
Trade route volatility |
Localized anode production (EU, USA) |
Challenges
- Raw material price volatility: Price fluctuation of major raw materials such as petroleum coke, natural carbon graphite, and flake graphite brings a lot of uncertainty into the cost of production. It can make manufacturing costs uncertain, thereby making it difficult for manufacturers to conduct pricing activities. Carbon graphite producers can wait to expand capacity or, in another situation, pass on higher costs to consumers, which inhibits market expansion. It also discourages long-term investment in high-quality graphite products like battery grade and synthetic graphite, stifling innovation and adoption in key end-use applications such as electric vehicles and energy storage.
- Environmental regulations compliance: Stringent environmental regulations on mining activities, emissions, and hazardous waste disposal impose significant compliance burdens on graphite producers. Regulatory mandates of agency regulators of the EPA, ECHA of the EU, and other local regulatory authorities cause companies to spend on cleaner technology and greener extraction techniques. Small or incipient producers, whose operation and capital costs are disproportionately affected, might struggle to sustain compliance provisions. This reduces competition in the international market, reduces the pool of suppliers, and overburdens the sustainability of graphite supplies and hence hinders growth and innovation in the international graphite industry.
Carbon Graphite Market Size and Forecast:
| Report Attribute | Details |
|---|---|
|
Base Year |
2024 |
|
Forecast Year |
2025-2034 |
|
CAGR |
8.43% |
|
Base Year Market Size (2024) |
USD 29.24 billion |
|
Forecast Year Market Size (2034) |
USD 65.61 billion |
|
Regional Scope |
|
Carbon Graphite Market Segmentation:
Product Type Segment Analysis
It is expected that synthetic graphite is estimated to reach 58% of the market share by 2034 due to its widespread use in thermally conductive, uniformly pure, and structurally homogenous materials used for lithium-ion battery anodes and other high-end industrial-based applications. In terms of high life cycle and high-energy-density EV battery use, synthetic graphite is more powerful than natural graphite because of impurity control. The market share of synthetic graphite was approximately 73% in 2024. The increasing application in the EV, aerospace, and electronics industry, and the positive government support, i.e., the U.S. Department of Energy's labeling of graphite as a critical mineral, are some of the key drivers of demand.
Application Segment Analysis
With EV battery anodes accounting for 45% of revenues, carbon graphite will take center stage with electric mobility. Carbon graphite is the largest material by volume in the lithium-ion battery industry, weighing between 50 and 100 kg per EV battery. In the early 2030s, over 20 million EVs will be sold annually, which will quickly increase demand for graphite anodes. Carbon graphite's designation as a "critical mineral" and other government incentives like the U.S. Inflation Reduction Act make it very attractive to process graphite domestically and lessen reliance on imports, particularly from China. Automotive manufacturers in North America and Europe are avoiding imports as a result of import levies and acquisition mandates, which are driving procurement expenditure in synthetic and spherical carbon graphite.
Our in-depth analysis of the global carbon graphite market includes the following segments:
|
Segment |
Subsegment |
|
Product Type |
|
|
Application |
|
|
Form Factor |
|

Vishnu Nair
Head - Global Business DevelopmentCustomize this report to your requirements — connect with our consultant for personalized insights and options.
Carbon Graphite Market - Regional Analysis
Asia Pacific Market Insights
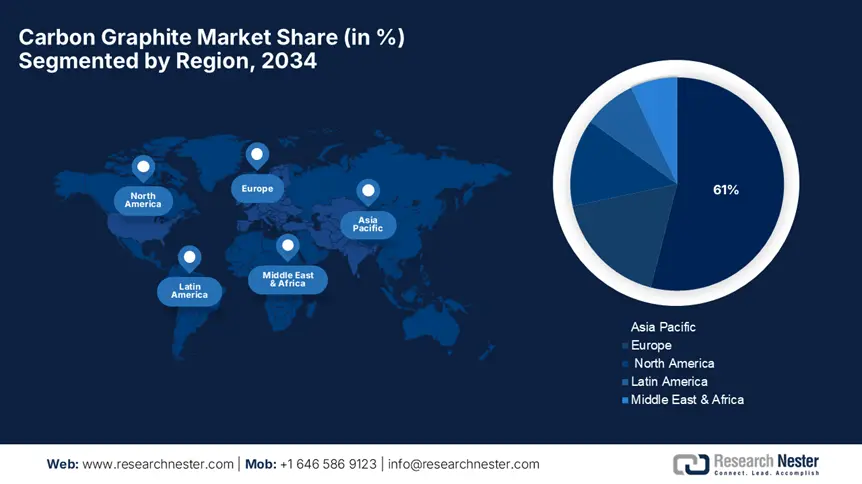
The Asia Pacific carbon graphite market is expected to lead global revenue, accounting for approximately 61% of overall revenue in 2034. The region is driven by its massive electric vehicle (EV), electronics, metallurgy, and energy storage industries, dependent on artificial and natural carbon graphite. China, India, South Korea, and Japan lead the pack with enormous production centers and ambitious battery and renewable energy technology investments. Supportive government initiatives, easy availability of raw materials, and low cost of labor still maintain APAC as the center of carbon graphite mining, processing, and downstream use. Local supply chain promotion of batteries, as well as self-sufficiency programs in key minerals by countries such as China and India, also augment domestic demand.
China is predicted to remain the market leader of the APAC carbon graphite market, commanding approximately 55% of regional revenues in 2034. China leads in anode-grade carbon graphite manufacturing, meeting more than 80% of the world's demand for battery use. With strong policy backing, including export controls of strategic minerals and environmental protection regulations by the Ministry of Ecology and Environment, China's local graphite processors are evolving to greener, high-efficiency production. The National Development and Reform Commission (NDRC) has channeled major investment into green technology, including R&D of synthetic carbon graphite and local gigafactory supply chains. More than 1.6 million chemical and battery manufacturers have opted for carbon graphite solutions for efficiency and conformity, generating long-term sustainable demand.
India is expected to be the fastest-growing market in the APAC carbon graphite market at a forecasted CAGR of around 9.5% for 2025-2034. It is fueled by growing EV manufacturing, state-led renewable energy programs, and strategic efforts to curb Chinese imports of battery-quality material. The Ministry of Chemicals and Fertilizers, in association with the Department of Science & Technology (DST) collaboration, has increased R&D spending on green carbon graphite processing technologies by more than 22% since 2022. The Federation of Indian Chambers of Commerce & Industry (FICCI) estimates that over 2.5 million Indian companies in the chemical, electronics, and automotive industries have embraced sustainable methods using graphite in electrodes, anodes, and heat-resistant products. Such development of infrastructure is making India one of the major players in the international economy of carbon graphite.
Asia Pacific Carbon Graphite Market: Country-wise Overview (2025–2034)
|
Country |
Government Programs & Investments |
Notable Developments |
|
China |
National Energy Storage Program; 14th Five-Year Plan – subsidies for graphite anode and recycling tech |
Global leader in battery-grade graphite; expanding spherical and coated graphite output; building capacity for domestic EV supply chains |
|
Australia |
Critical Minerals Strategy; A$2.5 B Future Battery Industries Fund |
Rapid growth in flake graphite mining and export; investments in battery material processing toward East Asia and Europe |
|
India |
PLI for Battery & Critical Minerals; National Program on Advanced Chemistry ₹3,000 cr incentives |
New graphite mines under production; processing plants in Odisha and Jharkhand supplying EV cell and energy storage markets |
|
Japan |
METI Critical Materials Subsidy; Innovation for Battery Materials Program |
Tier-one in synthetic graphite and purification exports; collaboration with automakers and energy storage OEMs |
|
South Korea |
Korea Battery Industry Revitalization Plan; Strategic Minerals Fund |
Producing coated and spherical graphite for major gigafactory projects; high-tech partnerships with global battery leaders |
|
Indonesia |
National EV Roadmap; fiscal incentives for battery materials projects |
New flake graphite mining concessions; growing imports for domestic battery cell and lubricants sectors |
|
Malaysia |
Industry4WRD & Green Technology Financing Scheme |
Rise in local graphite processing for electronics and energy storage; FDI stimulating spherical graphite refining |
|
Vietnam |
Strategy for Sustainable Industrial Development: incentives for EV ecosystem |
Developing graphite pelletizing and coating lines; joining EV supply chains through joint ventures with China and Japan |
|
Thailand |
Thailand 4.0 & Board of Investment (BOI) – critical mineral support |
Increase in downstream graphite applications; establishing spherical graphite finishing and export-focused facilities |
|
Rest of APAC |
ASEAN Critical Minerals Cooperation; regional funding initiatives |
Growing early-stage graphite roles in Philippines, Myanmar, Laos; many OEMs sourcing from China, Australia, and India |
Europe Market Insight
Europe is likely to account for approximately 20% of the global carbon graphite market revenue by 2034, led by technologically advanced and sustainable economies of Germany, France, and the Nordic countries. Lithium-ion anode material battery, fuel cells, refractories, and nuclear-grade graphite demand in the region is largely spurred by EU climate policy, green transition finance, and local battery supply chain development. Both the European Commission's SET-Plan and the Battery Alliance are key initiatives pushing regional investment for sustainable carbon graphite production, processing, and recycling.
Germany is also projected to be the market leader of Europe when it comes to carbon graphite, offering nearly 40% of the continent's income by 2034, driven by its dominance in manufacturing electric vehicles, chemicals production, and energy storage technology. The Federal Ministry of the Environment, Nature Conservation, Nuclear Safety and Consumer Protection (BMUV) spent over €1.3 billion in 2023 to deploy clean technology, most directly funding carbon graphite application in anodes of batteries and thermal-resistant uses in industry. German car and chemical corporations like BASF, BMW, and Siemens are increasingly investing in domestic graphite partnerships in an effort to promote decarbonization. Germany's importation of graphite (mainly from China, Madagascar, and Norway) is complemented by domestic purification as well as synthetic carbon graphite projects in the EU Battery Regulation.
France is expected to increase at a CAGR of 6.8% during the period 2025-2034 in the market for graphite under national initiatives to green the French chemical, automotive, and aerospace sectors. The Ministry of Ecological Transition (Ministère de la Transition Écologique) increased its green industrial activities budget by 16% between 2020 and 2024, which made the utilization of carbon graphite-based components in eco-efficient production systems possible. The main consumption of carbon graphite in France is due to battery manufacturing, thermal insulation, and high-performance composites. Over 1,000 French chemical producers are adopting green manufacturing lines, like carbon graphite-based anodes and refractories, to reach France's carbon-neutrality goals for 2050. Domestic businesses like Imerys Graphite & Carbon are putting investments in upstream supply chains and purification technology to comply with EU regulations on circular economies, further driving the evolution of graphite-based innovation for French industries.
Europe Carbon Graphite Market: Country‑Wise Breakdown (2034)
|
Country/Region |
Market Share (2034) |
Government Initiatives |
Notable Funding / Programs |
|
Germany |
22.5% |
Germany’s Raw Materials Strategy; Battery Materials Alliance |
€1.8 B allocated for local graphite anode processing plants and EV supply chain integration under IPCEI and KfW low-carbon funding |
|
France |
14.0% |
France 2030 Plan; Strategic Battery Program |
€1.0 B for synthetic/natural graphite production and purification facilities via Bpifrance and ADEME grants |
|
Italy |
10.5% |
Piano Nazionale Industria 4.0; National Critical Materials Roadmap |
€520 M dedicated to graphite material innovation, recycling, and advanced EV battery component initiatives |
|
Sweden |
8.7% |
Swedish Battery Strategy; Circular Economy Action Plan |
€370 M in funding for graphite extraction, refinery, and export-focused graphite-enhanced product development |
|
Austria |
8.0% |
Green Deal Implementation Plan; Austrian Critical Minerals Strategy |
€310 M in grants for graphite-based energy storage innovations and low-carbon synthetic graphite processing |
|
Finland |
6.0% |
Finnish Battery Act; Circular Economy Roadmap |
€240 M support for graphite mining, sustainable processing, and recycling through Business Finland and national innovation programs |
|
Poland |
5.8% |
Polish Energy Transformation Program; Raw Materials Strategy |
€200 M for graphite-centric battery ecosystem projects and Eastern European anode-grade graphite facilities |
|
Czech Republic |
4.5% |
National Material Security Initiative; Export Promotion Strategy |
€150 M in graphite material upgrades and downstream beneficiation technologies in industrial clusters |
|
Rest of Europe |
20.0% |
EU Critical Raw Materials Act; Horizon Europe; EIT RawMaterials |
Pan-European funding (~€3 B) for graphite supply chain diversification, R&D consortia, recycling innovation, and localized gigafactory supply chain development |
North America Market Insight
North America will take a huge chunk of about 15% from the global graphite market by 2034, driven mostly by the EV market growth rate, heavy clean energy storage investment, and government initiatives for developing domestic critical mineral supply chains. The United States and Canada are in an intense phase of ramping up cartridge production of battery-grade synthetic and natural carbon graphite, driven yet again by landmark legislation like the Inflation Reduction Act (IRA) coupled with federal funding from the U.S. DOE and DoD. These initiatives seek to reduce dependency on imports from China and position carbon graphite on the strategic map for lithium-ion battery anodes, fuel cells, and advanced composites.
Key Carbon Graphite Market Player:
- Company Overview
- Business Strategy
- Key Product Offerings
- Financial Performance
- Key Performance Indicators
- Risk Analysis
- Recent Development
- Regional Presence
- SWOT Analysis
The global carbon graphite chemical market is shaped by long-standing incumbents and nimble innovators. U.S. firms like GrafTech and NeoGraf leverage vertical integration and sustainable electrode technologies, while Japanese leaders (Tokai Carbon, Showa Denko, Nippon Carbon, Toyo Tanso) excel in high-purity synthetic graphite and R&D-backed portfolio expansion. European players (SGL Carbon, Mersen, Morgan) focus on specialty carbon graphite for batteries and industrial applications. India’s carbon graphite India and HEG are scaling production with export ambition. Australia’s Syrah and Canada’s Mason and Northern build resource-to-processing links. Common strategies include expanding battery-grade capacity, forming EV OEM partnerships, investing in cleaner production, and diversifying supply chains to reduce China dependency.
Top Global Manufacturers in the Global Carbon Graphite Market
|
Company Name |
Country of Origin |
Estimated Market Share (%) |
|
GrafTech International Ltd. |
USA |
14.5% |
|
Tokai Carbon Co., Ltd. |
Japan |
12.8% |
|
Showa Denko K.K. |
Japan |
11.7% |
|
SGL Carbon SE |
Germany |
9.4% |
|
Mersen SA |
France |
7.3% |
|
Graphite India Limited |
India |
5.6% |
|
HEG Limited |
India |
xx% |
|
Imerys Graphite & Carbon |
Switzerland |
xx% |
|
Syrah Resources Limited |
Australia |
xx% |
|
Mason Graphite Inc. |
Canada |
xx% |
|
Northern Graphite Corporation |
Canada |
xx% |
|
NeoGraf Solutions |
USA |
xx% |
|
Nippon Carbon Co., Ltd. |
Japan |
xx% |
|
Morgan Advanced Materials plc |
UK |
xx% |
Here are a few areas of focus covered in the competitive landscape of the market:
Recent Developments
- In June 2025, Bloomberg reported that the global carbon graphite market experienced a 15% growth in 2024, fueled by surging demand for battery-grade synthetic carbon graphite in electric vehicle (EV) production. Key manufacturers like GrafTech and Tokai Carbon announced expansions in their capacity to meet the booming lithium-ion battery anode market. However, rising raw material costs and geopolitical tensions in supply chains have pressured margins, prompting companies to invest in domestic graphite sourcing and recycling technologies.
- In May 2025, Reuters covered a landmark joint venture between Syrah Resources and a European battery manufacturer aimed at creating a vertically integrated supply chain for natural carbon graphite in North America and Europe. This collaboration targets reducing dependency on Chinese imports by developing carbon graphite processing plants that meet stringent environmental standards, aligning with the global shift toward sustainable battery materials and circular economy principles.
- Report ID: 7931
- Published Date: Jul 25, 2025
- Report Format: PDF, PPT
- Explore a preview of key market trends and insights
- Review sample data tables and segment breakdowns
- Experience the quality of our visual data representations
- Evaluate our report structure and research methodology
- Get a glimpse of competitive landscape analysis
- Understand how regional forecasts are presented
- Assess the depth of company profiling and benchmarking
- Preview how actionable insights can support your strategy
Explore real data and analysis
Frequently Asked Questions (FAQ)
About this Report
Connect with our Expert


Copyright @ 2026 Research Nester. All Rights Reserved.
