Carbon Filler Based Nanocomposite Market Outlook:
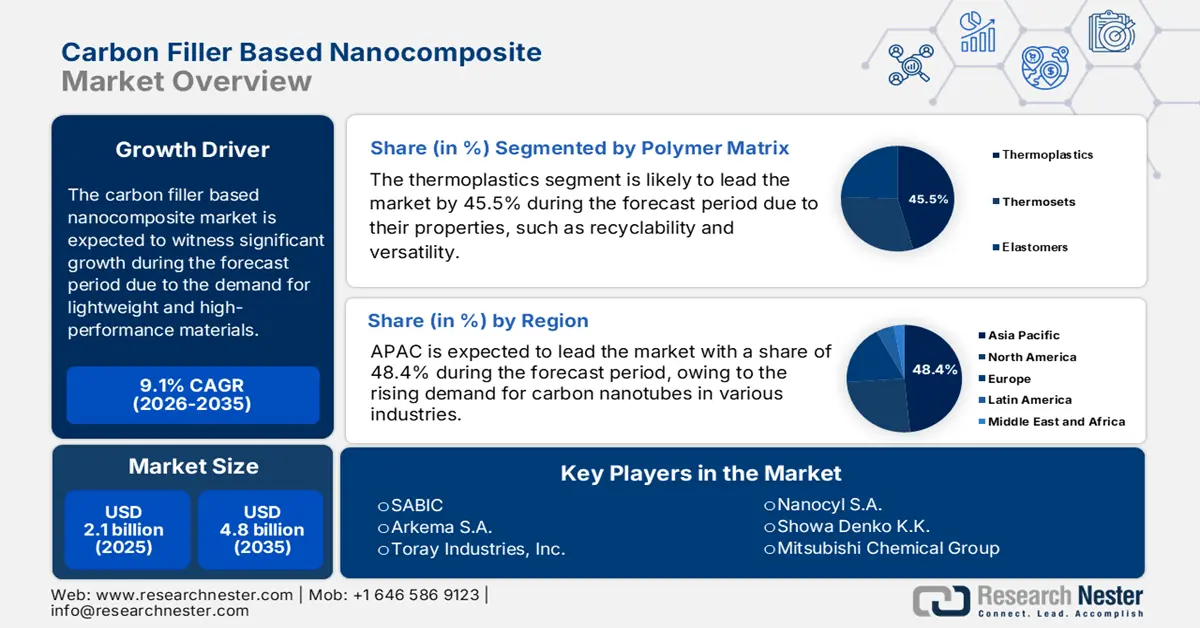
Carbon Filler Based Nanocomposite Market size was estimated at USD 2.1 billion in 2025 and is expected to surpass USD 4.8 billion by the end of 2035, rising at a CAGR of 9.1% during the forecast period, i.e., 2026-2035. In 2026, the industry size of carbon filler based nanocomposite is estimated at USD 2.2 billion.
The carbon filler based nanocomposite market is expanding and is driven by the demand for lightweight and high-performance materials to support the aerospace, automotive, and electronics sectors. As per the NLM report in August 2022, the nanotechnology market is booming and reached USD 125 billion by 2024, highlighting an expanding industrial application base for advanced nanomaterials. In this regard, the carbon filler-based nanocomposites are emerging as the key materials in improving various properties such as product durability, conductivity, and weight efficiency. Their fusion into automotive components, aerospace structures, and high-performance electronics aids both sustainability goals and cost efficiency.
The nanotechnology sector is expanding, and carbon filler-based nanocomposites have become a significant product to meet the properties such as lightweight and high-performance materials in electronics, aerospace, and automotive. According to NLM data in March 2021, the global composite market was projected to reach approximately USD 112.8 billion by 2025, with bio-based and advanced composites gaining prominence due to sustainability demands. Carbon filler nanocomposites improve the conductivity, durability, and weight efficiency that aligns with the cost reduction and sustainability.
Key Carbon Filler Based Nanocomposite Market Insights Summary:
Regional Highlights:
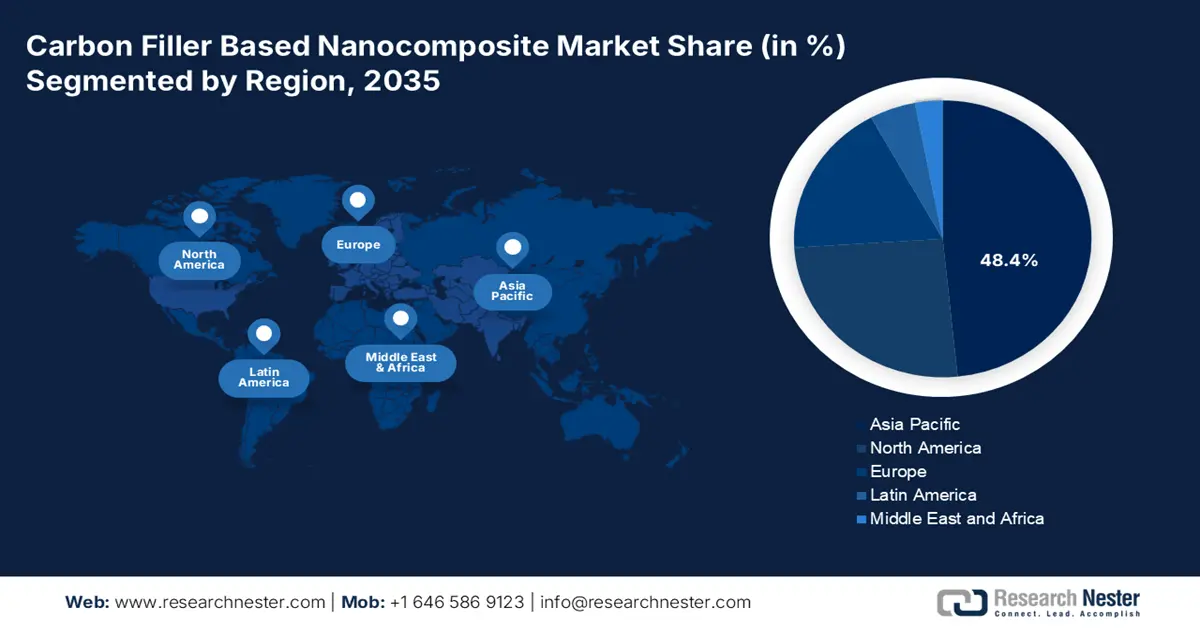
- Asia Pacific is projected to hold 48.4% share by 2035, driven by rising demand from automotive, electronics, energy, and construction sectors.
- North America is expected to maintain a strong presence, owing to aerospace & defense growth, automotive lightweighting, and robust R&D investments.
Segment Insights:
- Thermoplastics in the polymer matrix segment are projected to hold a 45.5% share by 2035, propelled by their processability, recyclability, and versatility across high-volume industries.
- Carbon nanotubes in the filler type segment are expected to dominate, owing to their mechanical strength, electrical conductivity, and widespread use in lithium-ion batteries.
Key Growth Trends:
- Lightweight material demand in automotive and aerospace
- Growth in electronics and conductive polymer markets
Major Challenges:
- Pricing pressures from alternative materials
- Social and occupational safety concerns
Key Players: Cabot Corporation, SABIC, Arkema S.A., Toray Industries, Inc., Nanocyl S.A., Showa Denko K.K., Mitsubishi Chemical Group, LG Chem, Hyperion Catalysis International, Continental Carbon Group, Huntsman Corporation, Zyvex Technologies, Thomas Swan & Co. Ltd., Haydale Graphene Industries, Nanoshel LLC, GRAFTECH International, Ad-Nano Technologies, Morsh, Graphite Malaysia Berhad, First Graphene Ltd.
Global Carbon Filler Based Nanocomposite Market Forecast and Regional Outlook:
Market Size & Growth Projections:
- 2025 Market Size: USD 2.1 billion
- 2026 Market Size: USD 2.2 billion
- Projected Market Size: USD4.8 billion by 2035
- Growth Forecasts: 9.1% CAGR (2026-2035)
Key Regional Dynamics:
- Largest Region: Asia Pacific (48.4% Share by 2035)
- Fastest Growing Region: Europe
- Dominating Countries: China, Japan, South Korea, United States, Germany
- Emerging Countries: India, France, Italy, Canada, Brazil
Last updated on : 16 October, 2025
Carbon Filler Based Nanocomposite Market - Growth Drivers and Challenges
Growth Drivers
- Lightweight material demand in automotive and aerospace: The automotive and aerospace industries worldwide are emphasizing lightweight, high-strength materials to improve fuel efficiency and reduce emissions. The NLM study in May 2023 depicts that the demand for high-performance, lightweight solutions has increased by the strategic shift to lower orbits, which is demonstrated by plans to deploy constellations of up to 42,000 satellites, highlighting the need for light weight and high-performance solutions. Carbon filler-based nanocomposites are the key component, offering a high tensile strength-to-weight ratio essential for reducing launch costs and enabling longer missions by minimizing the mass dedicated to propulsion systems.
- Growth in electronics and conductive polymer markets: The carbon filler based nanocomposites is expanding rapidly and are driven by the usage of electronic components and conductive polymers. These advanced materials are majorly being used in various applications such as flexible electronics, thermal management systems, and electromagnetic interference shielding. As the conductive polymer market grows, it is aided through the use of nanomaterials, which fuels the demand for advanced materials, such as carbon fillers, ie, carbon nanotubes and graphene.
- Improvement in mechanical property using carbon fillers: The carbon filler based nanocomposites, including PLA composites along with the carbon nanotubes, exhibit a significant improvement in the mechanical properties, according to a July 2021 study published in the Journal of Applied Polymer Science. The study has researched the PLA/CNT specimen with 6% fillers showed a tensile strength of 64.12% and a flexure strength increased by 24.29%, mainly attributed to a strong interfacial bonding. This underpins the efficiency of carbon fillers via bio-based polymers for advanced 3D printed products.
Aerospace Applications of Bio-Based Polymer Nanocomposites
|
Polymer |
Filler |
Application |
|
ULTEM 1000 |
Chopped Carbon Fiber |
Inlet guide vane |
|
PEEK |
Carbon Fiber |
Airfoil, rotor support arm |
|
PLA |
Carbon Fiber |
X-plan, a vertical take-off and landing UAV |
Source: Journal of Applied Polymer Science, 2021
Challenges
- Pricing pressures from alternative materials: Carbon nanocomposites costs high and are a major disadvantage when compared to traditional fillers such as talc, clay, or glass fibres. Traditional fillers can cost less while comparing with carbon-filled nanocomposites, depending on the filler. The automotive and aerospace industries restrict options to high-performance applications only, recognizing the cost-benefit trade-off. Hence, manufacturers prioritize carbon nanocomposites for critical components where performance is the ultimate concern, limiting widespread adoption in non-critical applications.
- Social and occupational safety concerns: Another main concern is to ensure worker health and safety concerning worker exposure to nanomaterials, which is the emerging pressure as occupational health and safety regulations will come into play. In the U.S., manufacturers using carbon nanotubes in commercial circumstances have the highest regulatory burden, forcing them to increase their mandatory ventilation, personal protective equipment (PPE), and dust containment protocols, thus increasing their operational overhead.
Carbon Filler Based Nanocomposite Market Size and Forecast:
| Report Attribute | Details |
|---|---|
|
Base Year |
2025 |
|
Forecast Year |
2026-2035 |
|
CAGR |
9.1% |
|
Base Year Market Size (2025) |
USD 2.1 billion |
|
Forecast Year Market Size (2035) |
USD 4.8 billion |
|
Regional Scope |
|
Carbon Filler Based Nanocomposite Market Segmentation:
Polymer Matrix Segment Analysis
In the polymer matrix segment, thermoplastics lead the segment and are poised to hold the share value of 45.5% by 2035. The segment is primarily driven by the unparalleled processability, recyclability, and versatility across high-volume industries. Further, thermoplastics can be reused, remelted, and reshaped, thus making it as ideal for injection molding and extrusion processes, which are used in the huge production of consumer electronics, automotive components, and other industrial parts. The compatibility of thermoplastics like polyamide (PA) and polypropylene (PP) with carbon fillers such as carbon black and carbon nanotubes to enhance strength, rigidity, and thermal stability further solidifies their leading market position for the foreseeable future.
Filler Type Segment Analysis
The carbon nanotubes are leading the filler type segment and are dominant due to their mechanical strength, electrical conductivity, and thermal properties. The main driver of the segment is the expanded use of lithium ion batteries as a conductive additive in anodes and cathodes. Further, the National Nanotechnology Initiative Supplement to the President’s 2025 Budget data states that federal investments in nanotechnology, including carbon nanotubes, reached over USD 900 million annual investment by NIH and contributions from FDA, CDC, NSF, DOE, and BARDA that are mainly focused on health, diagnostics, energy, and materials applications, including CNTs
Application Segment Analysis
In the application segment, electrical and electronics lead the segment and are driven by the insatiable demand for higher performance in consumer gadgets, flexible electronics, and efficient thermal management systems. The carbon nanotube composites are crucial for creating electromagnetic interference shielding. Further, the NLM study in January 2022 has researched and depicted that 4% carbon nanotube in polypropylene composites, when tested under alternating current at 10 kHz, the material’s electrical response to strain was 30% more sensitive than under DC. This highlights the strategic importance of carbon nanotubes in the electrical and electronic sectors.
Our in-depth analysis of the carbon filler based nanocomposite market includes the following segments:
|
Segment |
Subsegments |
|
Filler Type |
|
|
Polymer Matrix |
|
|
Application |
|

Vishnu Nair
Head - Global Business DevelopmentCustomize this report to your requirements — connect with our consultant for personalized insights and options.
Carbon Filler Based Nanocomposite Market - Regional Analysis
Asia Pacific Market Insights
Asia Pacific is the dominating region in the carbon filler based nanocomposite market and is expected to hold 48.4% of the market share by 2035. The market is driven due to rising demand from automotive, electronics, energy, and construction. Countries including China, Japan, and South Korea have led adoption driven by huge growth in environmental legislation and government investment in R&D. The robust demand from the electronics industry and implementation of stricter emission regulations in Southeast Asia is driving rising adoption, setting this region up to exceed a third of the global market by 2035.
China is largely driven by massive renewable energy adoption and policy-based industrial innovation. The Made in China 2025 industrial policy is likely to lead the world in funding R&D processes to promote green material products, including graphene-enhanced carbon filler-based nanocomposites. These materials are being prioritized for their role in lightweight structural components, thermal management systems, and energy storage devices. As per the USGS data in 2021, graphene, integrated into polymer matrices, which is being deployed to improve thermal conductivity and mechanical resilience in structural and electronic components, while spherical purified graphite processed from natural flake graphite through rounding, micronization, and purification to 99.95% purity serves as a critical anode material in lithium-ion batteries.
The carbon filler based nanocomposite market in Japan is defined by the high-tech automotive and electronics sectors, mainly focusing on performance and miniaturization. The government supports this via national projects. As per the New Energy and Industrial Technology Development Organization data in July 2022, nearly USD 350 million was allocated to industrial technology research and development, including nanotechnology. This strong investment in R&D has surged the adoption of carbon filler-based nanocomposites in various fields such as flexible electronics, sensors, and lightweight automotive components.
Imports of Natural and Synthetic Graphite in 2021
|
Country |
Natural (in thousands) |
Synthetic (in thousands) |
Total (in thousands) |
|
Japan |
3,040 |
6,290 |
9,330 |
|
China |
918 |
26,800 |
27,700 |
|
India |
1,770 |
4,000 |
5,770 |
Source: USGS 2021
North America Market Insights
The carbon filler based nanocomposite market in North America is led by the U.S. market, and the dominance is defined by the robust aerospace & defence sector, strong adoption in the automotive industry for light weighting, and substantial government and private R&D investments. The major drivers of the region are the stringent environmental regulations from the EPA, pushing fuel-efficient vehicles that increase the carbon nanocomposites for weight reduction. Further, leading market players and research institutions spur the innovation mainly in the high-performance applications in various fields.
The U.S. market is defined by the strong demand for the aerospace and electric vehicles sectors, which is driven by the requirement for advanced lightweight materials. The Department of Defence invests in nanocomposites for next-gen military and aircraft hardware due to their performance under extreme conditions. Similarly, carbon nanocomposites in batteries and electric vehicles are used to improve energy efficiency and meet federal emissions standards. As evidence, Cabot Corporation in January 2023 had planned to expand its conductive carbon additives production, which includes carbon nanotubes, at its Pampa, Texas facility via a USD 200 million investment, specifically targeting the EV battery sector, where conductive carbon additives are essential for ensuring high electrical conductivity in lithium-ion batteries.
Canada’s market is driven by the national clean technology and sustainable resource extraction goals. The primary trend of the market involves in applying graphene and carbon nanotube composites to create more durable and corrosion-resistant coatings in various fields to improve safety and extend asset life. On the other hand, Canada is moving towards sustainability goals and is committed to become a global leader in zero-emission vehicles. That’s the reason the government of Canada in October 2025 has stated that they are focused on achieving 100% zero-emission vehicle sales by 2035. This aim demands the EV market alternatively surges the use of carbon filler nanotubes.
Europe Market Insights
Europe market is expected to hold a considerable market share by 2035 due to growing polymer modification technology stems largely from demand in the automotive, aerospace, electronics, and energy industries. Supported by their Horizon Europe and the Green Deal initiatives, commercial deployment is heavily informed by new regulations that mandate sustainable operations and innovation in materials. This growth is further reinforced by increasing investment in research and development of carbon-based nanocomposites and lightweight polymer materials across key European countries.
Germany is dominating the Europe market because of its advanced industrial base, BMWK-supported strategies for emissions reductions in construction and transportation, and VCI-supported adoption in manufactured plastics for electric vehicles and wind energy applications. Additionally, the German government's Climate and Transformation Fund invested approximately EUR 6 billion annually to support climate-related initiatives, boosting R&D and commercialization in these sectors, based on Federal Ministry for Economic Cooperation and Development data in 2025. The EU's CO₂ emissions reduction targets and the progressive funding, research, and innovation capacity in Germany are likely to shorten the lag time to commercialization further, putting Germany ahead as a world leader.
The UK market is driven by the advancements in the aerospace and automotive sectors that are focusing on lightweighting and advanced electronics. The government support is channeled via research grants. UK Research and Innovation (UKRI) has allocated substantial funding to advanced materials to surge the supply chains for power electronics, electric machines, and drives, which heavily utilize carbon nanocomposites. This is complemented by collaborations between universities and industry to accelerate the commercialization of high-performance carbon nanocomposite technologies.
Key Carbon Filler Based Nanocomposite Market Player:
- Cabot Corporation
- Company Overview
- Business Strategy
- Key Product Offerings
- Financial Performance
- Key Performance Indicators
- Risk Analysis
- Recent Development
- Regional Presence
- SWOT Analysis
- SABIC
- Arkema S.A.
- Toray Industries, Inc.
- Nanocyl S.A.
- Showa Denko K.K.
- Mitsubishi Chemical Group
- LG Chem
- Hyperion Catalysis International
- Continental Carbon Group
- Huntsman Corporation
- Zyvex Technologies
- Thomas Swan & Co. Ltd.
- Haydale Graphene Industries
- Nanoshel LLC
- GRAFTECH International
- Ad-Nano Technologies
- Morsh
- Graphite Malaysia Berhad
- First Graphene Ltd.
The global carbon filler based nanocomposite market is very competitive and innovation drive. The market is defined by the presence of established chemical giants and agile specialized nano firms. Companies such as Cabot, Arkema, and Toray are utilizing vast R&D resources and global supply chains to lead the market. The main strategies include strategic partnerships with end users from various industries such as aerospace, electronics, and automotive to develop specific solution. Further the other strategies are heavy investment in production of carbon nanotubes with graphene. The trend is formulated with application ready composite system which offers customers a ready to go solution to meet the light weighting and conductivity requirements.
Below is the list of some prominent players operating in the carbon filler based nanocomposite market:
Recent Developments
- In September 2024, Cabot Corporation was selected for an award of USD 50 million from the U.S. Department of Energy to support domestic battery supply chain. This grant will support Cabot’s development of a new U.S. based manufacturing facility to produce battery grade carbon nanotubes and conductive additive dispersions at commercial scale.
- In June 2025, Concretene, has launched an innovative concrete admixture incorporating graphene oxide and graphene nanoplatelets, designed to enhance structural integrity while reducing cement usage.
- Report ID: 7786
- Published Date: Oct 16, 2025
- Report Format: PDF, PPT
- Explore a preview of key market trends and insights
- Review sample data tables and segment breakdowns
- Experience the quality of our visual data representations
- Evaluate our report structure and research methodology
- Get a glimpse of competitive landscape analysis
- Understand how regional forecasts are presented
- Assess the depth of company profiling and benchmarking
- Preview how actionable insights can support your strategy
Explore real data and analysis
Frequently Asked Questions (FAQ)
Free Sample includes current and historical market size, growth trends, regional charts & tables, company profiles, segment-wise forecasts, and more.
Connect with our Expert


Copyright @ 2026 Research Nester. All Rights Reserved.
