Polymers Market Outlook:
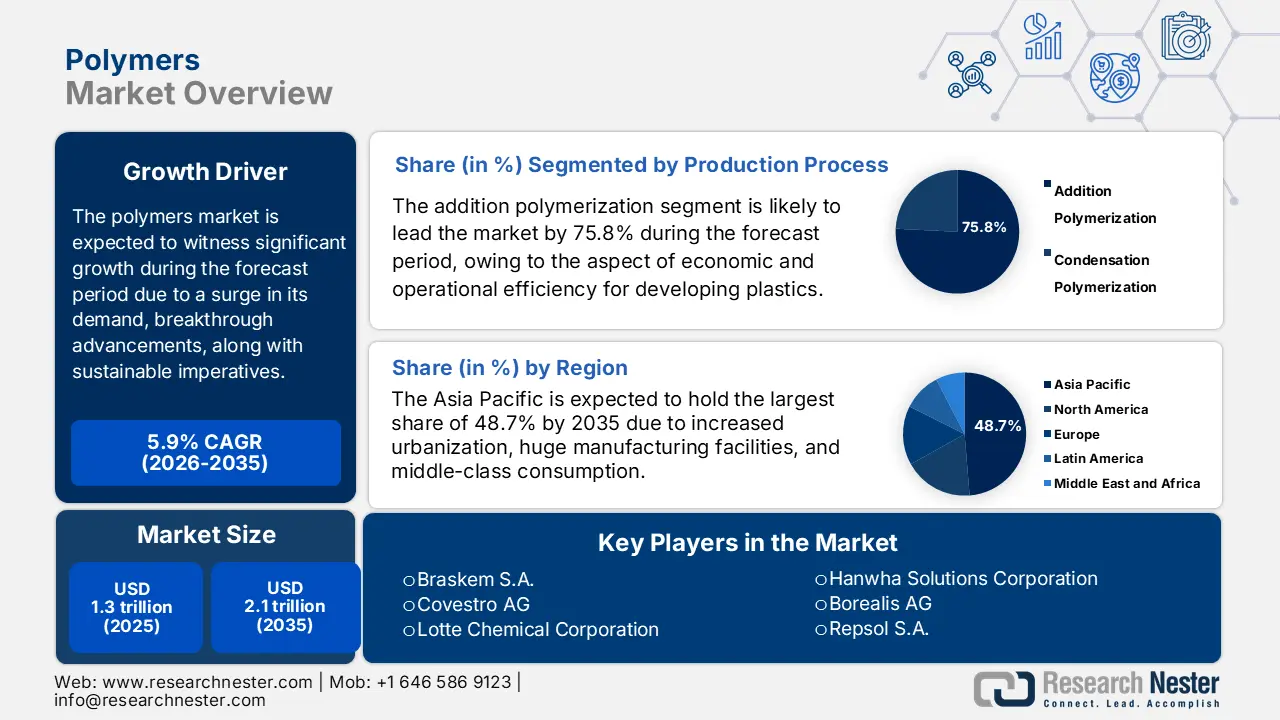
Polymers Market size was over USD 1.3 trillion in 2025 and is estimated to reach USD 2.1 trillion by the end of 2035, expanding at a CAGR of 5.9% during the forecast timeline, i.e., 2026-2035. In 2026, the industry size of polymers is evaluated at USD 1.4 trillion.
The worldwide polymers market is significantly navigating a period of profound evolution, moving beyond its conventional volume-based growth model. While the market’s demand from core industries, such as construction, automotive, and packaging, remains strong, the sector is being readily reshaped by strong external forces. This includes breakthrough innovations in material science, supply chain reconfiguration, and international sustainability imperatives. Besides, according to an article published by NLM in January 2025, the global advanced materials industry is valued at USD 500 billion as of 2023, and is expected to reach USD 700 billion by the end of 2028. This is readily compelling notable manufacturers to fundamentally rethink their own approaches by focusing on production scale, high-value innovation, and carbon neutrality, which is suitable for proliferating the overall polymers market.
Furthermore, the circular economy strategy, bio-based feedstocks gaining traction, electrification and light weighting, supply chain regionalization, along with artificial intelligence (AI) and digitalization in manufacturing, are other factors driving the polymers market globally. For instance, as per an article published by Hybrid Advances in December 2024, the worldwide AI software market is predicted to reach USD 126 billion by the end of 2025, denoting a 270% surge in enterprise adoption over the past 4 years. This particular technology possesses the ability to power 95% of consumer communications, with the overall field continuing to grow by an estimated 54% year-over-year (YoY), reaching USD 22.6 billion in size. Therefore, this plays a critical role in improving production efficiency, quality control, and predictive maintenance, resulting in cost-effective and smart manufacturing.
Key Polymers Market Insights Summary:
Regional Insights:
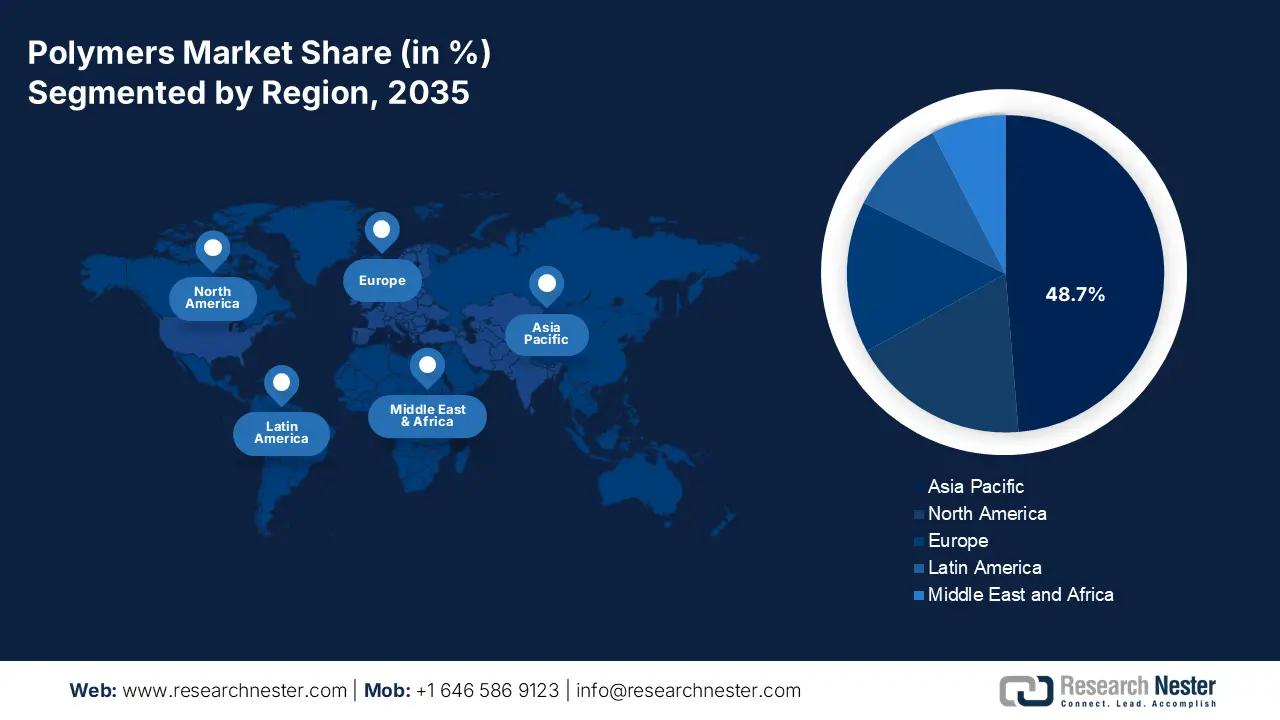
- The Asia Pacific region is set to hold a 48.7% share by 2035 in the polymers market, underpinned by expanding manufacturing capacity and rising consumption across automotive, construction, and packaging industries.
- Europe is expected to emerge as the fastest-growing region by 2035, supported by its transition toward a bio-based circular economy and stringent regulatory frameworks.
Segment Insights:
- The addition polymerization segment is projected to command a 75.8% share by 2035 in the polymers market, supported by its cost-effective scalability and operational efficiency in producing high-volume commodity thermoplastics.
- The thermoplastics sub-segment is anticipated to secure the second-largest share by 2035, bolstered by its recyclability, versatility, and durability across diverse end-use applications.
Key Growth Trends:
- Boom in flexible packaging and e-commerce
- Growing infrastructure and increased urbanization
Major Challenges:
- The regulatory pressure and sustainability imperative
- Economic and Technical Hurdles of Advanced Recycling
Key Players: Dow Inc. (U.S.), ExxonMobil Corporation (U.S.), SABIC (Saudi Arabia), INEOS Group Ltd. (U.K.), BASF SE (Germany), LG Chem Ltd. (South Korea), Formosa Plastics Corporation (Taiwan), Mitsubishi Chemical Group Corporation (Japan), Sumitomo Chemical Co., Ltd. (Japan), Reliance Industries Limited (India), Toray Industries, Inc. (Japan), Braskem S.A. (Brazil), Covestro AG (Germany), Lotte Chemical Corporation (South Korea), Shin-Etsu Chemical Co., Ltd. (Japan), Hanwha Solutions Corporation (South Korea), Borealis AG (Austria), Repsol S.A. (Spain), PTT Global Chemical Public Company Limited (Thailand).
Global Polymers Market Forecast and Regional Outlook:
Market Size & Growth Projections:
- 2025 Market Size: USD 1.3 trillion
- 2026 Market Size: USD 1.4 trillion
- Projected Market Size: USD 2.1 trillionby 2035
- Growth Forecasts: 5.9% CAGR (2026-2035)
Key Regional Dynamics:
- Largest Region: Asia Pacific (48.7% Share by 2035)
- Fastest Growing Region: Europe
- Dominating Countries: China, United States, Germany, Japan, India
- Emerging Countries: China, India, Brazil, Mexico, Indonesia
Last updated on : 27 November, 2025
Polymers Market - Growth Drivers and Challenges
Growth Drivers
- Boom in flexible packaging and e-commerce: The unyielding international development of e-commerce is continuing to uplift huge demand for lightweight, protective, and high-performance flexible packaging films, which has created an optimistic outlook for the polymers market globally. According to a data report published by the ITA in 2024, the worldwide e-commerce industry is projected to grow at 14.5% by the end of 2026, and it has been valued at USD 28.0 billion as of 2024. This denotes a huge growth opportunity for the overall market to ensure flexibility in packaging. In addition, currently the 2025 valuation stands at USD 32.1 billion, denoting a huge domination for polyolefins. Besides, the e-commerce sector is continuously growing in different regions, which is also fueling the market’s upliftment.
E-Commerce Growth Across Different Regions (2017-2025)
|
Year |
APAC |
North America |
Europe |
Total Valuation (USD Billion) |
|
2017 |
77.9% |
14.9% |
6.95 |
9.8 |
|
2018 |
78.0% |
15.0% |
6.8% |
11.3 |
|
2019 |
78.0% |
15.0% |
6.8% |
13.2 |
|
2020 |
78.1% |
15.0% |
6.6% |
14.8 |
|
2021 |
78.3% |
15.0% |
6.4% |
17.8 |
|
2022 |
78.6% |
14.8% |
6.2% |
21.0 |
|
2023 |
78.9% |
14.6% |
6.1% |
24.4 |
|
2024 |
79.3% |
14.2% |
6.0% |
28.0 |
|
2025 |
79.7% |
13.9% |
5.9% |
32.1 |
Source: ITA
- Growing infrastructure and increased urbanization: The aspect of significant private and public investments in the international infrastructure, particularly in the Asia-Pacific economy, is sustaining robust demand for polymers that are utilized in construction materials, insulation, and pipes. As per an article published by the EDA Government in 2025, the administrative body offered the Sustainable Polymers Tech Hub an estimated USD 51.0 million to develop the latest polymer lifecycle management workforce development program, along with upscaling bio-based butadiene production, with the intention of reshoring synthetic rubber supply chains on an international scale. Therefore, with this generous funding, the polymers market is significantly poised to experience growth in the upcoming years.
2023 Synthetic Rubber Export and Import
|
Countries/ Components |
Export (USD Billion) |
Import (USD Billion) |
|
Thailand |
2.7 |
1.1 |
|
South Korea |
2.6 |
- |
|
U.S. |
2.4 |
1.4 |
|
China |
- |
8.0 |
|
Global Trade Valuation |
25.9 |
|
|
Global Trade Share |
0.1% |
|
|
Product Complexity |
0.5 |
|
Source: OEC
- Advancements in healthcare and medical: An increase in the international population, along with heightened health consciousness, is also boosting the polymers market. This is readily driving continuous growth in the consumption of medical-grade and high-purity polymers for pharmaceuticals, packaging, and devices. As per an article published by the Journal of Cleaner Production in February 2023, the organic food sector has displayed a potential growth of more than 14.1%, and by the end of 2025, it is predicted to reach over USD 189.8 billion. Based on this, 76% of adults purchase organic food for health reasons, 33% are focused on environmental concerns, and 22% for mere availability. Therefore, the aspect of increased healthcare consciousness through organic food availability plays a major role in uplifting as well as expanding the overall polymers market across different nations.
Challenges
- The regulatory pressure and sustainability imperative: The polymers market is grappling with a challenge about the linear model of take-make-dispose, which is significantly under unprecedented scrutiny from consumers, investors, and regulators. Besides, governments are globally implementing strict policies, which include Extended Producer Responsibility (EPR) schemes that allow producers to be physically and financially responsible for the end-of-life management of their product, compulsory recycled content targets, and single-use plastic bans. For instance, Europe’s Single-Use Plastics Directive and familiar legislation in nations such as India and Canada are directly outlawing effective segments of the commodity plastics industry, which is negatively impacting the market’s growth.
- Economic and Technical Hurdles of Advanced Recycling: While mechanical recycling has been established for certain polymers, such as HDPE and PET, it comprises limitations regarding quality contamination, and degradation. The overall polymers market is therefore pinning its circular hopes on innovative recycling technologies, such as pyrolysis and depolymerization, which have the ability to break down plastics to their molecular building blocks. However, these particular technologies are facing significant challenges, which are causing a hindrance in the market’s growth. They are exceptionally demanding investments and capital-intensive for a single infrastructure, and are not yet proven at a completely profitable and international scale, thereby limiting the market’s growth.
Polymers Market Size and Forecast:
| Report Attribute | Details |
|---|---|
|
Base Year |
2025 |
|
Forecast Period |
2026-2035 |
|
CAGR |
5.9% |
|
Base Year Market Size (2025) |
USD 1.3 trillion |
|
Forecast Year Market Size (2035) |
USD 2.1 trillion |
|
Regional Scope |
|
Polymers Market Segmentation:
Production Process Segment Analysis
The addition polymerization segment, under the production process, is anticipated to hold the largest share of 75.8% by the end of 2035. The segment’s upliftment is highly attributed to its fundamental root in its operational and economic efficiency in creating the world’s most consumed plastics. This particular process comprises the sequential addition of monomer units without the need for by-product production. In this regard, this is considered the most primary method for manufacturing notable commodity thermoplastics, including polyvinyl chloride, polypropylene, and polyethylene. Besides, the aspect of cost-effectiveness and unparalleled scalability are the main drivers for the segment’s dominance in the polymers market. Moreover, the process provides outstanding control over the polymer every year, which has enabled high-volume production for applications, such as consumer goods and packaging.
Type Segment Analysis
The thermoplastics sub-segment, part of the type segment, is expected to cater to the second-largest share in the polymers market during the projected period. The segment’s growth is highly driven by its ability to be recycled, its cost-effectiveness, durability, and versatility. Additionally, it has the capability to be melted and reformed, making it a sustainable choice for a comprehensive range of applications, from regular packaging to components in aerospace. According to an article published by OECD in February 2022, the yearly plastic production has doubled, ranging from 234 million tons to 460 million tons. Besides, there has also been a surge in plastic waste from 156 million tons to 353 million tons. Meanwhile, when it comes to recycling, only 9% of plastic waste is recycled, 22% has been incinerated, and nearly 50% has been disposed of in sanitary landfills. Therefore, based on all these reasons, there is a huge demand for thermoplastics, which are easy to manufacture into different shapes.
Physical Form Segment Analysis
Based on the physical form, the pellets and granules segment in the polymers market is predicted to account for the third-largest share by the end of the forecast timeline. The segment’s development is highly fueled by its importance as a fundamental raw material in the plastic sector, serving as the most crucial building blocks for almost all plastic products utilized in modernized life. Moreover, its importance remains in the ease of processing, transport, and handling, all of which permit large-scale, precise, and efficient manufacturing of diversified products. Besides, as stated in the 2025 OEC data report, potato flakes, granules, and pellets account for USD 1.1 billion in global trade valuation, along with 0.005% as the global share. Furthermore, Germany is considered the top exporter, with USD 301 million in valuation, and the U.S. is the top importer, with USD 99.5 million in valuation as of 2023, thus denoting continuous supply across different nations.
Our in-depth analysis of the polymers market includes the following segments:
|
Segment |
Subsegments |
|
Production Process |
|
|
Type |
|
|
Physical Form |
|
|
Polymer Structure |
|
|
Application |
|
|
End use Industry |
|

Vishnu Nair
Head - Global Business DevelopmentCustomize this report to your requirements — connect with our consultant for personalized insights and options.
Polymers Market - Regional Analysis
APAC Market Insights
The Asia Pacific in the polymers market is anticipated to account for the largest share of 48.7% by the end of 2035. The market’s upliftment in the region is highly driven by its huge manufacturing facilities, rapid urbanization, and extended middle-class consumption, especially in the automotive, construction, and packaging industries. China is the ultimate volume leader, while the market in India and Southeast Asia is also experiencing growth. According to a data report published by the Asia Development Bank (ADB) in 2024, the Innovative Finance Facility for Climate in Asia and the Pacific (IF-CAP) has been unveiled, which has contributed towards the administration for delivering USD 100 billion in climate finance. In addition, the ADB has also provided USD 30.8 billion in climate financing from domestic resources. In this regard, the three-year average share operations supported climate action, which has reached 79%, further surpassing the 75% target, all of which are catering to sustainability in the region.
China in the polymers market is growing significantly, owing to its dominance anchored by its massive domestic market, tactical government policies, and complete manufacturing ecosystem. While conventional sectors, such as construction and packaging, continue to remain core drivers, the market’s growth in the country is increasingly bolstered by high-value applications in consumer electronics, renewable energy, and electric vehicles. As stated in the June 2023 ADB Organization article, the average recycling rate is estimated to be 27% of standard plastics, while recycling rates for each type of plastic result in 28% for polyethylene, 30% for polypropylene, 27% for polyvinyl chloride, 26% for polystyrene, and 26% for acrylonitrile-butadiene-styrene. Besides, the overall recycling rates, based on these 5 plastic commodities, differ for different applications, which is also driving the market’s demand.
Plastic Commodities’ Recycling Rates for Different Applications in China (2023)
|
Application Type |
Recycling Rate |
|
Agriculture |
48% |
|
Transportation |
42% |
|
Building and Construction |
31% |
|
Others |
26% |
|
Electronics |
20% |
|
Packaging |
12% |
|
Commodity |
12% |
Source: ADB Organization
India in the polymers market is also growing due to the Make in India campaign that bolstered the domestic manufacturing, a burgeoning consumer goods market, and rapid infrastructure development. In addition, the government’s Production-Linked Incentive (PLI) scheme for allied sectors, such as electronics, textiles, and automotive, is indirectly developing huge pull-forces for polymers. Besides, as stated in the November 2025 IBEF Organization article, the plastic sector in the country has over 2,500 exporters and employs 4 million people, along with constituting 30,000 processing units. Moreover, the country’s government has the intention to level up the industry from Rs. 3,00,000 crore (USD 37.8 billion) to Rs. 10,00,000 crore (USD 126 billion) within 4 to 5 years. Therefore, with such development, there is a massive growth opportunity for the polymers market in the country.
Europe Market Insights
Europe in the polymers market is expected to emerge as the fastest-growing region during the forecast duration. The market’s development in the region is highly propelled by the shift towards a bio-based and circular economy, which is driven by strict regulatory frameworks. Besides, the region’s demand is underpinned by the presence of a robust automotive sector, especially for light weighting in electric vehicles, construction sectors, and innovative packaging requirements. According to an article published by the Europe Commission in July 2022, the regulatory body invested more than €1.8 billion in 17 large-scale advanced clean-tech projects. These projects have been selected to ensure long-lasting developments, denoting the availability of capital expenses exceeding €7.5 million. Therefore, with such generous funding provision for green projects, there is a huge growth opportunity for the market in the region.
Germany in the polymers market is gaining increased traction, owing to the presence of a strong manufacturing base, especially in the machinery and automotive industries, demanding high-performance engineering plastics. The market’s growth in the country is also increasingly propelled by its tactical approach towards a circular economy, which is supported by robust industrial and governmental partnerships. Besides, as per a report published by Circular Economy Europe in November 2024, the gross domestic product (GDP) in Berlin grew by 53%, reaching EUR 165 million in valuation. In addition, the GDP per capita increased by 39%, resulting in EUR 43,839, along with a surge in the national trend by 30%, leading to EUR 33,54 to EUR 43,480 as of 2022. Therefore, with continuous growth in Berlin, the market in the country is poised for increased exposure.
Poland in the polymers market is developing due to the rapid extension in developing manufacturing centers that can benefit lower operating expenses and significant regional cohesion funds, which are aimed at modernizing the industry. Besides, the Polish Chamber of Chemical Industry (PIPC) proactively promotes the Polish Deal for the Chemical Sector by aligning with the regional Green Deal. For instance, as stated in the December 2022 Europe Commission article, the organization has implemented the country’s operational programmes with Territorial Just Transition Plans (TJTPs), and these are valued at over €3.8 billion under the Just Transition Fund (JTF). The purpose of this is to readily support climate transition in the coal regions, including Łódzkie, Lower Silesia, Wielkopolska, Małopolska, and Silesia, thus denoting an optimistic outlook for the overall market in the country.
North America Market Insights
North America in the polymers market is expected to witness an uplift steadily by the end of the stipulated timeline. The market’s growth in the region is highly driven by the aspects of strategic pivot, innovation, and maturity towards sustainability. In addition, the strong demand from the automotive, construction, and packaging sectors is also fueling the market in the overall region. According to a report published by the Department of Energy in October 2024, the U.S. Environmental Protection Agency (EPA) has estimated that 600 million tons of demolition and construction waste, along with 292 million tons of municipal solid waste, have been generated in the U.S. This has readily increased the potential for circularity, which is creating a positive impact on the regional market. However, the utilization of recycled materials is one of the most suitable options for maintaining the value of materials within the economy.
Waste Statistics for Commodity Materials in Municipal Solid Waste (2024)
|
Material |
Embodied Energy (MJ/kg) |
Million Tons Recycled/Landfilled/ Incinerated |
Energy Savings from Recycled Material |
|
Aluminum |
210 |
0.6/2.6/0.5 |
95% |
|
Steel |
26.5 |
6.3/10.5/2.3 |
60% to 80% |
|
Glass |
10.5 |
3.0/10.5/2.3 |
30% |
|
Paper and Cardboard |
35 |
45.9/17.2/4.2 |
40% |
|
Plastics |
100 |
3.0/26.9/5.6 |
33% |
Source: Department of Energy
The polymers market in the U.S. is gaining increased exposure, owing to advancements in energy and manufacturing, recycling and environmental sustainability, along with green chemistry and chemical safety. As per an article published by the U.S. Department of Energy in July 2025, the body declared an overall USD 137 million for small-scale businesses across 30 states, pertaining to prioritizing clean energy and nuclear nonproliferation. Moreover, the Advanced Manufacturing Office (AMO) also offers support to development projects and small business research that can optimize material productivity, drive industrial decarbonization and competitiveness, and enhance energy efficiency. This organization has selected 10 projects with a funding provision of USD 10.8 million, as well as USD 700,000 from other organizations, to make advancements in manufacturing technologies.
The polymers market in Canada is also developing due to the existence of bio-based feedstock benefits, administrative push for circularity, and generous funding provision by the government. For instance, in February 2024, the Minister of Tourism and the Minister of Public Services and Procurement contributed USD 1.0 million for BOSK Bioproducts Inc., which is a small and medium-sized enterprise in Quebec. Therefore, with this fund, the organization is poised to produce polyhydroxyalkanoate (PHA), which is a notable component of REGEN, and through its 100% composite solution, BOSK has the intention to significantly diminish plastic waste. Besides, as stated in the November 2025 ISED Canada article, the Net Zero Accelerator (NZA) initiative is projected to contribute to the country’s global leadership strategies by reducing greenhouse gas emissions by 40% to 45% by the end of 2030, along with gaining net zero by the end of 2050, both of which are positively impacting the polymers market.
Key Polymers Market Players:
- LyondellBasell Industries N.V. (Netherlands)
- Company Overview
- Business Strategy
- Key Product Offerings
- Financial Performance
- Key Performance Indicators
- Risk Analysis
- Recent Development
- Regional Presence
- SWOT Analysis
- Dow Inc. (U.S.)
- ExxonMobil Corporation (U.S.)
- SABIC (Saudi Arabia)
- INEOS Group Ltd. (U.K.)
- BASF SE (Germany)
- LG Chem Ltd. (South Korea)
- Formosa Plastics Corporation (Taiwan)
- Mitsubishi Chemical Group Corporation (Japan)
- Sumitomo Chemical Co., Ltd. (Japan)
- Reliance Industries Limited (India)
- Toray Industries, Inc. (Japan)
- Braskem S.A. (Brazil)
- Covestro AG (Germany)
- Lotte Chemical Corporation (South Korea)
- Shin-Etsu Chemical Co., Ltd. (Japan)
- Hanwha Solutions Corporation (South Korea)
- Borealis AG (Austria)
- Repsol S.A. (Spain)
- PTT Global Chemical Public Company Limited (Thailand)
- LyondellBasell Industries N.V. is considered an international leader in polyolefin production and technologies, and is one of the world’s largest producers of polypropylene and polyethylene. The organization is one of the major innovators in the circular economy and chemical recycling solutions through its Circulen portfolio. Therefore, as stated in its 2024 annual report, the organization generated USD 3.8 billion in operating cash, USD 1.8 billion in capital expenditures, and USD 1.9 billion in shareholder returns.
- Dow Inc. is regarded as a materials science titan, with a huge international footprint in polyethylene and ethylene, thus leveraging integrated production assets. The firm is strongly progressing its sustainability targets by introducing circular and renewable polymer grades to meet innovative consumer demands.
- ExxonMobil Corporation is one of the top global producers of polyethylene, and significantly leverages its upstream gas and oil integration to effectively maintain a competitive feedstock advantage. The organization is proactively upscaling its innovative recycling abilities and creating performance polymers for applications in flexible packaging. Besides, as per its 2024 annual report, the organization accounted for USD 34 billion in earnings, USD 55 billion in cash flow from operations, more than USD 12 billion in structural expenses, and 13.0% as return on capital employed.
- SABIC is a tactical international petrochemicals leader, well-known for its diversified portfolio of engineering and commodity thermoplastics. The firm is pioneering the shift to a circular carbon economy through generous investments in bio-based feedstocks and chemical recycling.
- INEOS Group Ltd. has developed into a major worldwide force in the polymers market through tactical acquisitions and a robust focus on polyolefins and olefins. The organization is extending its production capacity and investing in recycled technologies to effectively produce certified circular polymers.
Here is a list of key players operating in the global polymers market:
The international polymers market is a highly consolidated and increasingly competitive arena, and is also readily dominated by integrated chemical firms from Asia, the U.S., and Europe. The top 15 organizations collectively command an effective portion of the worldwide market share. Moreover, the market’s competition is primarily fueled by technological prowess, feedstock advantage, and economies of scale. Notable players, such as Dow and LyndellBasell, have made multibillion-dollar investments in innovative recycling technologies to create certified circular polymers. Besides, in April 2025, Kraton Corporation launched its latest CirKular+Paving Circularity Series, which has been engineered to cater to evolving paving sector demands to enhance the utilization of reclaimed asphalt and diminish greenhouse gas emissions. This particular series enables the incorporation of almost 50% of the asphalt content, while optimizing performance and processability, thus suitable for bolstering the polymers market globally.
Corporate Landscape of the Polymers Market:
Recent Developments
- In February 2025, Omya successfully completed the announced acquisition of Distrupol, intending to strengthen its pan-Europe presence and expand the international polymer distribution footprint with tactical acquisitions to cater to the increasingly evolving market.
- In September 2023, Graft Polymer significantly inked the newest research, supply, and development agreement, and successfully operate with its new partner, FORPET BALTIC, ensuring environment friendly and sustainable form of polyethylene terephthalate.
- In August 2022, Brilliant Polymers declared a large-scale capacity extension in the form of a cutting-edge plant in Maharashtra, which doubled its production capacity and displaying milestone in the continuous transformational growth journey.
- Report ID: 1387
- Published Date: Nov 27, 2025
- Report Format: PDF, PPT
- Explore a preview of key market trends and insights
- Review sample data tables and segment breakdowns
- Experience the quality of our visual data representations
- Evaluate our report structure and research methodology
- Get a glimpse of competitive landscape analysis
- Understand how regional forecasts are presented
- Assess the depth of company profiling and benchmarking
- Preview how actionable insights can support your strategy
Explore real data and analysis
Frequently Asked Questions (FAQ)
About this Report
Connect with our Expert

Report, 2026-2035


Copyright @ 2026 Research Nester. All Rights Reserved.
