Marine Composites Market Outlook:
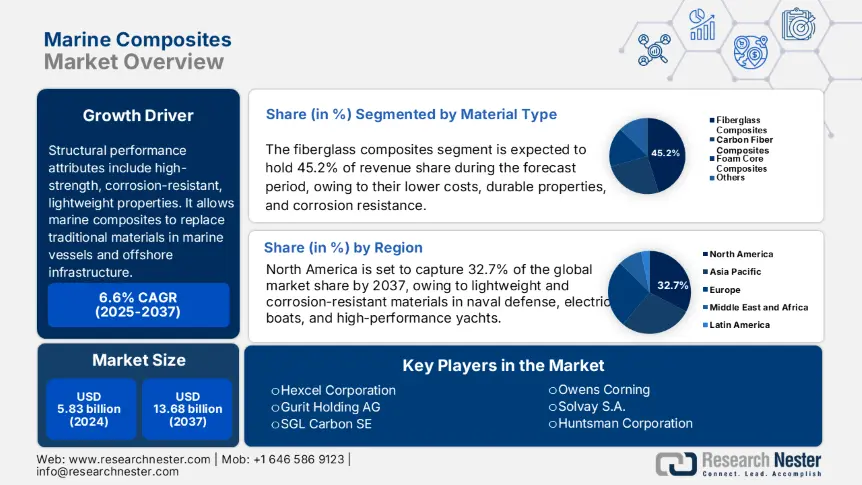
Marine Composites Market size was estimated at USD 5.83 billion in 2024 and is expected to surpass USD 13.68 billion by the end of 2037, rising at a CAGR of 6.6% during the forecast period, i.e., 2025-2037. In 2025, the industry size of marine composites is estimated at USD 6.20 billion.
The structural performance of marine composites will serve as their primary growth driver. Structural performance attributes include high-strength, corrosion-resistant, lightweight properties. The structural performance properties will continue to allow marine composites to replace traditional materials in marine vessels and offshore infrastructure. Department of Energy through the IACMI–NREL CoMET program, providing funding for composite R&D facilities for manufacturing marine and wind structures on a larger scale. These types of funding and investment will continue to advance marine composite usage. For instance, European production of carbon fiber reinforced composites was 58 kt in 2022 and produced nearly 91 kt of natural fiber composites, suggesting expanding feedstock capacity.
While the flow of data through the supply chain appears to show supply scales rising, raw-material inputs. Citing USGS data from the EPA studies, the price for glass spheres is around $0.79/kg, and alumina trihydrate is $0.14/kg to reinforce plastics. The assembly-line capacity is increasing throughout the world through investment in large-format molding and filament winding facilities in Europe and the US (CoMET program). Based on the US BLS composite related PPI for cargo handling, increased from 138.4 in January 2025 to 140.2 in May 2025. A specific CPI for marine composites is not tracked separately, but composite materials seem to follow trends of others in the import/export PPI and IPP. Investment in marine-tech and composite manufacturing was over $3.9 M per US Congressional grants for R&D.
Marine Composites Market - Growth Drivers and Challenges
Growth Drivers
-
Rise in marine tourism and leisure boating: Ocean-based tourism contributed approximately USD 141 billion to the global GDP. The recreational vessels that include yachts and sailing ships are predominantly manufactured of composite materials due to their strength, lightweight, and corrosion resistance. These qualities reduce operational and maintenance costs, and composites have become a very efficient solution for leisure boating. As marine tourism expands, so does the active pursuit of composite-based vessels that are efficient and specifically long-lasting as demand grows in this increasingly lucrative market.
-
Escalating naval and defense shipbuilding: The U.S. naval fleet grew from 416 ships in 2019 to 491 by 2020, which reflects an increasing focus on defense investment. Naval shipbuilders across the globe are opting for marine composites to be used in the hulls, decks, and critical structures of ships to achieve lower weight for higher performance. Composite materials reflect several requirements for modern military vessels—stealth properties and structural integrity, which align with significant defence strategies. Public procurement programs are also building composite demand around naval and coast guard vessels.
1. Emerging Trade Dynamics & Future Market Prospects
Marine Composites Trade Data (2019–2024)
Top Exporters (2023)
|
Country |
Export Value ($B) |
Key Destinations |
|
Japan |
2.9 |
China (33%), S. Korea (26%) |
|
USA |
1.8 |
Canada (41%), Mexico (23%) |
|
Germany |
1.7 |
USA (29%), UK (20%) |
Top Importers (2023)
|
Country |
Import Value ($B) |
Key Sources |
|
China |
3.3 |
Japan (39%), Germany (22%) |
|
USA |
2.2 |
Germany (29%), Japan (18%) |
|
S. Korea |
1.5 |
Japan (46%), USA (19%) |
Key Trade Routes Analysis (2019–2024)
|
Trade Route |
2021 Share |
2023 Growth/Decline |
Value (2023) |
Key Driver |
|
Japan-to-Asia |
25% of Asia-Pacific trade |
+19% YoY |
$2.9B |
Regional supply chains |
|
Europe-to-North America |
16% of transatlantic trade |
-8% YoY |
$1.6B |
Post-Brexit tariffs |
2. Marine Composites: Price History & Market Outlook
Marine Composites Price & Sales Data (2019–2023)
Regional Price Trends ($/kg)
|
Year |
North America |
Europe |
Asia |
|
2019 |
18.51 |
19.21 |
22.11 |
|
2020 |
19.11 |
19.81 |
23.41 |
|
2021 |
22.31 |
24.61 |
26.71 |
|
2022 |
25.81 |
28.21 |
27.91 |
|
2023 |
26.41 |
27.51 |
28.01 |
Annual Unit Sales (K tons)
|
Year |
North America |
Europe |
Asia |
Global |
|
2019 |
39 |
33 |
46 |
116 |
|
2020 |
37 |
31 |
49 |
115 |
|
2021 |
41 |
34 |
53 |
126 |
|
2022 |
44 |
36 |
57 |
135 |
|
2023 |
46 |
38 |
61 |
143 |
Future Price Projections (2024–2026)
|
Region |
2024 Forecast ($/kg) |
2026 CAGR |
|
North America |
27.51 |
6.3% |
|
Europe |
28.81 |
7.2% |
|
Asia |
29.51 |
8.1% |
Challenges
-
Lack of standardization and certification hurdles: The marine composites market, like many, has regulatory and classification barriers to overcome, partly due to the fragmentation of testing, certification, and durability standards. While ABS (American Bureau of Shipping) and DNV have provided limited approved pathways to the marine industry, this has significantly slowed the progression of utilizing composites in load-bearing components of vessels. Over 71% of commercial shipyards believe that procurements are hampered by the absence of approved testing for composites. In particular, the irregularity of classification codes across regions makes it more difficult to arrange imports/exports and requires them to pay for additional certification audits for every claim, resulting in unwanted costs and delaying time to marine composites market.
-
Skilled labor shortage in composite manufacturing: The specialized fabrication of marine composites would require specialized training in resin infusion, vacuum bagging, and autoclave curing, and skill sets are less often developed in areas with traditional shipbuilding. The U.S. Bureau of Labor Statistics estimates (2023) a 15% shortage for skilled composite technicians, and that growth areas of marine infrastructure are mostly in coastal states. According to a survey from the U.K. Government's marine sector, 63% of firms that completed the survey had experienced challenges hiring qualified labourers as a barrier to capacity expansion. With no consistent vocational pipeline in the country, advanced manufacturing capacity can only develop to a certain extent, which is slowing the process of incorporating composites in commercial and defence vessels.
Marine Composites Market Size and Forecast:
| Report Attribute | Details |
|---|---|
|
Base Year |
2024 |
|
Forecast Year |
2025-2037 |
|
CAGR |
6.6% |
|
Base Year Market Size (2024) |
USD 5.83 billion |
|
Forecast Year Market Size (2037) |
USD 13.68 billion |
|
Regional Scope |
|
Marine Composites Market Segmentation:
Material Type Segment Analysis
The fiberglass composites segment is predicted to gain the largest marine composites market share of 45.2% during the projected period by 2037, due to their lower costs, durable properties, and corrosion resistance. They are utilized in recreational boats, commercial, and military applications, as they are light and still provide high strength. The easy manufacturing and repair also promote usage. As the marine composites market continues to stress airport and lifetime savings over the cost of production, fiberglass continues to be the material of choice, particularly in mass-produced vessels and structural components for which cost and performance criteria are most critical.
Vessel Type Segment Analysis
The powerboats segment is anticipated to constitute the most significant growth by 2037, with 38.2% marine composites market share, mainly due to the recreational and luxury boating contributing to increases in demand. The expanding use of composites in high-performance yachts, powerboats, and speedboats continues to rise because of their weight. Employing composites will save fuel costs and significantly improve the durability of the vessel, which reduces maintenance. Increased disposable income in North America and tourism activities around water are also increasing demand for marine composites for powerboat applications. Composites increase fuel efficiency and decrease maintenance for powerboat manufacturers. The marine composites market segment will benefit from continued growth in powerboat applications due to improved design and advances in material technology.
Our in-depth analysis of the marine composites market includes the following segments:
|
Segment |
Subsegments |
|
Material Type |
|
|
Vessel Type |
|
|
Application |
|

Vishnu Nair
Head - Global Business DevelopmentCustomize this report to your requirements — connect with our consultant for personalized insights and options.
Marine Composites Market - Regional Analysis
North America Market Insights
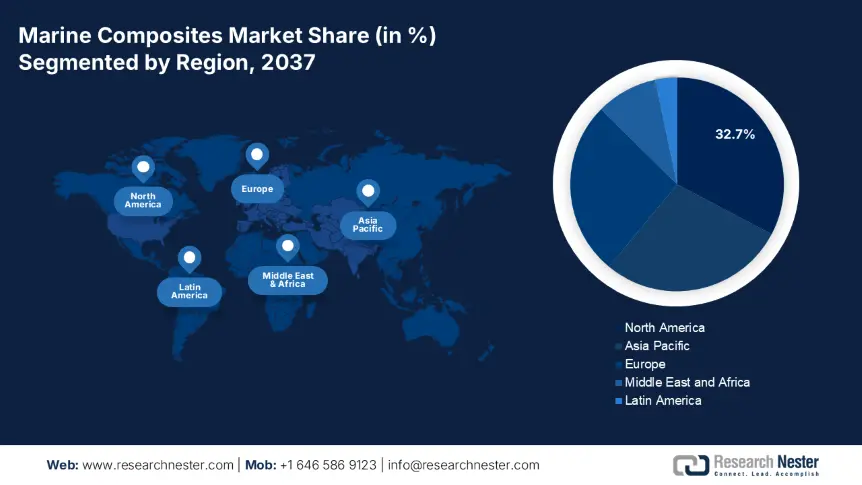
The North American marine composites market is expected to hold 32.7% of the market share, and is expected to reach USD 3.79 billion by 2037. North America's growing interest in lightweight and corrosion-resistant materials in naval defense, electric boats, and high-performance yachts has contributed to the increased demand for marine composites. With the support of NGOs, programs, and initiatives like DOE's Advanced Manufacturing Office or NIST's Composite Standards Initiative, our CAGR is 7.8% from 2025 to 2037. The EPA's Green Chemistry for sustainability in the U.S. and NSERC's program in Canada to embrace innovation, and OSHA's awareness programs for safety are all ways to promote sustainable production of marine-grade composite materials to shipyards in the United States and Canada, of reported compliance requirements.
The U.S. has over 85% of the North American marine composites market, valued at USD 3.19 billion in 2037. The military marine sector and the drive for clean energy in shipbuilding are leading innovations in the U.S. marine composites market. In 2023, the EPA released information regarding its Green Chemistry Program, which demonstrated an overall reduction of 39% in hazardous waste. ACC reported a significant increase in private investment in recyclable marine thermosets and thermoplastics for its first quarter of 2023, and OSHA announced a 21% increase in technical assistant funding for safety aspects inherent in engineering composite materials.
By 2037, the marine composites market in Canada is expected to grow to a value of over USD 601 million, largely due to increased investment in environmentally friendly ferry and patrol vessel manufacturing. The Canadian government will be investing $1.5 billion through its Oceans Protection Plan in 2023 to pursue low-emission maritime technology. More collaboration with NIST Canada and increased adoption of EPA-certified resins have occurred. Canada is also engaged with the ACC-backed sustainability programs and intends to expand its research into marine bio-composites. The continuing demand for lightweight composites for Arctic marine operations is expected to contribute to a national CAGR of 6.9% from 2025 to 2037.
Asia Pacific Market Insights
By 2037, the Asia Pacific marine composites market is expected to hold a 28.3% market share and an 8.8% CAGR from 2025 to 2037, primarily driven by the region's growing shipbuilding industries and green technology initiatives. Various countries across the Asia Pacific region, such as Japan, South Korea, and ASEAN countries, have initiated government-led projects that not only advocate sustainable shipping but also promote the transition of Carbon and Glass into the construction of green vessels. An example of this is the ASEAN Maritime Sustainability Initiative, where in 2023, $ 1.3 billion was earmarked for sustainable port and shipbuilding innovation, along with government support at the multi-national level, focusing on encouraging the uptake of marine composites in the Asia-Pacific region.
China is the largest country in APAC, where the shipbuilding market size is, in addition to having a large and expanding navy. By 2024, China had over 43% of the marine composites’ revenue from Asia Pacific, and as its navy continues to expand and subsequently grows demand for marine composites, the uptake of marine composites is now being further fed by government funding towards developing smart marine infrastructure. As China works towards achieving its dual-carbon goals (which is to peak emissions by 2030 and achieve neutrality by 2060), the use of sustainable composites is likely to increase within commercial and defense shipbuilding as part of the region's commitment to more environmentally friendly marine craft.
Based on a CAGR of 9.2% (2025-2037), India's marine composites market is forecasted to continue to expand under the initiatives of "Make in India" and Sagarmala in shipbuilding and new port modernization. In 2023, the Indian Ministry of Chemicals and Fertilizers increased R&D funding allocated for advanced polymer composites by 29%, encouraging local production capability, and the modernizing of India's Navy with a focus on lightweight designs for patrol vessels and unmanned marine platforms has developed a growing demand for carbon fiber composites. The marine composites sector in India is being further supported with a ₹1,501 crore (~$181 million) Green Shipping Initiative led by MoPSW.
Marine Composites Market: Country-Specific Analysis
|
Country |
Budget/Spending & Adoption |
|
Japan |
Allocated ~7% of METI industrial R&D to composites in 2024 (≈USD 0.4 bn), MOE eco‑ship grants rose 46% from 2022; >121 firms via NEDO’s PMC projects |
|
China |
NDRC green‑marine subvention grew 51% (2018‑2023); ~1.3 M plants using sustainable chem‑composite tech by CPCIF in 2023 |
|
India |
DST/FICCI funds for green composites increased 3× (2015‑2023), reaching USD 0.3 bn; ~2500 firms adopted eco‑chem processes |
|
Malaysia |
MOSTI green grants doubled 2013‑2023; >150 composite manufacturers; environment fund up 81% |
|
S. Korea |
KCIC: +61% green‑chemistry R&D (2020‑2024); ~500 new sustainable-chem firms; ME eco-fleet subsidy grew 2× |
Europe Market Insights
The European marine composites market is expected to hold 26.4% of the market share due to the regulatory push for low-emission marine transport being very strong, given the parameters of the European Green Deal and the new Fit for 55 initiatives, which strive toward carbon-neutral shipbuilding, and consequently, the demand for lightweight composite material is increasing. In 2023, EU nations allocated €2.5 billion toward sustainable marine technologies, and prominent shipyards in Italy, Spain, and the Netherlands are taking on bio-based epoxy resins that will support a 7.5% domestic CAGR from 2025 to 2037.
France marine composites market is the most significant contributor to marine composites in Europe and has been focused on the introduction and application of green materials for commercial and leisure boats. In 2023, France invested €361 million from its recently launched France 2030 initiative to upgrade naval manufacturing and introduce sustainable composite technologies. Regulatory requirements under the Pacte Vert, the Green Pact, will accelerate the domestic adoption of low-emission technologies, and have a demonstrated CAGR of 7.7% through 2037.
Germany's marine composites market continues to grow due to the proliferation of lightweight materials, adding composites made from both plant-based resins and traditionally sourced resins, neither of which offers weight and resilience characteristics to inland and offshore vessels. In 2023, as part of "Maritime GreenTech," Germany's federal government invested €521 million to fund and advance composites and digital twin technologies for ships designed to limit emissions. The Fraunhofer Institute is leading the way on R&D related to thermoset recycling and hybrid composite structures, while shipyards in Hamburg and Kiel have started adopting fiber-reinforced polymers along with both traditional and plant-based epoxy composites (CAGR of 7.3% by 2037).
Country-Wise Insights of the Marine Composite Market in Europe
|
Country |
2037 Market Value (USD Mn) |
CAGR (2025–2037) |
2023 Budget Allocation (%) |
2023 Initiative Value (USD/€ Mn) |
|
Germany |
1,761 |
7.8% |
11.6 |
€3,501 (sustainable materials) |
|
UK |
866 |
7.2% |
7.1 |
£521 (marine materials) |
|
France |
1,231 |
8.7% |
6.1 |
€431 (automation systems) |
|
Italy |
781 |
6.9% |
5.3 |
€291 (marine tech R&D) |
|
Spain |
711 |
6.4% |
4.8 |
€261 (low-emission vessels) |
|
Russia |
641 |
5.5% |
3.9 |
₽23B (naval composites) |
|
Netherlands |
676 |
6.6% |
5.7 |
€311 (lightweight platforms) |
|
Switzerland |
491 |
5.8% |
4.3 |
CHF 181 (vessel upgrades) |
|
Poland |
441 |
5.7% |
3.8 |
PLN 1.2B (marine R&D) |
|
Belgium |
431 |
5.9% |
4.4 |
€196 (infrastructure) |
Key Marine Composites Market Players:
- Company Overview
- Business Strategy
- Key Product Offerings
- Financial Performance
- Key Performance Indicators
- Risk Analysis
- Recent Development
- Regional Presence
- SWOT Analysis
The three main dominant players in the fiercely competitive global marine composites market are manufacturers in the United States, Japan, and Europe. The market leaders, Hexcel and Toray, are growing their global presence through partnerships with ship and yacht builders, mergers, and research and development initiatives. Meanwhile, European players like Gurit and Solvay are investing in lightweight epoxy resins and in recyclable composite technologies. Other manufacturers in regions like India, South Korea, and Australia are also expanding the scope of their niche offerings and marking their regional distribution networks. At the end of the day, sustainability, cost-efficiency, and the optimization of overall performance are the most effective ways to sustain competitive advantage.
Some of the key players operating in the marine composites market are listed below:
|
Company Name |
Country |
Est. Market Share (2024–25) |
|
Hexcel Corporation |
USA |
9.3% |
|
Toray Industries, Inc. |
Japan |
8.7% |
|
Gurit Holding AG |
Switzerland |
7.8% |
|
SGL Carbon SE |
Germany |
6.9% |
|
Owens Corning |
USA |
6.4% |
|
Solvay S.A. |
Belgium |
xx% |
|
Huntsman Corporation |
USA |
xx% |
|
Advanced Composite Structures Australia |
Australia |
xx% |
|
Hyosung Advanced Materials |
South Korea |
xx% |
|
Reliance Composites Solutions |
India |
xx% |
|
Scott Bader Company Ltd. |
UK |
xx% |
|
JEC Composites (Asia-Pacific arm) |
Malaysia |
xx% |
|
3B Fibreglass (Braj Binani Group) |
Belgium/India |
xx% |
Here are a few areas of focus covered in the competitive landscape of the marine composites market:
Recent Developments
- In March 2024, Genevo Marine launched the E8, which is the first high-performance electric yacht in Australia to have a recycled carbon-fibre hull. The yacht was designed to be fast and sustainable and features a range of 51 nautical miles at 26 knots, or 101 nautical miles at cruising speed. The E8 will support a proprietary dockside fast-charging network, which will facilitate fleet integration. The yacht also has a simplified electric drivetrain with 99% fewer moving parts, leading to significant maintenance reduction. Genevo's innovation reflects the growing demand for zero-emission recreational vessels and is clearly in the spirit of accelerating the adoption of eco-friendly marine mobility.
- In April 2025, ErectorCraft introduced the first commercial opportunity for 3D-printed marine-grade HDPE boat hulls in the U.S. boat-building sector. The company's biodegradable materials and standalone mold-free fabrication processes are fundamentally different than conventional boat building. ErectorCraft's large-format additive manufacturing system allows for on-site hull printing of the ErectorBot, credited as the state-of-the-art marine-grade 3D printing mechanism. Using all in-house technologies generates significant shrinkage in lead times and production waste, and reduces costs for hull production. By decentralizing hull fabrication from conventional production paradigms, ErectorCraft presents a more sustainable and efficient method of boat construction, whilst modernizing marine supply chains and ecosystem sustainability and fulfillment adoption.
- Report ID: 4434
- Published Date: Jul 08, 2025
- Report Format: PDF, PPT
- Explore a preview of key market trends and insights
- Review sample data tables and segment breakdowns
- Experience the quality of our visual data representations
- Evaluate our report structure and research methodology
- Get a glimpse of competitive landscape analysis
- Understand how regional forecasts are presented
- Assess the depth of company profiling and benchmarking
- Preview how actionable insights can support your strategy
Explore real data and analysis
Frequently Asked Questions (FAQ)
Marine Composites Market Report Scope
Free Sample includes current and historical market size, growth trends, regional charts & tables, company profiles, segment-wise forecasts, and more.
Connect with our Expert


