Smart Electric Toothbrush Market Outlook:
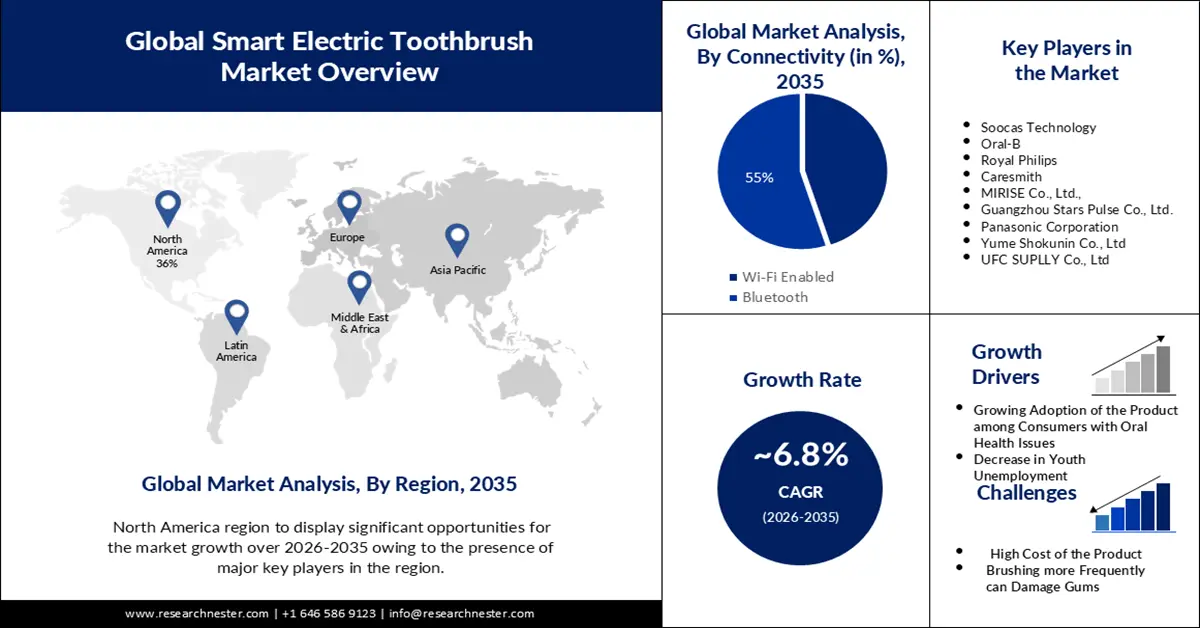
Smart Electric Toothbrush Market size was valued at USD 4.01 billion in 2025 and is set to exceed USD 7.74 billion by 2035, expanding at over 6.8% CAGR during the forecast period i.e., between 2026-2035. In the year 2026, the industry size of smart electric toothbrush is evaluated at USD 4.26 billion.
The increase can be attributed to a growing population and growing oral diseases globally. As per an estimation, around 15% of children and adolescents in the US were predicted to have oral health issues in 2020. This factor has led to a proliferation of electric toothbrushes around the world. Smart electric toothbrushes help to prevent tooth decay, maintain gum health, and preserve the teeth's strength.
The key market brands increasingly emphasize incorporating AI technology to draw more consumers, especially among tech enthusiasts. AI technology provides enhancement of the product for recording, monitoring, and tracking the health of the teeth, thus acting as an opportunity for market growth.