Smart Electric Toothbrush Market Regional Analysis:
North American Market Insights
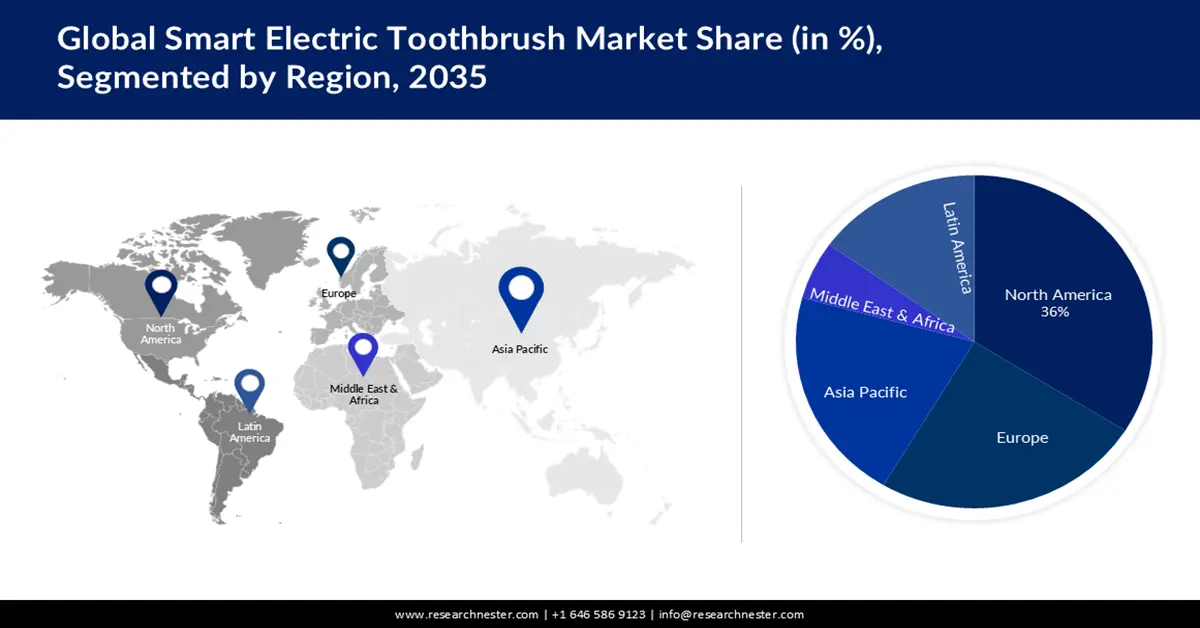
North America industry is poised to dominate majority revenue share of 36% by 2035. The market is growing in the region due to the presence of major key players. Further, key players are taking the initiative to add smart features to the toothbrush. Also, the growth of personal consumption expenditure among people of this region is estimated to have a significant impact in surging the sales for the product. Moreover, electric toothbrushes are used widely in the region which is also driving market growth. In 2020, 131.43 million Americans used electric toothbrushes, according to the report.
APAC Market Insights
The smart electric toothbrush market is expected to grow with a share of 26% during the forecast period. Also, it is expected that the Asia Pacific region will start to grow at a faster rate than other regions over the forecast period. The growth is also due to the increasing economic activity in regions like Indonesia. This is also to improve the purchasing and investment capacity of consumers, which are further estimated to increase demand for smart electric toothbrushes in this region. Also, increased cases of oral diseases are also growing the growth of the market in the region. According to the findings of a comprehensive survey carried out across India in 2020, over 17% of the respondents experienced tooth decay and cavities.