Wood Preservatives Market Overlook:
Wood Preservatives Market size was valued at USD 2.5 billion in 2025 and is projected to reach USD 4.1 billion by the end of 2035, rising at a CAGR of 5.3% during the forecast period, i.e., 2026-2035. In 2026, the industry size of wood preservatives is estimated at USD 2.6 billion.
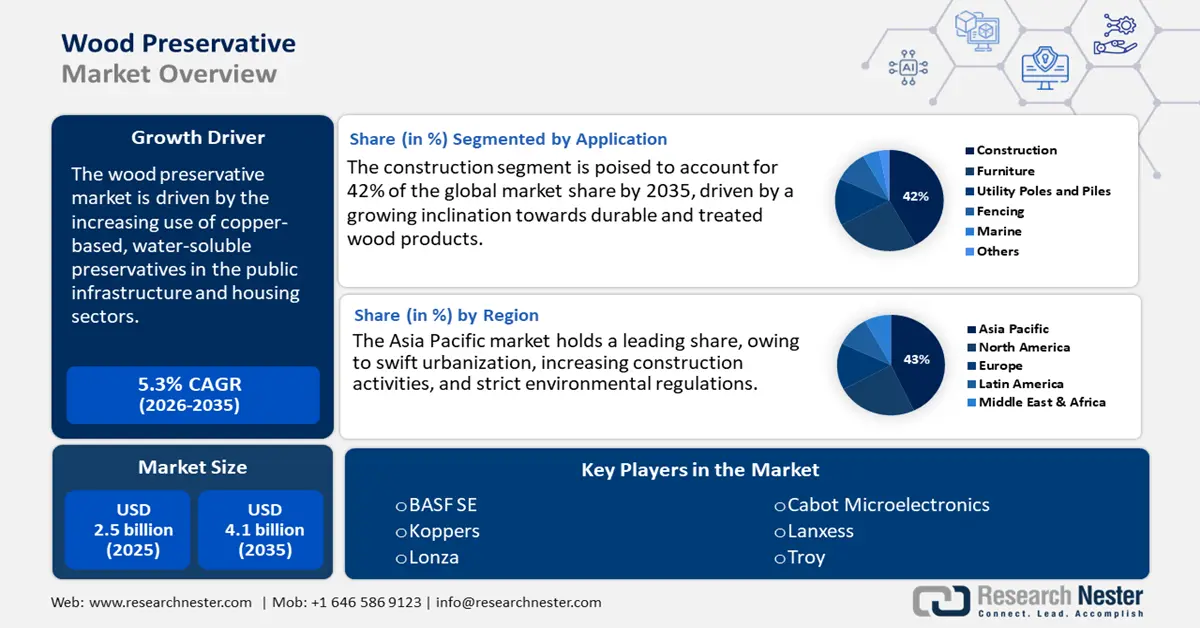
The main factor driving the growth of the market is the increasing use of copper-based, water-soluble preservatives in the public infrastructure and housing structures. This trend aligns with government-led environmental initiatives aimed at phasing out hazardous substances. For example, the U.S. Environmental Protection Agency (EPA) has intensified its compliance monitoring regarding the use of creosote and pentachlorophenol under the Federal Insecticide, Fungicide, and Rodenticide Act (FIFRA), thereby accelerating the transition to safer alternatives. Additionally, the U.S. Department of Agriculture’s Forest Service continues to support research and development into borate-based preservatives for fire resistance and fungal control through its Forest Products Lab initiatives. There is a significant increase in demand for wood across the housing and utility sectors. The Food and Agriculture Organization (FAO) in its 2024 report discloses that the worldwide wood production is at record levels, around 4 billion m³ per year. The same source also states that nearly 5.8 billion people around the globe use non-timber forest products (NTFPs), including 2.77 billion rural people in developing countries. This high use of wood and its products directly propels the consumption of wood preservatives.
Key Wood Preservatives Market Insights Summary:
Regional Highlights:
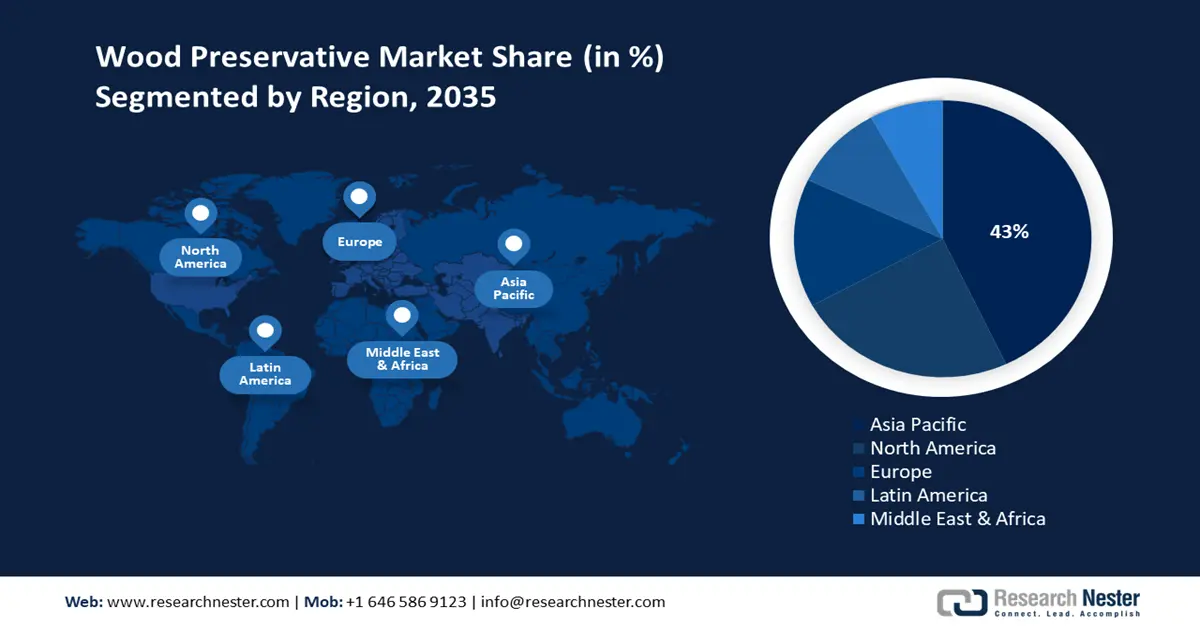
- Asia Pacific is anticipated to secure a 43% revenue share by 2035 in the wood preservatives market stemming from swift urbanization and rising demand for sustainable, long-lasting wood products.
- North America is projected to hold a 24% revenue share through the study period as a result of upgrading infrastructure and the transition toward environmentally friendly preservatives.
Segment Insights:
- The construction sector is anticipated to capture a 42% share of the wood preservatives market by 2035 supported by rapid urbanization and expanding infrastructure development.
- The pressure treatment segment is projected to account for a 37% share during the study period underpinned by the rising adoption of environmentally friendly copper-based preservatives.
Key Growth Trends:
- Shift toward green chemistry and safer alternatives
- Pricing trends in wood preservatives trade
Major Challenges:
- Raw material price volatility affecting pricing models
- Market access barriers and trade restrictions
Key Players: Lonza Group AG, Arch Wood Protection, Koppers Inc., Mitsui Chemicals, Inc., Jotun Group, Viance LLC (Hexion Inc.), Lanxess AG, Osaka Gas Chemicals Co., Ltd., Chemtura Corporation, DuluxGroup Limited, LG Chem, Tata Chemicals, Petronas Chemicals Group, AkzoNobel N.V.
Global Wood Preservatives Market Forecast and Regional Outlook:
Market Size & Growth Projections:
- 2025 Market Size: USD 7.41 billion
- 2026 Market Size: USD 7.78 billion
- Projected Market Size: USD 12.66 billion by 2035
- Growth Forecasts: 5.5% CAGR (2026-2035)
Key Regional Dynamics:
- Largest Region: Asia Pacific (43% Share by 2035)
- Fastest Growing Region: Europe
- Dominating Countries: United States, Germany, France, China, Japan
- Emerging Countries: China, India, Japan, South Korea, Thailand
Last updated on : 10 September, 2025
Wood Preservatives Market - Growth Drivers and Challenges
Growth Drivers
- Shift toward green chemistry and safer alternatives: The wood preservatives sector is quickly embracing green chemistry concepts, concentrating on low-toxicity options, including copper azole and borate-based solutions. Governments are investing heavily in green chemistry through research and innovation moves. In India, the green chemical manufacturing is gaining traction through initiatives such as Make in India and the Production-Linked Incentive (PLI) Scheme to boost domestic growth and attract private investments. The green alternatives significantly cut down on chemical leaching and lessen environmental damage, which enhances their popularity in both residential and commercial building projects. Further, the green chemicals are leading to considerable advancements in biocide-free wood treatment products and complying with stricter environmental regulations around the globe.
- Pricing trends in wood preservatives trade: The global wood preservatives market has undergone considerable transformation over the last few decades, shifting from conventional chemicals, such as creosote and chromated copper arsenate (CCA), to more sustainable alternatives, including copper azoles and borates. Unit sales volumes have consistently risen, propelled by an increasing demand in the construction, furniture, and infrastructure industries. Price trends have the potential to be influenced by various factors, including the costs of raw materials, changes in regulations, and geopolitical occurrences. Considering the prospects, the market is anticipated to maintain its growth trajectory, with a heightened focus on sustainable and eco-friendly preservatives. For example, the Federal Reserve Bank of St. Louis discloses that the producer price index for wood preservation stood at 270.016 in July 2025. The labor and energy costs, demand changes, and technological advancements drive the fluctuation in the PPI for wood preservation.
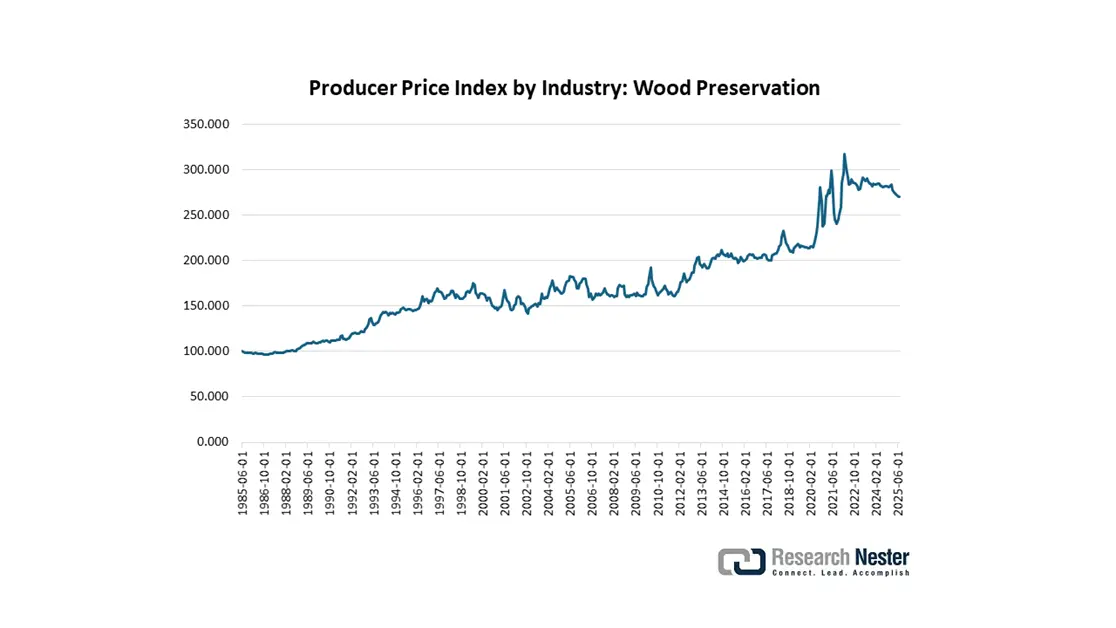
Source: Federal Reserve Bank of St. Louis
- Smart preservation technologies: Technological trends are likely to propel the production and commercialization of wood preservatives. The integration of advanced formulations with moisture sensors and antimicrobial coatings is set to enhance the characteristics of wood preservation chemicals. The growing consumer expectations for durability, sustainability, and smart functionality are opening lucrative doors for wood preservative companies. For instance, in May 2022, Archroma and the University of Goettingen launched a new eco-friendly wood protection technology called Siligen MIH liq that makes solid wood stronger and longer-lasting.
Challenges
- Raw material price volatility affecting pricing models: Global prices for raw materials used in wood preservatives have undergone considerable fluctuations. As per data from Trading Economics, the price of copper futures rose by USD 4.46 per pound in the last week of August 2025. The changes are driven by disruptions in the supply chain and geopolitical conflicts. The increase significantly boosts production expenses for copper-based preservatives such as copper azole. Smaller and medium-sized suppliers in the U.S. have found it difficult to manage these elevated costs, leading to reduced profit margins and difficulties in sustaining competitive pricing. The volatility in prices further complicates the establishment of long-term contracts and the overall stability of the market.
- Market access barriers and trade restrictions: The trade of wood preservatives encounters obstacles due to tariffs, varying regulations, and delays in certification. The evolving safety standards postpone the approval process for foreign wood preservatives by six months, resulting in supply chain disruptions and financial losses for exporters. Such regulatory hurdles impede market entry, elevate compliance expenses, and restrict growth prospects for suppliers. These trade restrictions also hinder the smooth flow of goods and pose significant obstacles to the growth of the international market.
Wood Preservatives Market Size and Forecast:
| Report Attribute | Details |
|---|---|
|
Base Year |
2025 |
|
Forecast Year |
2026-2035 |
|
CAGR |
5.3% |
|
Base Year Market Size (2025) |
USD 2.5 billion |
|
Forecast Year Market Size (2035) |
USD 4.1 billion |
|
Regional Scope |
|
Wood Preservatives Market Segmentation:
Application Segment Analysis
The construction sector, which includes both residential and commercial structures, is anticipated to capture 42% of the global market share by 2035. The increase in urbanization, the development of infrastructure, and a growing inclination towards durable and treated wood in construction are major factors driving this growth. Additionally, regulatory requirements that promote the use of treated wood to improve the durability and fire resistance of buildings also boost demand. The United Nations Economic and Social Commission for Asia and the Pacific (ESCAP) reveals that the urban population is expected to expand from 2.53 billion in 2023 to 3.5 billion by 2050. The expansion of emerging markets, especially within Asia Pacific, further encourages construction activities, consequently raising the need for wood preservatives.
Treatment Process Segment Analysis
The pressure treatment segment is projected to capture a 37% share of the global wood preservatives market throughout the study period. This pressure technique improves the durability of wood by injecting preservatives deep into the material, and is preferred for use in construction and infrastructure projects. The rising use of environmentally friendly copper-based preservatives, bolstered by regulations such as the EPA’s guidelines, is propelling this growth on a global scale.
Chemical Type Segment Analysis
The waterborne preservatives segment is anticipated to capture the largest share, owing to the increasing shift toward sustainability and regulatory compliance. Waterborne formulations release significantly fewer volatile organic compounds (VOCs), which makes them more popular among end users. North America and Europe lead the consumption of waterborne preservatives due to their strict environmental regulations and strong presence of early adopters. The rising urbanization and consumer preference for treated wood in outdoor living spaces is further estimated to fuel the sales of waterborne preservatives.
Our in-depth analysis of the market includes the following segments:
|
Segments |
Subsegments |
|
Application |
|
|
Treatment Process |
|
|
Chemical Type
|
|
|
End user |
|

Vishnu Nair
Head - Global Business DevelopmentCustomize this report to your requirements — connect with our consultant for personalized insights and options.
Wood Preservatives Market - Regional Analysis
Asia Pacific Market Insights
The Asia Pacific wood preservatives market is anticipated to account for 43% of the global revenue share through 2035. This growth is driven by swift urbanization, increasing construction activities, and strict environmental regulations, particularly in Japan, China, and South Korea. The rise in government investments in sustainable chemical technologies, along with the growing demand for long-lasting, eco-friendly wood products, bolsters this expansion. The emphasis on green chemistry and circular economy policies within the region fosters innovation in preservative formulations, thereby improving market penetration in both emerging and developed economies.
China is projected to maintain the largest revenue share in the APAC market by 2035, propelled by significant government backing for sustainable chemical sectors and infrastructure development. Efforts by the Ministry of Ecology and Environment, along with the National Development and Reform Commission (NDRC), advocate for environmentally friendly preservative technologies. The swift pace of urbanization, combined with rigorous environmental regulations, increases the demand for long-lasting and eco-friendly wood treatment options.
North America Market Insights
The North America wood preservatives market is projected to account for 24% of revenue share throughout the study period. This expansion is mainly driven by the upgrading of infrastructure and the enforcement of stringent environmental regulations. The demand for these products is further bolstered by heightened government investments in sustainable chemical technologies and initiatives aimed at green building. The transition towards environmentally friendly preservatives, along with the regulatory compliance mandated by organizations such as the EPA and OSHA, is driving the expansion of the market. Additionally, regional advancements in manufacturing processes contribute to the increased adoption of these products.
The growing focus on eco-friendly chemicals is likely to lead to new developments in wood preservatives in the U.S. The rise in construction projects is increasing the need for wood, which in turn boosts the use of preservatives to protect it. For example, in June 2025, the U.S. Census Bureau reported that construction spending reached about USD 2,136.2 billion per year, after seasonal adjustments. Additionally, advanced production technologies and hefty investments in big infrastructure projects are expected to increase sales of wood preservatives.
Europe Market Insights
The Europe wood preservatives market is expected to increase at the fastest CAGR from 2026 to 2035. This growth is propelled by rigorous environmental regulations imposed by the European Chemicals Agency (ECHA) and a rising demand for sustainable and non-toxic preservatives, particularly considering the increasing wood construction and infrastructure projects. The European Green Deal fosters innovation by offering substantial funding for environmentally friendly chemical solutions. Furthermore, initiatives aimed at industrial decarbonization and circular economy policies across various nations contribute to the expansion of the market. The demand for wood preservatives is in line with the growing use in both residential and commercial buildings to improve durability and adhere to more stringent fire and safety regulations.
Sales of wood preservatives in Germany are estimated to increase at a high pace, mainly due to the stringent environmental policies and a large construction base. The booming construction sector is also attracting several international investors. The Statistisches Bundesamt (Destatis) reports that nearly 24,500 dwellings were permitted in March 2023. The same source also discloses that the production in the construction industry is observing fluctuations based on country-level trends. Furthermore, the green building trend is also expected to contribute to the overall market growth in the coming years.
Key Wood Preservatives Market Players:
- BASF SE
- Company Overview
- Business Strategy
- Key Product Offerings
- Financial Performance
- Key Performance Indicators
- Risk Analysis
- Recent Development
- Regional Presence
- SWOT Analysis
- Lonza Group AG
- Arch Wood Protection
- Koppers Inc.
- Mitsui Chemicals, Inc.
- Jotun Group
- Viance LLC (Hexion Inc.)
- Lanxess AG
- Osaka Gas Chemicals Co., Ltd.
- Chemtura Corporation
- DuluxGroup Limited
- LG Chem
- Tata Chemicals
- Petronas Chemicals Group
- AkzoNobel N.V.
The global market for wood preservatives is intensely competitive, dominated by well-established multinational corporations that prioritize innovation, sustainability, and expansion into developing regions. Prominent companies such as BASF and Lonza make significant investments in green chemistry and cleaner production methods. Firms, including Arch Wood Protection and Koppers, focus on tailored solutions and penetrating regional markets. Strategic mergers, acquisitions, and investments in research and development propel product diversification and ensure compliance with regulations on a global scale. The table below provides a detailed list of the top manufacturers of wood preservatives, with their market shares.
Recent Developments
- In April 2025, Greentai announced the launch of LignoShield NanoFlameX, a new eco-friendly wood preservative. This solution also acts as a halogen-free flame retardant and is expected to set a high standard for environmental safety and fire protection in construction, furniture, and renewable energy industries.
- In March 2024, Arxada announced that its wood protection product, Tanasote S40, had been approved for use under the Great Britain Biocidal Product Regulation (BPR). With this approval, Tanasote is now available in 23 European countries.
- Report ID: 2893
- Published Date: Sep 10, 2025
- Report Format: PDF, PPT
- Explore a preview of key market trends and insights
- Review sample data tables and segment breakdowns
- Experience the quality of our visual data representations
- Evaluate our report structure and research methodology
- Get a glimpse of competitive landscape analysis
- Understand how regional forecasts are presented
- Assess the depth of company profiling and benchmarking
- Preview how actionable insights can support your strategy
Explore real data and analysis
Frequently Asked Questions (FAQ)
Wood Preservatives Market Report Scope
Free Sample includes current and historical market size, growth trends, regional charts & tables, company profiles, segment-wise forecasts, and more.
Connect with our Expert


Copyright @ 2026 Research Nester. All Rights Reserved.
