Visual Analytics Market Outlook:
Visual Analytics Market size was over USD 6.4 billion in 2025 and is anticipated to cross USD 18.34 billion by 2035, growing at more than 11.1% CAGR during the forecast period i.e., between 2026-2035. In the year 2026, the industry size of visual analytics is assessed at USD 7.04 billion.
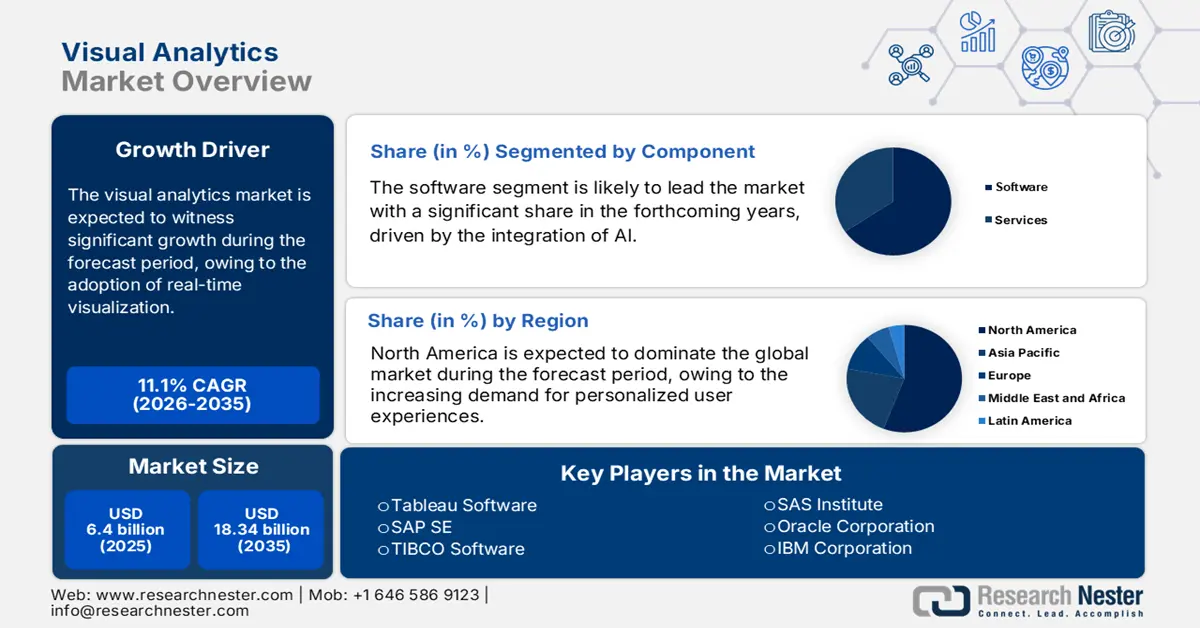
The visual analytics market is exhibiting exponential growth with the integration of ML and AI in analytics platforms, allowing automation and predictive insights. Following this trend, many companies are targeting acquisitions to enhance generative AI for applications. For instance, in January 2024, Qlik acquired Kyndi to improve analytics capabilities. This acquisition is aimed at processing data structures, enabling users to interact with analytics platforms through natural language terms while accessing precise context-aware results. Such developments are opening up immense opportunities for the visual analytics market.
The integration of AI models in visual analytics tools enables organizations to use predictive analytics for anticipatory trends, which assists in taking rapid business decisions. According to a report from the European Commission's Eurostat department, the AI technology deployment reached 13.48% among EU businesses in 2024, with large enterprises implementing it at 41.17%. The information and communication sector adopted AI as its primary industry application owing to its increasingly significant role in business optimization.
Key Visual Analytics Market Insights Summary:
Regional Highlights:
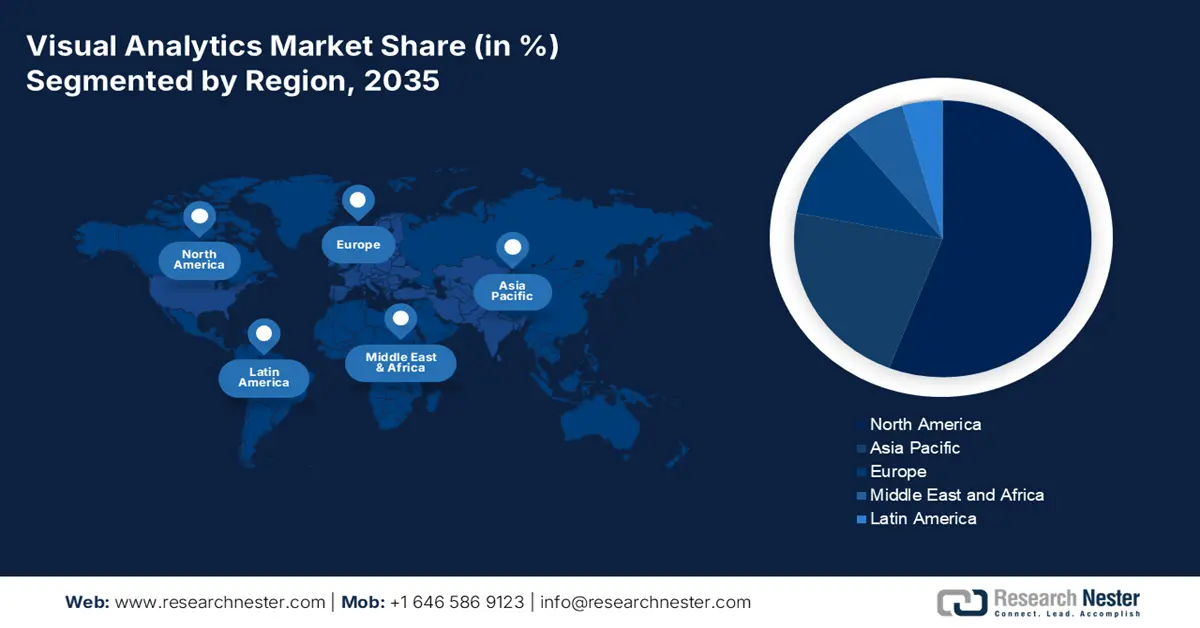
- North America is poised to secure a significant share of the Visual Analytics Market by 2035 as enterprises increasingly deploy advanced analytics platforms to strengthen personalized, data-driven user experiences, owing to accelerating adoption of cloud-based scenario-analysis capabilities.
- Asia Pacific is anticipated to capture a substantial share by 2035 as organizations intensify their focus on customer-centric insights through rapidly expanding visual analytics deployments, impelled by rising adoption of AI-driven behavioral visualization solutions.
Segment Insights:
- The BFSI segment is projected to command a significant share by 2035 in the Visual Analytics Market, propelled by the sector’s increasing reliance on real-time fraud detection and predictive credit-risk modeling.
- The software segment is expected to grow rapidly through 2026–2035, supported by escalating demand for embedded analytics that enable intuitive, workflow-centric decision environments.
Key Growth Trends:
- Adoption of real time data visualization
- Growth of self service analytics
Major Challenges:
- Scalability concerns
Key Players: Tableau Software, SAP SE, Qlik Technologies, TIBCO Software, ADVIZOR Solutions Pvt. Ltd, SAS Institute.
Global Visual Analytics Market Forecast and Regional Outlook:
Market Size & Growth Projections:
- 2025 Market Size: USD 6.4 billion
- 2026 Market Size: USD 7.04 billion
- Projected Market Size: USD 18.34 billion by 2035
- Growth Forecasts: 11.1%
Key Regional Dynamics:
- Largest Region: North America (Significant Share by 2035)
- Fastest Growing Region: Asia Pacific
- Dominating Countries: United States, China, Germany, United Kingdom, Japan
- Emerging Countries: India, South Korea, Brazil, Indonesia, Mexico
Last updated on : 19 November, 2025
Visual Analytics Market - Growth Drivers and Challenges
Growth Drivers
- Adoption of real-time data visualization: The demand for operational visibility in real-time settings is accelerating the demand for visual analytics tools that handle and present live data streams. Companies are introducing real-time data visualization solutions as these tools can make rapid decisions based on data input. In August 2024, Google Cloud introduced BigQuery continuous queries, enabling continuous SQL processing over data streams. This innovation allows businesses to analyze real-time data with AI-powered queries, streamlining processes such as reverse ETL and data pipelines. These updates improve the accuracy and speed of decision-making by delivering immediate insights. The technological development simplifies response time, which is propelling the visual analytics market.
- Growth of self-service analytics: Through self-service analytics platforms, visual tools are attaining significant accessibility, enabling users to create reports and modify dashboards at a fast pace, even when they lack technical experience. The leading visual analytics companies are rolling out platform developments that respond to the growing need for easier business intelligence solutions. For instance, in September 2024, Zoho released an updated version of its Analytics Suite, enhancing business intelligence, data management, and AI capabilities. Early access customers reported significant improvements in decision-making speed and productivity, particularly through AI-driven features. Businesses that focus on data accessibility through self-service visual analytics platforms enable fast decision-making ability and quick responses for dynamic visual analytics market situations.
Challenge
- Scalability concerns: The analytics platforms face major scalability issues when organizations acquire extensive data quantities. Complex large data sets create difficulties for certain platforms that struggle to gain optimal performance and quick processing speeds. The system's performance problems result in delayed numbers presentation, which slows down decision cycles and results in workplace inefficiencies. Real-time data visualization turns slower as a result, reducing the timeliness and accuracy of business decisions, which hinders market growth.
Visual Analytics Market Size and Forecast:
| Report Attribute | Details |
|---|---|
|
Base Year |
2025 |
|
Forecast Year |
2026-2035 |
|
CAGR |
11.1% |
|
Base Year Market Size (2025) |
USD 6.4 billion |
|
Forecast Year Market Size (2035) |
USD 18.34 billion |
|
Regional Scope |
|
Visual Analytics Market Segmentation:
End use Segment Analysis
The BFSI segment is expected to account for largest revenue visual analytics market share during the forecast period as the sector is increasingly utilizing visual analytics to detect fraud and assess credit risks in real-time while creating predictive models for their operational needs. The financial services industry is shifting towards modernized data systems that integrate analytics solutions with identity and fraud protection elements to improve their operational efficiency and organizational clarity. In March 2024, TransUnion introduced OneTru, an AI-powered data collaboration platform that consolidates analytics, identity management, and fraud detection within a single ecosystem. OneTru enables advanced visual analytics for real-time, risk-aware decisions. The innovation enables financial institutions to identify anomalies quickly and enhance credit evaluation procedures and risk management operations.
Component Segment Analysis
The software segment is likely to register rapid growth between 2026 and 2035. The requirement for embedded analytics in business applications is driving innovations by companies in visual analytics software development, resulting in more intuitive workflow-based decision systems. In August 2024, Salesforce launched Pulse for Salesforce, a purpose-built edition of Tableau Pulse that brings AI-powered insights directly into Salesforce CRM. Built on the Einstein 1 Platform, it delivers personalized, contextual metrics and real-time insights within users’ daily workflows. The platform offers sales teams the ability to actively detect patterns and irregularities, accelerating their response time and resulting in data-rich decision-making.
Our in-depth analysis of the global visual analytics market includes the following segments:
|
Component |
|
|
Deployment |
|
|
End use |
|
|
Intended Audience |
|

Vishnu Nair
Head - Global Business DevelopmentCustomize this report to your requirements — connect with our consultant for personalized insights and options.
Visual Analytics Market - Regional Analysis
North America Market Insights
North America is expected to account for largest revenue share during the forecast period, owing to the surging adoption of visual analytics solutions by companies to provide data-driven and personalized user experiences. Major companies are coming out with cloud platforms that optimize the management of large data sets. For instance, in December 2024, Amazon Web Services (AWS) expanded the capabilities of Amazon Q in QuickSight, announcing the public preview of scenario analysis. This new feature allows business users to quickly and effectively analyze data scenarios, making it easier for them to adapt to changing conditions and improve decision-making. The advancement delivers industry-leading tools for business intelligence and industrial innovation.
New business intelligence platforms featuring AI applications represent a major factor fueling the growth of the visual analytics market in the U.S. Increased adoption of AI-enhanced analytical platforms by local companies allows them to extract valuable time-sensitive decisions from major complex data collection systems. Technology leaders are coming up with the next-generation AI solutions to cater to a broad base of users. In March 2024, Salesforce unveiled Tableau Next, an AI-driven analytics platform that introduces autonomous agents capable of transforming complex datasets into actionable insights. These AI agents assist users in data exploration, visualization, and decision-making processes, thereby enhancing efficiency and accuracy in business operations. The country maintains its position as a major leader in future data-driven innovation as the new visual analytics tools are increasingly adopted by users.
APAC Market Insights
The Asia Pacific visual analytics market is expanding at a rapid pace as organizations prioritize delivering tailored customer experiences. There is a rising adoption of visual analytics platforms by local companies to understand their customers better, thus creating customized marketing solutions. Technological players are releasing new platforms to visualize user behaviors. For instance, in September 2024, Rakuten released Rakuten Analytics, a data analysis platform that applies AI to process CustomerDNA database information to sort user characteristics, including demographics, life choices, and shopping habits across 4,000 distinct categories.
The rapid expansion of data center infrastructure is stimulating the growth of the India visual analytics market due to the digital explosion and data localization initiatives. According to the 2024 report of the Investment Information and Credit Rating Agency of India Limited, data center operational capacity throughout India will exceed 2,000-2,100 MW by FY2027, with more than double of 950 MW in FY2024. This growth is attributed to the escalating need for data services, which primarily target e-commerce platforms, cloud computing and AI domains.
Visual Analytics Market Players:
- Tableau Software
- Company Overview
- Business Strategy
- Key Technology Offerings
- Financial Performance
- Key Performance Indicators
- Risk Analysis
- Recent Development
- Regional Presence
- SWOT Analysis
- SAP SE
- Qlik Technologies
- TIBCO Software
- ADVIZOR Solutions Pvt. Ltd.
- SAS Institute
- Oracle Corporation
- MicroStrategy
- IBM Corporation
- Alteryx, Inc.
The visual analytics market is highly competitive, with key players focusing on innovation, AI integration, and cloud-based solutions to strengthen their market position. Companies are investing heavily in research and development to enhance platform capabilities, improve user interfaces, and offer more intuitive and automated data visualization tools. Strategic collaborations, product launches, and the incorporation of generative AI and machine learning technologies are becoming common tactics to capture market share. This evolving landscape is fostering rapid technological advancement and intensified competition across sectors. Here are some key players operating in the global visual analytics market:
Recent Developments
- In October 2024, Oracle introduced Oracle Analytics Intelligence for Life Sciences, an AI-driven platform designed to unify data and accelerate insights in the healthcare sector. Powered by Oracle Cloud Infrastructure and Health Data Intelligence, it supports multidisciplinary research and enhances decision-making with pre-built analytics and real-world data integration.
- In June 2024, TIBCO released EBX 6.2, enhancing enterprise data management with features such as automatic metadata harvesting, a next-generation customizable UI, improved data visualization, embedded scripting, streamlined APIs, and advanced permissions.
- Report ID: 688
- Published Date: Nov 19, 2025
- Report Format: PDF, PPT
- Explore a preview of key market trends and insights
- Review sample data tables and segment breakdowns
- Experience the quality of our visual data representations
- Evaluate our report structure and research methodology
- Get a glimpse of competitive landscape analysis
- Understand how regional forecasts are presented
- Assess the depth of company profiling and benchmarking
- Preview how actionable insights can support your strategy
Explore real data and analysis
Frequently Asked Questions (FAQ)
Visual Analytics Market Report Scope
Free Sample includes current and historical market size, growth trends, regional charts & tables, company profiles, segment-wise forecasts, and more.
Connect with our Expert


Copyright @ 2026 Research Nester. All Rights Reserved.
