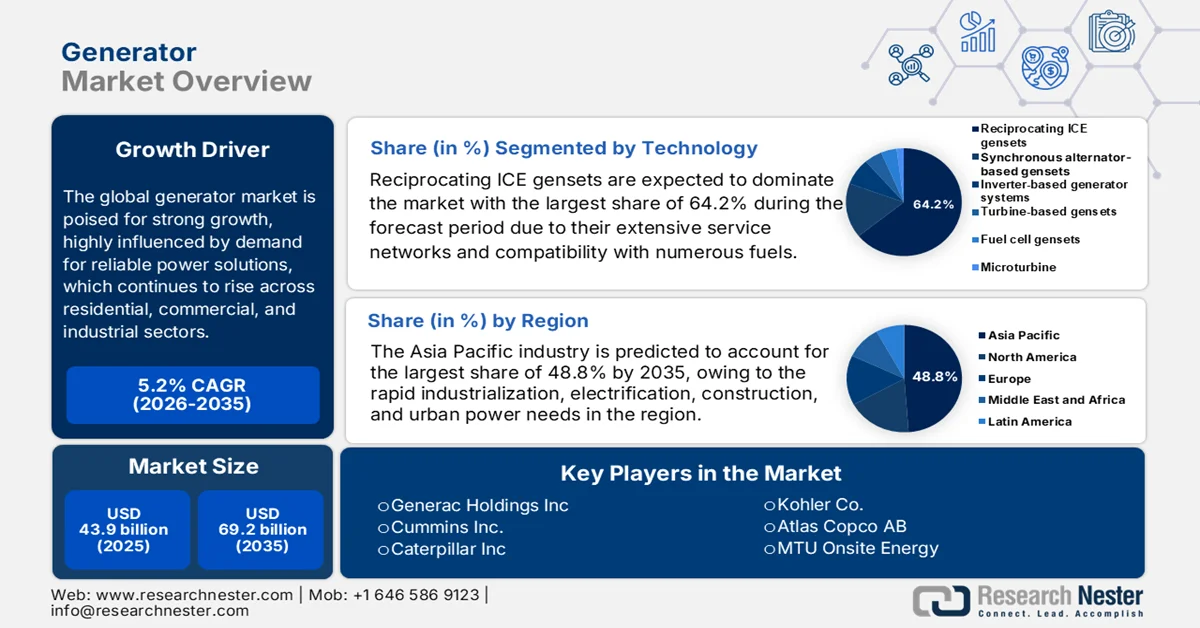
The global generator market is all set to witness strong growth, highly influenced by demand for power solutions, which is rising across residential, commercial, and industrial sectors. Increasing power outages and the need for a continued electricity supply are also facilitating revenue in this sector. The U.S. Energy Information Administration in January 2024 reported that in 2022, U.S. electricity customers faced an average of 5.6 hours of power interruptions. It also mentioned that Florida had the longest average outage at 19.1 hours, whereas the District of Columbia had the shortest at just 34 minutes. Moreover, Alaska is reported to be leading this with 3.5 interruptions per customer, when compared to the U.S. average of 1.4 outages. Therefore, this indicates that there is a strong need for backup and standby power solutions, providing encouraging opportunities for generator deployment.
Furthermore, to address these power outages, governments across major nations are placing growing emphasis on energy security and backup power solutions, which is fueling adoption in the market. In this context, the U.S. Department of Energy’s Grid Resilience and Innovation Partnerships (GRIP) Program, which was launched in November 2022, is a USD 10.5 billion initiative to strengthen grid flexibility and reliability against extreme weather. As of December 2024, a total of USD 7.6 billion has been awarded for 105 projects across all 50 states and D.C., including USD 600 million to support communities impacted by Hurricanes Helene and Milton. It also mentioned that the program’s three funding mechanisms include USD 2.5 billion for Grid Resilience Utility and Industry Grants, USD 3 billion for Smart Grid Grants, and USD 5 billion for the Grid Innovation Program, hence directly impacting the need for backup and distributed power solutions.
Key Generator Market Insights Summary:
Regional Highlights:
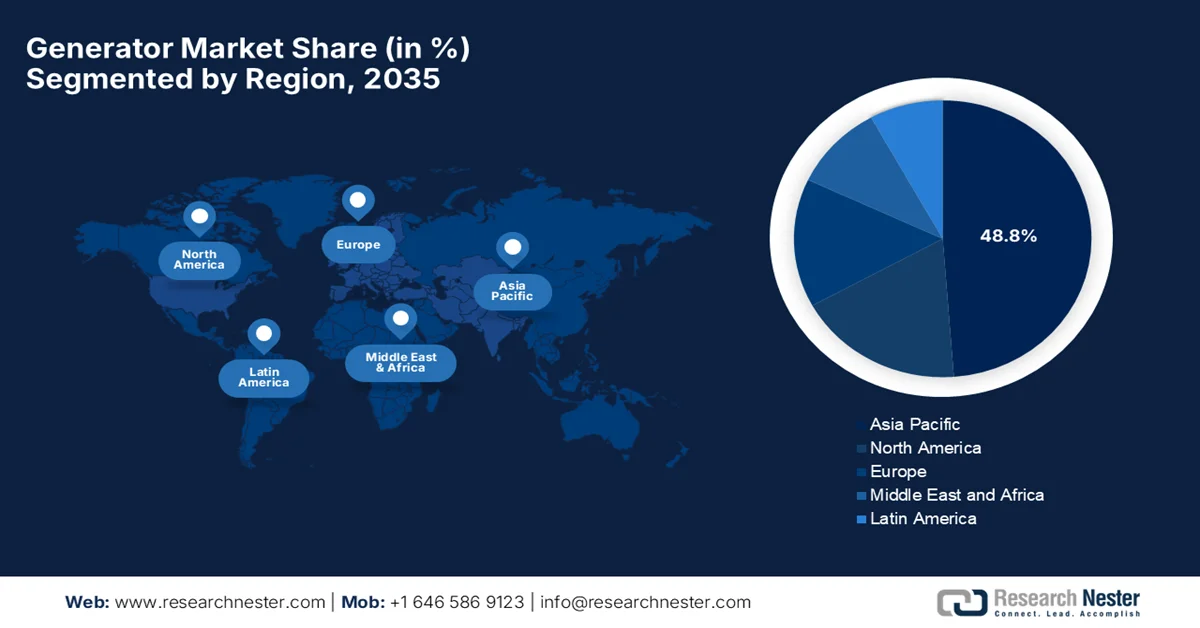
- Asia Pacific generator market is projected to account for a 48.8% revenue share by 2035, impelled by rapid industrialization, electrification, construction expansion, and rising urban power demand.
- North America is anticipated to witness steady expansion in the market through 2035, attributed to increasing emphasis on power continuity and resilient backup infrastructure amid widespread outage incidents.
Segment Insights:
- Reciprocating internal combustion engine generator sets subtype is projected to command a 64.2% share of the generator market by 2035, propelled by extensive service networks and compatibility with a variety of fuels including biobased diesel and HVO.
- Diesel segment is anticipated to witness considerable growth by 2035, driven by fuel availability, transportability, and reliability during grid outages in rapidly urbanizing regions.
Key Growth Trends:
- Rapid industrialization and infrastructure development
- Urbanization & increased electricity consumption
Major Challenges:
- Stringent emission norms and environmental regulations
- Supply chain and production disruptions
Key Players: Generac Power Systems, American Honda Motor Corp., Caterpillar Inc., Cummins Inc., Ingersoll Rand, John Deere, HiPower Systems, Kohler – SDMO, Wacker Neuson.
Global Generator Market Forecast and Regional Outlook:
Market Size & Growth Projections:
- 2025 Market Size: USD 43.9 billion
- 2026 Market Size: USD 46.1 billion
- Projected Market Size: USD 69.2 billion by 2035
- Growth Forecasts: 5.2% CAGR (2026-2035)
Key Regional Dynamics:
- Largest Region: Asia Pacific (48.8% Share by 2035)
- Fastest Growing Region: North America
- Dominating Countries: United States, China, Germany, Japan, India
- Emerging Countries: Brazil, Mexico, Indonesia, Vietnam, Saudi Arabia
Last updated on : 16 February, 2026
Generator Market - Growth Drivers and Challenges
Growth Drivers
- Rapid industrialization and infrastructure development: The ongoing infrastructure growth, which includes the construction of roads, airports, industrial parks, and smart city projects, efficiently drives generator demand for onsite power. Besides, often the industrial facilities use generators for continuous operations in manufacturing, oil & gas, mining, and construction sectors. As stated by the Ministry of Commerce & Industry in August 2024, the National Industrial Corridor Development Programme, which was approved in 2024 with a total investment of ₹28,602 crore (USD 3.5 billion), aims to develop 12 new industrial smart cities across India by promoting advanced infrastructure, multi-modal connectivity, and sustainable industrial operations. Such initiatives by the governments will boost demand in the generator market for on-site electricity during construction and early operations, as the sites mostly lack reliable grid power initially or need backup power during phased development.
- Urbanization & increased electricity consumption: Growth in terms of urban populations and expanding commercial complexes such as offices, malls, and residential towers elevates power consumption, and thereby the need for backup power systems also rises at the highest pace. According to the U.S. Energy Information Administration report, which was published in May 2025, the U.S. electricity consumption is rising again after around two decades of flat demand. Besides, the short-term energy outlook projects that the annual consumption will grow at an average of 1.7% per year from 2020 to 2026, by surpassing the previous all-time high in 2024. It also mentioned that growth is strongest in the commercial sector, which is 2.6% annually, underscoring the increasing demand for the market in this sector.
- Expansion of data centers & digital infrastructure: The aspects such as digitalization, cloud computing, AI, and 5G deployments have increased data center investments, making backup generators highly essential to prevent any costly downtime. In December 2024, the U.S. Department of Energy’s 2024 report on data center energy use states that the electricity demand from data centers is expected to double or triple by the end of 2028, based on factors such as AI, manufacturing growth, and electrification. Data centers consumed 176 TWh in 2023, which is about 4.4% of U.S. electricity, and are expected to reach 325 to 580 TWh by 2028, or 6.7% to 12% of national demand. Meanwhile, DOE is also deploying solutions such as onsite generation, advanced storage, and next-gen technologies to ensure reliable, affordable, and clean energy, hence benefiting the market.
Challenges
- Stringent emission norms and environmental regulations: Governments across most of the nations are implementing strict environmental and emission standards. Therefore, these regulations compel generator manufacturers to reduce emissions of NOx, CO, and particulate matter. Also, complying with these standards requires huge capital investments in cleaner technologies, engines, and after-treatment systems, which increases the manufacturing costs. In this context, smaller or mid-sized manufacturers find it challenging to meet compliance due to limited resources, thereby reducing their market competitiveness. Furthermore, the pressure to innovate also accelerates R&D cycles, forcing the companies to balance regulatory compliance with cost efficiency, hence negatively impacting the market.
- Supply chain and production disruptions: This is also a major bottleneck hampering the growth of the market. The production process is dependent on critical components such as engines, alternators, control systems, and electronic monitoring devices. Therefore, any disruptions in terms of the global supply chain due to raw material price hikes, geopolitical tensions, or logistic delays can impact production timelines and product availability. Also, the rising costs of metals, semiconductors, and other inputs add strain on manufacturers’ margins. Such disruptions can in turn cause delayed deliveries, order backlogs, and reduced customer satisfaction, especially for large-scale industrial orders. Companies need to opt for strategies such as diversified sourcing, local production, and inventory buffers to mitigate supply risks and ensure consistent product availability
Generator Market Size and Forecast:
| Report Attribute | Details |
|---|---|
|
Base Year |
2025 |
|
Forecast Year |
2026-2035 |
|
CAGR |
5.2% |
|
Base Year Market Size (2025) |
USD 43.9 billion |
|
Forecast Year Market Size (2035) |
USD 69.2 billion |
|
Regional Scope |
|
Generator Market Segmentation:
Technology Segment Analysis
Reciprocating internal combustion engine generator sets subtype is expected to dominate the generator market with the largest share of 64.2% during the forecast period. The growth of the segment is mainly propelled by its extensive service networks and compatibility with a variety of fuels, which include biobased diesel and HVO. They also offer durability and modularity across a wide power range, and can quickly handle load demands. In August 2023, the American Public Power Association submitted comments to the EPA on the proposed rule regarding national emission standards for hazardous air pollutants (NESHAP) for reciprocating internal combustion engines and new source performance standards for internal combustion engines, by considering the importance of retaining the 50-hour provision for nonemergency use. APPA also states that this provision supports local grid reliability and resource adequacy, which is highly essential for public power utilities serving millions nationwide, hence denoting a wider segment scope.
Fuel Type Segment Analysis
Diesel, based on fuel type, is anticipated to grow at a considerable rate in the market by 2035. The growth of the segment is mainly driven by fuel availability, transportability, and reliability during grid outages, especially in rapidly urbanizing regions. Diesel generators are widely used in regions that are experiencing rapid urbanization, where power infrastructure often struggles to keep pace with a rapidly increasing electricity demand. On the other hand, their ability to provide consistent backup power during emergencies, natural disasters, or planned maintenance makes them indispensable for hospitals, data centers, and municipal services. In addition, most of the governments and utilities continue to invest in diesel-based systems to ensure energy resilience, as evidenced by initiatives to deploy emergency backup generators in areas prone to extreme weather or grid instability.
Application Segment Analysis
The commercial and industrial sub-segment is projected to garner a significant share in the market during the forecast period. The diverse power needs, such as backup, peak shaving, and prime power, for both stationary and portable applications, are the key factors behind this leadership. On the other hand, large multi-megawatt units with extensive service networks and rapid deployment capabilities are often required for industrial projects in areas with limited grid access. Factors such as telemetry compliance and lifecycle cost efficiency favor established genset platforms with proven field reliability. These sectors remain the primary customers as infrastructure and energy capital expenditures expand. Furthermore, the heavy dependence on generators at off-grid or remote sites efficiently reinforces their position in the generator industry over the years ahead.
Our in-depth analysis of the global market includes the following segments:
|
Segment |
Subsegments |
|
Technology |
|
|
Fuel Type |
|
|
Application |
|
|
Power Rating |
|
|
Mode |
|
|
End user |
|

Vishnu Nair
Head - Global Business DevelopmentCustomize this report to your requirements — connect with our consultant for personalized insights and options.
Generator Market - Regional Analysis
APAC Market Insights
The Asia Pacific generator market is forecasted to capture the largest revenue share of 48.8% by the end of 2035. The region’s growth is mainly driven by rapid industrialization, electrification, construction, and urban power needs. The region’s market also benefits from domestic manufacturing ecosystems, export growth, and growing adoption of modular power solutions, which contribute to a dynamic and competitive regional landscape. In January 2023 Ministry of Foreign Affairs of Japan stated that the Government of Japan, through JICA, had begun delivering 237 generators to Ukraine as part of emergency support for critical energy services during winter. This was followed by an earlier provision of 25 generators and forms part of a broader plan to supply a total of 262 units of electricity, water, and gas utilities affected by infrastructure damage. Therefore, from a strategic perspective, such instances denote that there is a stable institutional export demand in encourage localized manufacturing and standards alignment.
The booming industrial sector and the emerging large-scale infrastructure development are boosting the market in China. The country represents heightened demand for high-capacity generators for factories, transportation hubs, and large commercial complexes. Based on the government data from China, which was published in September 2025, it has released a two-year action plan with a main goal to strengthen its power equipment sector, by focusing on green, intelligent, and high-quality development by 2026. Besides, this plan concentrates on growth in traditional and new energy power equipment, mainly influenced by the country’s transition toward a low-carbon energy system and the construction of a new-type power system. Furthermore, it was jointly issued by MIIT, SAMR, and the National Energy Administration, and the plan also looks forward to international supply-chain cooperation and international technical standard alignment, positively impacting market growth.
Frequent grid reliability concerns, heightened demand for backup power in telecom and commercial buildings, and rising investments in terms of data centers and smart cities are key drivers boosting the generator market in India. The country’s market also benefits from urban development and the expansion of organized commercial spaces, which continues to reshape product preferences as well as distribution strategies. In this context, as stated by the Ministry of Power in January 2025, the country met a maximum demand of 250 GW in 2024 from the power sector and reduced national energy shortages to just 0.1%. It also mentioned that universal electrification was completed, wherein the rural power availability rose to 21.9 hours, and urban supply reached 23.4 hours per day. Hence, this denotes that there is a strong opportunity for the market to grow, especially in backup and decentralized power solutions.
India Power Sector 2024-25 Key Statistics: Renewable Capacity, Grid Reliability, and Infrastructure Milestones
|
Metric |
Value (FY 2024-25) |
Notes |
|
Maximum power demand met |
250 GW |
All-time high |
|
National energy shortage |
0.1% |
Down from 4.2% in 2013-14 |
|
Per capita electricity consumption |
1,395 kWh |
45.8% increase from 957 kWh in 2013-14 |
|
Inter-State Transmission Projects approved |
50.9 GW |
Costing ₹60,676 Cr |
|
Installed renewable capacity added since 2014 |
129 GW |
Includes 91 GW solar, 27 GW wind |
|
Coal-based thermal capacity |
217.5 GW installed; 29.2 GW under construction |
Peak demand support |
|
Smart meters sanctioned under RDSS |
19,79,24,902 |
Part of distribution reform |
|
Rural electricity availability |
21.9 hours/day |
Up from 12.5 hours in 2014 |
|
Urban electricity availability |
23.4 hours/day |
Improved reliability |
|
EV charging network target |
1 lakh chargers by 2030 |
Guidelines issued in 2024 |
Source: Ministry of Power
North America Market Insights
The generator market in North America is primarily shaped by a strong focus on power continuity across commercial, industrial, and institutional users, wherein there has been a widespread adoption of power solutions. The region’s progress in this field is also carried forward by advanced control systems, integration with building management platforms, and compatibility with hybrid energy setups that combine conventional generators with renewables and storage. As per an article published by the U.S. Census Bureau in October 2024, about 1 out of every 4 U.S. households, or 33.9 million, experienced a complete power outage, wherein 70% of these outages lasted six hours or more in 2023. It also underscored that homeowners, i.e. 28.3% and rural households, with 35.4%, were disproportionately affected when compared to renters and urban households. Furthermore, households with medical devices or persons with disabilities faced heightened vulnerability, denoting there is an urgent need for backup power solutions, generator deployment, and resilient energy infrastructure across the region.
The end user base that includes data centers, healthcare facilities, construction, and the residential sector is responsible for bolstering the generator market in the U.S. The country’s market also benefits from government backing and a clear preference for technologically improved systems that consist of remote monitoring, automation, and emissions-optimized engine designs. FEMA in June 2025 announced its plans to fund San Joaquin County, California, under the Pre-Disaster Mitigation Program to strengthen water and storm drainage systems against power outages. This particular project involves installing five emergency backup generators and upgrading one pump at existing pump stations. Therefore, this readily accelerates the market by creating encouraging opportunities for the deployment of high-capacity generators in public infrastructure projects, contributing to market growth.
Surging demand from remote communities, natural resource operations, and critical public services is propelling market growth in Canada. Cold-climate performance and durability are key differentiators which are influencing product design and deployment. The government data, which was published in March 2025, states that the country’s government announced more than USD 11 million in funding through Natural Resources Canada’s CERRC program to support fifteen Indigenous-led clean energy projects across Nunavut, the Northwest Territories, Ontario, British Columbia, Saskatchewan, and Quebec. These projects include biomass hubs, solar expansions, modular housing facilities, woodstove programs, and geothermal pilots. Hence, with such government-backed projects, the country is creating sustained demand for durable backup and hybrid generators in remote, cold-weather communities.
Europe Market Insights
Europe generator market is reaping advantages from strong export capacity, compliance, and integration with broader energy systems. Demand is witnessed across industrial facilities, utilities, and public infrastructure, with an increasing attention to low-noise operation and advanced emissions management technologies. In December 2023, as stated by the European Commission, the region has deployed 500 additional power generators from its rescEU reserves in Poland to strengthen Ukraine’s energy resilience, which was valued at €16.5 million (approximately USD 18 million). The generators range from 12.5 kVA to 1,000 kVA and will power hospitals, schools, wastewater treatment, and heating stations during outages. This brings the total delivered via the EU Civil Protection Mechanism to over 5,500 generators, hence making it suitable for standard market growth.
The industrial and manufacturing strength wherein applications spanning factories, research facilities, and mission-critical infrastructure are responsibly uplifting Germany generator market. Frequent power outages and integration with automated systems are central to purchasing decisions. In January 2026, the country’s government observed that there is an urgent need to better protect Germany’s critical infrastructure after the Berlin power grid attack left thousands without electricity. The governing coalition aims to strengthen resilience by reducing dependencies, making investments in faster repairs, and ensuring emergency supplies. In addition, it also states that this coalition looks forward to enhancing innovation and economic growth through reforms in labor, energy, and social systems, denoting a huge growth potential for the generator industry.
Rising adoption in sectors such as healthcare, data services, commercial real estate, and public facilities is boosting the UK generator market. The market places a very strong emphasis on rapid deployment and dependable backup power for critical operations. In addition, service responsiveness and lifecycle support are the most influential factors reshaping repeat adoption. Based on the government data, which was published in February, 2025, Sellafield Ltd announced progress on its electrical distribution network upgrade project to strengthen the site’s electricity resilience. It also notes that six new substations and enhanced emergency generation are being installed, with massive generator modules and fuel tanks delivered in 2024. Furthermore, the project was delivered by Sellafield Ltd, Morgan Sindall Infrastructure, and Arup, ensuring proper power even during national grid shortages.
Key Generator Market Players:
- Generac Holdings Inc. (U.S.)
- Cummins Inc. (U.S.)
- Caterpillar Inc. (U.S.)
- Kohler Co. (U.S.)
- Atlas Copco AB (Sweden)
- MTU Onsite Energy (Germany / UK)
- Mitsubishi Heavy Industries, Ltd. (Japan)
- Yanmar Holdings Co., Ltd. (Japan)
- Honda Motor Co., Ltd. (Japan)
- Briggs & Stratton LLC (U.S.)
- Wärtsilä Corporation (Finland)
- FG Wilson (Caterpillar brand) (UK/ Ireland)
- Himoinsa S.L. (Spain)
- Doosan Enerbility Co., Ltd. (South Korea)
- Kirloskar Oil Engines Ltd. (India)
- Mahindra Powerol (India)
- Greaves Cotton Ltd. (India)
- Jakson Group (India)
- AKSA Power Generation (Kazancı Holding) (Turkey)
- Denyo Co., Ltd. (Japan)
- Company Overview
- Business Strategy
- Key Product Offerings
- Financial Performance
- Key Performance Indicators
- Risk Analysis
- Recent Development
- Regional Presence
- SWOT Analysis
- Generac Holdings Inc. is one of the leading providers of energy technology solutions, which offers residential, commercial, and industrial generators. Besides, the company has a strong presence in the commercial & industrial segment, and it focuses on large-megawatt generators, hybrid solutions, and digital monitoring.
- Cummins Inc. is a diversified power solutions company that is best known for its diesel and gas-powered generators for industrial, commercial, and residential use. Cummins is mainly focused on low-emission, fuel-efficient, and smart generator systems, sometimes integrating IoT capabilities for predictive maintenance and energy management.
- Caterpillar Inc., from its Cat generator sets and FG Wilson brand, is offering its services to heavy industrial, construction, and utility sectors across the globe. The company has robust product reliability, an international service network, and scalable industrial solutions. In addition, Caterpillar makes investments in high-capacity, large-megawatt generators for mining, oil & gas, and data centers.
- Kohler Co. is a central player in this field, which is recognized for residential, commercial, and industrial standby generators with a prime focus on durability and low-noise operation. The company mainly focuses on innovation in automatic home standby generators, commercial modular solutions, and smart monitoring systems.
- Mahindra Powerol has registered itself as one of the leading diesel generator manufacturers in India, which is specializing in low- and medium-power gensets for industrial, telecom, and commercial applications. In addition, the company is focused on CPCB-compliant, fuel-efficient, and reliable generators, addressing India’s frequent power outage challenges.
Below is the list of some prominent players operating in the global generator market:
The pioneers, such as Generac, Cummins, Caterpillar, Kohler, and Rolls-Royce, are dominating the global generator market with their strong brand recognition. These companies differentiate through technological innovation, focusing on fuel efficiency, emissions reduction, and digital monitoring. On the other hand, most of the leaders are pursuing distinct strategies such as capacity expansions, mergers and acquisitions, and partnerships to strengthen their presence in this field. In addition, demand in emerging nations has catalyzed local manufacturers such as Kirloskar, Mahindra Powerol, and Greaves Cotton, enhancing the competitive dynamics. In May 2025, Mahindra Powerol reported that it had been named India’s No.1 genset manufacturer in FY25 by Frost & Sullivan, achieving a 23.8% market share and surpassing the long-standing leader.
Corporate Landscape of the Generator Market:
Recent Developments
- In January 2026, Generac Holdings Inc. announced the acquisition of a new manufacturing facility in Sussex, Wisconsin, to boost capacity for large-scale backup power generators, particularly to serve the booming data center industry, healthcare, hospitality, and heavy industrial sectors.
- In July 2025, Honda Power Sports & Products announced that it has advanced generator safety by equipping all portable models with an enhanced CO-MINDER carbon monoxide detection and auto shutoff system.
- Report ID: 5930
- Published Date: Feb 16, 2026
- Report Format: PDF, PPT
- Explore a preview of key market trends and insights
- Review sample data tables and segment breakdowns
- Experience the quality of our visual data representations
- Evaluate our report structure and research methodology
- Get a glimpse of competitive landscape analysis
- Understand how regional forecasts are presented
- Assess the depth of company profiling and benchmarking
- Preview how actionable insights can support your strategy
Explore real data and analysis
Frequently Asked Questions (FAQ)
Generator Market Report Scope
Free Sample includes current and historical market size, growth trends, regional charts & tables, company profiles, segment-wise forecasts, and more.
Connect with our Expert


Copyright @ 2026 Research Nester. All Rights Reserved.
