Slip Additives Market Outlook:
Slip Additives Market size was valued at USD 436 million in 2025 and is projected to reach USD 1.7 billion by the end of 2035, rising at a CAGR of 5.9% during the forecast period, i.e., 2026-2035. In 2026, the industry size of slip additives is evaluated at USD 461 million.
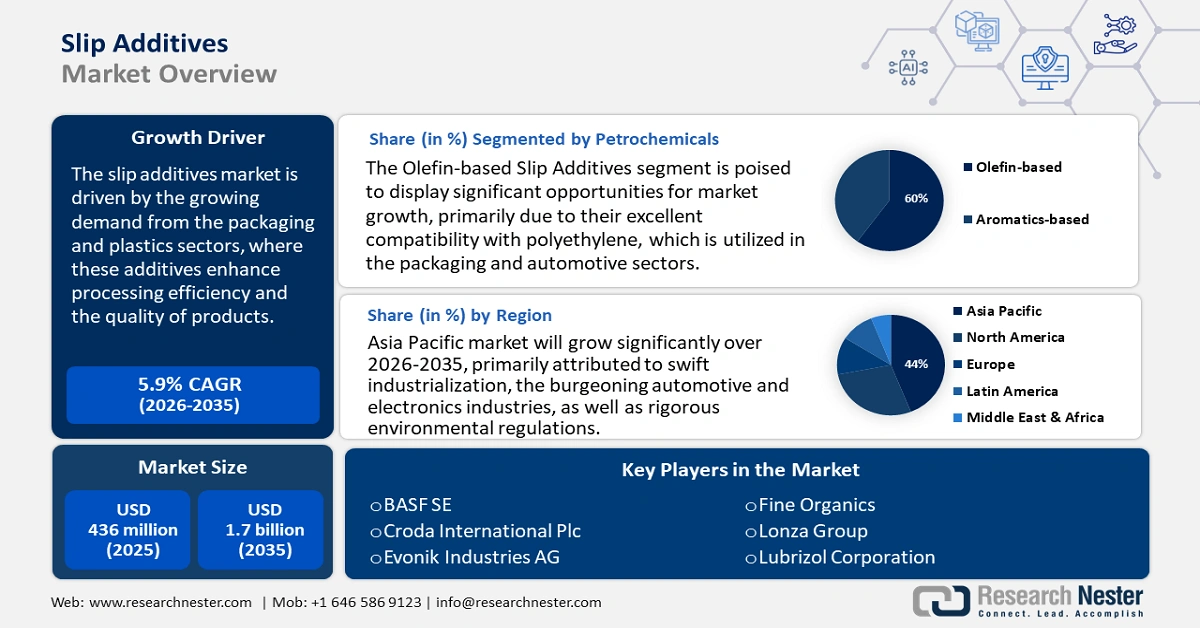
The global slip additives market is mainly propelled by the growing demand from the packaging and plastics sectors, where these additives enhance processing efficiency and the quality of products. The expansion in emerging economies, along with regulatory focus on minimizing product defects and improving recyclability, further drives the adoption of slip additives, strengthened by government initiatives that advocate for sustainable manufacturing practices.
The supply chain for raw materials used in slip additives is significantly reliant on specialty chemicals, including fatty acid amides and synthetic waxes, which are sourced from around the globe. In 2023, India imported chemicals worth $75 billion, while exports amounted to $44 billion, resulting in a trade deficit of approximately $31 billion. Efforts to expand manufacturing capacity are currently in progress, with a trend towards greater automation in assembly lines to accommodate the growing demand. The Department of Energy is providing funding for RDD projects that concentrate on the synthesis of energy-efficient additives and the development of sustainable chemical processes, which are crucial for fostering market innovation and optimizing costs.
Key Slip Additives Market Insights Summary:
Regional Highlights:
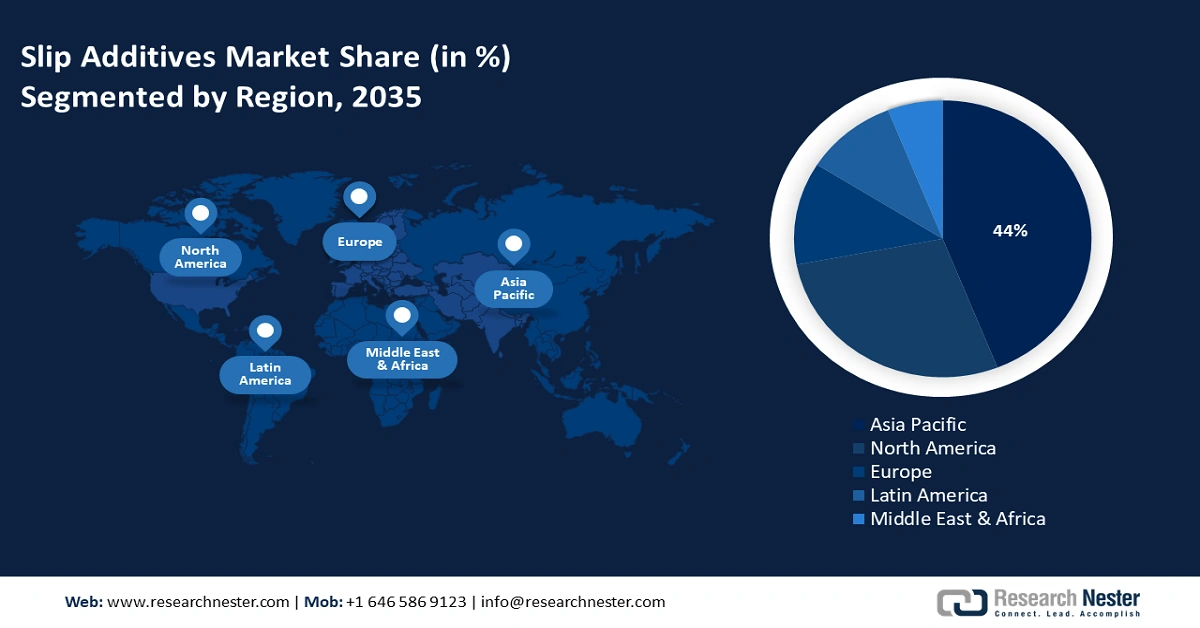
- The Asia Pacific region is forecast to command a 44% share of the Slip Additives Market by 2035, bolstered by rapid industrialization and strong government investments in sustainable chemical technologies.
- North America is expected to account for about 28% of the global share by 2035, underpinned by escalating demand for lightweight recyclable materials across automotive and packaging industries.
Segment Insights:
- The olefin-based slip additives segment in the Slip Additives Market is set to achieve a 60% share by 2035, reinforced by its compatibility with polyethylene and enhancements in recyclability performance.
- The silicone-based slip additives segment is anticipated to attain a 24% share by 2035, supported by advancing chemical safety regulations that promote non-toxic, low-emission additive adoption.
Key Growth Trends:
- Advancements in greener chemical production
- Sustainability initiatives driving green chemicals adoption
Major Challenges:
- Infrastructure and logistics limitations
- Investment constraints in R&D and technology
Key Players: Dow Inc., BASF SE, Clariant AG, Evonik Industries AG, BYK Additives & Instruments, Shin-Etsu Chemical Co., Ltd., Mitsui Chemicals, Inc., Croda International plc, Songwon Industrial Co., Ltd., Synthomer plc, UPL Limited, BASF Malaysia Sdn Bhd, Arkema S.A., Evonik Australia Pty Ltd, Jubilant Life Sciences Ltd.
Global Slip Additives Market Forecast and Regional Outlook:
Market Size & Growth Projections:
- 2025 Market Size: USD 436 billion
- 2026 Market Size: USD 1.7 billion
- Projected Market Size: USD 461 million by 2035
- Growth Forecasts: 5.9% CAGR (2026-2035)
Key Regional Dynamics:
- Largest Region: Asia Pacific (44% Share by 2035)
- Fastest Growing Region: Asia Pacific
- Dominating Countries: United States, China, Germany, Japan, South Korea
- Emerging Countries: India, Brazil, Indonesia, Mexico, Turkey
Last updated on : 15 September, 2025
Slip Additives Market - Growth Drivers and Challenges
Growth Drivers
- Advancements in greener chemical production: Innovations like advanced catalytic technologies have enhanced the efficiency of slip additive production, leading to a notable decrease in energy consumption and costs. The U.S. Department of Energy reports that additive manufacturing continues to build momentum in many industries and is changing the way manufacturers approach problems that are scientific in nature. According to a leading 3D printing insights report, the 3D printing industry grew more than 31% annually until 2020 while generating more than $21 billion in revenue. This development enables manufacturers to increase the production of eco-friendly slip additives while keeping prices competitive. Consequently, the demand for sustainable chemical products is on the rise, propelled by more stringent environmental regulations and corporate sustainability objectives. These environmentally friendly production techniques not only improve the industry's reputation but also contribute to sustained market growth.
- Sustainability initiatives driving green chemicals adoption: The transition of the chemical industry towards sustainability and the reduction of carbon footprints are driving the demand for renewable and bio-based slip additives. The green chemicals market is anticipated to grow steadily by 2027, highlighting an increase in investments in renewable raw materials. This movement is in line with the objectives of the global circular economy, advocating for additives that minimize environmental impact. Manufacturers are focusing on sustainable formulations to comply with regulatory standards and meet consumer expectations, thereby accelerating market adoption. As a result, sustainability initiatives are a crucial element propelling innovation and growth in the slip additives sector.
- Rising demand in the packaging industry: The continued economic expansion of the packaging industry is set to drive strong demand for slip additives, which enhance manufacturing efficiency and product performance. In 2022, the U.S. plastics sector imported approximately 0.97 million tons of plastic raw materials valued at USD 2 billion, underscoring the scale of industrial activity. To optimize operations, manufacturers are increasingly integrating slip additives into production lines to reduce material waste and improve the functionality of flexible films, coatings, and packaging. This trend reflects a broader shift toward high-performance, cost-effective solutions in industrial plastics processing.
1. Emerging Trade Dynamics of Binder or Baler Twine of Polyethylene or Polypropylene
Top Exporters of Binder or Baler Twine of Polyethylene or Polypropylene 2023
|
Exporter |
Trade Value (in USD Thousands) |
Quantity (Kg) |
|
Portugal |
121,687.66 |
51,997,300 |
|
European Union |
73,410.29 |
29,711,900 |
|
Hungary |
38,661.53 |
14,307,400 |
|
China |
34,312.69 |
12,779,000 |
|
Vietnam |
16,044.32 |
6,995,140 |
|
Turkey |
14,430.40 |
7,989,570 |
|
Czech Republic |
11,242.22 |
4,905,870 |
|
Germany |
9,391.36 |
3,216,270 |
|
Serbia (FR Yugoslavia) |
8,079.48 |
4,179,680 |
|
Poland |
7,873.51 |
3,329,370 |
Source: WITS
Challenges
- Infrastructure and logistics limitations: Logistics disruptions cause substantial delays in deliveries and increase costs for manufacturers of slip additives. The COVID-19 pandemic exposed a hurdle in the supply chain, with container shipping rates on routes from Asia to North America increasing in 2021. These heightened costs and delays have a disproportionate effect on small and mid-sized manufacturers, particularly those reliant on just-in-time inventory systems. The situation is worsened by restricted port capacity and transportation, which hinder timely market supply and profitability.
- Investment constraints in R&D and technology: Increasing expenses associated with adapting to changing environmental and safety regulations are limiting research and development investments in the slip additives industry. Smaller enterprises face challenges in securing funding for sustainable innovation and digital transformation initiatives, which hampers their competitive edge. This lack of investment hinders the advancement of environmentally friendly and more efficient slip additive technologies that are essential for achieving success in future markets.
Slip Additives Market Size and Forecast:
| Report Attribute | Details |
|---|---|
|
Base Year |
2025 |
|
Forecast Year |
2026-2035 |
|
CAGR |
5.9% |
|
Base Year Market Size (2025) |
USD 436 million |
|
Forecast Year Market Size (2035) |
USD 1.7 billion |
|
Regional Scope |
|
Slip Additives Market Segmentation:
Petrochemical Segment Analysis
The olefin-based slip additives segment is projected to capture a 60% share of the global slip additives market by 2035, primarily due to their excellent compatibility with polyethylene, which is extensively utilized in the packaging and automotive sectors. Global commerce in propylene and other olefin polymers reached $3.1 billion in 2023, an 8.29% drop from $3.38 billion in 2022. Trade in this category has increased at an annualized rate of 0.35% throughout the last five years. Furthermore, the continuous regulatory emphasis on minimizing plastic waste promotes the adoption of slip additives that enhance recyclability, thereby propelling the olefin-based segments.
Specialty Chemicals Segment Analysis
The silicone-based slip additives segment is projected to capture a 24% share of the global slip additives market by 2035, providing outstanding surface modification and durability, and is favored in the electronics and pharmaceutical industries. According to the European Chemicals Agency (ECHA), the enforcement of stricter chemical safety regulations has driven progress in silicone chemistry, enabling the attainment of environmental compliance without compromising performance standards. This sub-segment gains from sustainability efforts that advocate for non-toxic, low-emission additives, thereby fostering growth in high-tech applications.
Industrial Gases Segment Analysis
The nitrogen-derived segment is projected to capture a 15% share of the global slip additives market by 2035, because they are used in a variety of applications, including the processing of polymers and coatings, and as packaging films, and their roles in improved oxidation stability, friction reduction, and the ability to successfully produce plastic on a large scale. Growing volumes of polyethylene and polypropylene for packaging have increased demand for nitrogen-derived slip additives, further solidifying the aforementioned position.
Our in-depth analysis of the slip additives market includes the following segments:
|
Segment |
Subsegment |
|
|
|
Speciality Chemicals |
|
|
Industrial Gases
|
|
|
End use |
|
|
Carrier Resin |
|
|
Type |
|

Vishnu Nair
Head - Global Business DevelopmentCustomize this report to your requirements — connect with our consultant for personalized insights and options.
Slip Additives Market - Regional Analysis
Asia Pacific Market Insights
The slip additives market in the Asia Pacific is projected to capture 44% of the global market share by the year 2035. This growth is primarily attributed to swift industrialization, the growing automotive and electronics industries, as well as rigorous environmental regulations. Governments in Japan, China, and South Korea are making significant investments in sustainable chemical technologies, which in turn strengthens market expansion. The rising demand for high-performance materials and eco-friendly chemicals is driving innovation in this sector. Additionally, the increasing urbanization in India and Malaysia is further propelling the adoption of Slip Additives within the manufacturing and packaging industries.
China is projected to lead the APAC slip additives market, and this growth is fueled by substantial government investments in sustainable chemical technologies and enhancements in manufacturing processes. Initiatives spearheaded by the Ministry of Ecology and Environment, along with the NDRC, promote the adoption of green chemistry in many companies, thereby increasing demand. Furthermore, China's focus on minimizing environmental impact in the petrochemical and specialty chemical sectors, combined with robust infrastructure development, facilitates ongoing growth.
Exports of Other Polymers of Propylene or Other Olefins by Key Asia-Pacific Countries (2023)
|
Country / Region |
Export Value (in thousands USD) |
Quantity (kg) |
|
Japan |
210,327.89 |
39,958,600 |
|
China |
87,628.70 |
29,133,400 |
|
India |
11,016.10 |
12,950,900 |
|
Indonesia |
2,595.21 |
4,192,760 |
|
Malaysia |
83,202.11 |
38,631,600 |
|
Australia |
1,007.16 |
274,485 |
|
South Korea (Rep.) |
275,629.37 |
146,378,000 |
|
Other Asia, nes |
54,304.33 |
26,054,400 |
Source: WITS
North America Market Insights
In the year 2035, North America, comprising the U.S. and Canada, is projected to represent around 28% of the worldwide slip additives market. This expansion is mainly driven by strong demand from the automotive and packaging sectors for lightweight and recyclable materials. Furthermore, the regulatory demands set forth by the EPA, along with investments in sustainable chemistry supported by the U.S. Department of Energy, are promoting the adoption of green slip additives. Furthermore, federal initiatives aimed at enhancing chemical safety and innovation are contributing to market expansion, with government funding on the rise to support the production of clean energy chemicals.
The U.S. slip additives market is growing due to demand in packaging, coatings, and plastics. Fatty amides and waxes/polysiloxanes are the leading segments. Major players include Dow Chemical, BASF, and Evonik Industries. Federal grants from the Advanced Manufacturing Office support eco-friendly slip additives and safer chemical disposal. In 2023, the top exporters of polymers of propylene and other olefins were the United States ($727M), Belgium ($444M), and Japan ($271M), while the leading importers were China ($557M), Germany ($310M), and Singapore ($221M). These polymers are classified under plastics & rubbers, specifically HS4 propylene polymers.
Europe Market Insights
The slip additives market in Europe is anticipated to secure 26% of the global market share by 2035, propelled by strict environmental regulations, a rising demand for sustainable materials, and significant investments in chemical innovation. Prominent markets, including Germany, France, and the UK, are at the forefront, strengthened by strong governmental support that emphasizes green chemistry and circular economy initiatives. The European Chemicals Agency (ECHA) and the European Chemical Industry Council (CEFIC) facilitate this expansion through their policy frameworks and financial backing.
Export Data for Expansible Polystyrene in Primary Forms (2023)
|
Country |
Export Value (USD) |
Quantity (Kg) |
|
France |
138,452,140 |
75,557,400 |
|
Italy |
55,966,020 |
29,480,800 |
|
Spain |
9,735,670 |
- |
|
Portugal |
9,875,910 |
6,228,570 |
|
Greece |
91,920,720 |
55,551,600 |
|
Poland |
102,337,090 |
50,883,700 |
|
Hungary |
38,752,670 |
22,122,600 |
|
Czech Republic |
52,391,000 |
28,976,900 |
|
Sweden |
21,947,260 |
10,820,200 |
Source: WITS
Key Slip Additives Market Players:
- Dow Inc.
- Company Overview
- Business Strategy
- Key Product Offerings
- Financial Performance
- Key Performance Indicators
- Risk Analysis
- Recent Development
- Regional Presence
- SWOT Analysis
- BASF SE
- Clariant AG
- Evonik Industries AG
- BYK Additives & Instruments
- Shin-Etsu Chemical Co., Ltd.
- Mitsui Chemicals, Inc.
- Croda International plc
- Songwon Industrial Co., Ltd.
- Synthomer plc
- UPL Limited
- BASF Malaysia Sdn Bhd
- Arkema S.A.
- Evonik Australia Pty Ltd
- Jubilant Life Sciences Ltd.
The global slip additives market is intensely competitive, dominated by significant players from the USA, Europe, and Asia who prioritize innovation and sustainability. Leading companies allocate resources to research and development for environmentally friendly formulations and pursue growth through strategic alliances and acquisitions. The focus on digitalization, cleaner production methods, and regional diversification is essential for sustaining market leadership. The table below enumerates the top global slip additives chemical manufacturers based on market share and their respective countries of origin. It showcases prominent industry leaders from the U.S., Europe, Asia, and Australia, illustrating the global distribution of production and centers of innovation.
Top Global Slip Additives Chemical Manufacturers
Recent Developments
- In June 2024, BASF launched SoluPlus, aiming at high-performance electronics and automotive sectors. The initial sales saw a rise of 20% in Q3 2024, indicating robust acceptance in Asia-Pacific markets that prioritize lightweight and durable materials.
- In March 2024, Dow's EcoSurf biodegradable slip additive secured a 25% market share in the sustainable packaging sector within just six months, fueled by the growing demand for eco-friendly polymers in North America and Europe. This introduction is in line with the escalating regulatory pressure for more environmentally friendly chemicals.
- Report ID: 3080
- Published Date: Sep 15, 2025
- Report Format: PDF, PPT
- Explore a preview of key market trends and insights
- Review sample data tables and segment breakdowns
- Experience the quality of our visual data representations
- Evaluate our report structure and research methodology
- Get a glimpse of competitive landscape analysis
- Understand how regional forecasts are presented
- Assess the depth of company profiling and benchmarking
- Preview how actionable insights can support your strategy
Explore real data and analysis
Frequently Asked Questions (FAQ)
Slip Additives Market Report Scope
Free Sample includes current and historical market size, growth trends, regional charts & tables, company profiles, segment-wise forecasts, and more.
Connect with our Expert


Copyright @ 2026 Research Nester. All Rights Reserved.
