Optically Clear Resin Market Outlook:
Optically Clear Resin Market was valued at USD 1.5 billion in 2025 and is projected to reach USD 3.3 billion by the end of 2035, rising at a CAGR of 7.1% during the forecast period, i.e., 2026 to 2035. In 2026, the industry size of optically clear resin is estimated at approximately USD 1.6 billion.
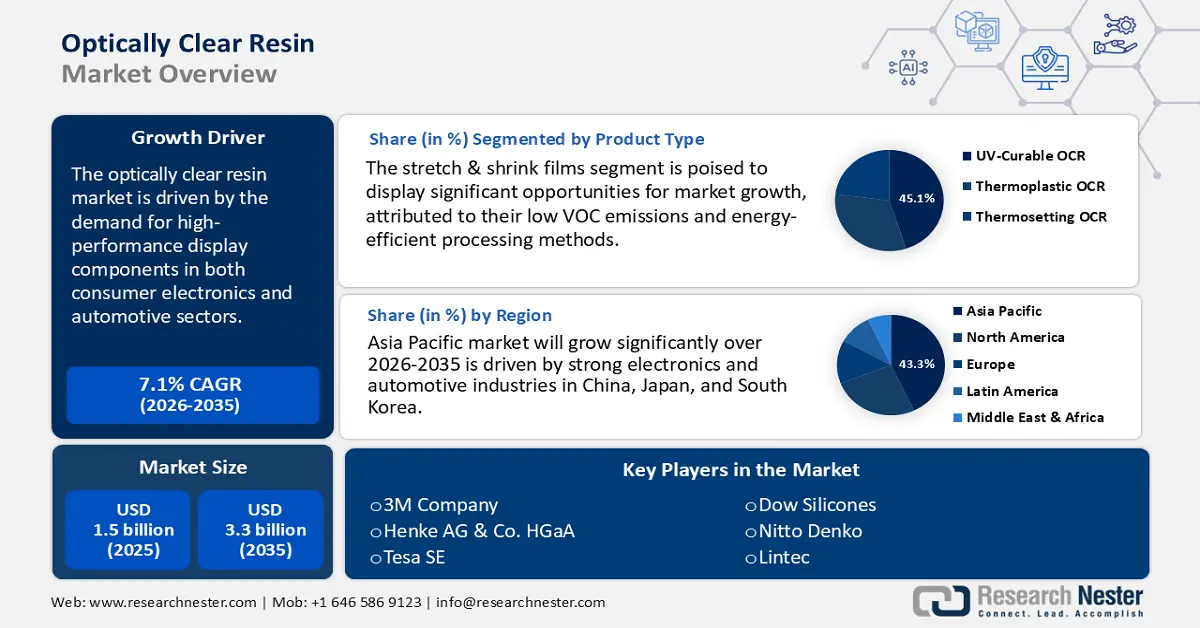
The expansion of the optically clear resin market is primarily fueled by the increasing demand from consumer electronics and automotive display technologies. As smartphones, tablets, wearable devices, and progressively digital dashboards featuring heads-up displays become commonplace, manufacturers need materials that provide high optical clarity, minimal haze, exceptional UV stability, and robust bonding between cover glass and display modules. The automotive sector has also emerged as a significant growth driver, as electric vehicles (EVs) and connected vehicles incorporate more screens, sensors, and augmented reality/virtual reality (AR/VR) interfaces, all of which necessitate distortion-free visibility under diverse environmental conditions.
![]()
Source: usitc.gov
Furthermore, advancements in resin formulation and manufacturing processes are facilitating enhanced performance and increased production efficiency. Companies are making substantial investments in research and development to minimize defects and create thinner resin layers while preserving clarity. For instance, Covestro AG has been working on optically clear polyurethane and acrylic resin systems that are utilized in display films, adhesives, and automotive lighting covers. Covestro’s products are distinguished by their combination of durability, optical performance, and processability, which aid in fulfilling both aesthetic and functional requirements in end products.
Key Optically Clear Resin Market Insights Summary:
Regional Insights:
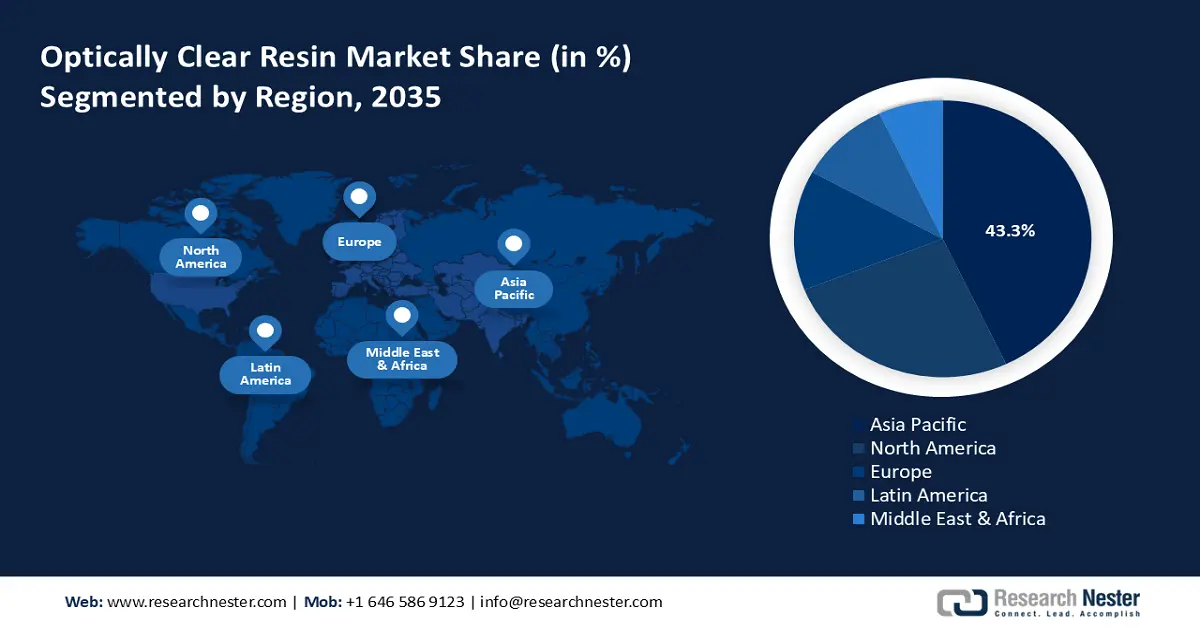
- By 2035, Asia Pacific is anticipated to command a 43.3% share of the Optically Clear Resin Market, supported by the region’s expanding electronics and automotive base owing to sustained investments in optoelectronics and green chemical technologies.
- North America is set to account for 26% of global share by 2035, reinforced by rising demand for lightweight durable materials resulting from stringent environmental regulations and advances in sustainable chemical manufacturing.
Segment Insights:
- By 2035, the UV-curable OCR resins segment is projected to hold a 45.1% share in the Optically Clear Resin Market, strengthened by compliance with environmental standards driven by low VOC emissions and energy-efficient processing methods.
- The consumer electronics segment is expected to achieve about 40% share by 2035, supported by rising demand for advanced visual interfaces stimulated by increasing requirements for high-clarity and durable display solutions.
Key Growth Trends:
- Adoption in next-generation solar energy system
- Modernization of military display systems
Major Challenges:
- High production costs
- Durability and environmental resistance
Key Players: Dow Inc., Mitsui Chemicals, Inc., BASF SE, Shin-Etsu Chemical Co., Ltd., Eastman Chemical Company, LG Chem Ltd., Covestro AG, Evonik Industries AG, Celanese Corporation, Reliance Industries Limited, Mitsui & Co., Ltd. (Chemicals), Australian Chemical Holdings, Malaysian Petrochemicals Sdn Bhd, LG Household & Health Care, DIC Corporation.
Global Optically Clear Resin Market Forecast and Regional Outlook:
Market Size & Growth Projections:
- 2025 Market Size: USD 1.5 billion
- 2026 Market Size: USD 1.6 billion
- Projected Market Size: USD 3.3 billion by 2035
- Growth Forecasts: 7.1% CAGR (2026-2035)
Key Regional Dynamics:
- Largest Region: Asia Pacific (43.3% Share by 2035)
- Fastest Growing Region: Asia Pacific
- Dominating Countries: United States, China, Japan, Germany, South Korea
- Emerging Countries: India, Taiwan, Indonesia, Vietnam, Malaysia
Last updated on : 3 October, 2025
Optically Clear Resin Market Growth Drivers and Challenges:
Growth Drivers
- Adoption in next-generation solar energy systems: The worldwide movement towards renewable energy is accelerating the incorporation of optically clear resins (OCR) in building-integrated photovoltaics (BIPV). These resins play a vital role in laminating solar modules, safeguarding the cells while optimizing light transmission for enhanced efficiency. For instance, Henkel supplies specialized optically clear encapsulants for solar panel manufacturers, thereby supporting the industry's growth. IRENA, global solar capacity has consistently increased every year, which directly boosts the demand for high-performance encapsulation materials such as OCR that guarantee long-lasting durability and power output.
- Modernization of military display systems: Global defense modernization initiatives are propelling the need for rugged, high-performance displays in aircraft cockpits and vehicle consoles. Optically clear resins (OCRs) are crucial for adhering these displays, offering both impact resistance and optical clarity. A report from the NATO Industrial Advisory Group underscores the strategic importance of upgrading avionics, with member countries significantly boosting their procurement of advanced systems that employ these specialized materials. For instance, Master Bond develops high-performance OCRs that comply with rigorous military specifications (MIL-SPEC) for thermal stability and durability, aligning with NATO's modernization objectives.
- Expansion of medical diagnostic equipment: The evolution of digital healthcare, which includes devices such as high-resolution ultrasound and endoscopy systems, depends on precision optics. OCRs are utilized in the assembly of lenses and sensors that demand impeccable clarity and biocompatibility. The World Health Organization (WHO) highlights that increased funding for health and the adoption of technology in developing economies are broadening access to such diagnostic imaging, thereby driving the demand for components. For instance, Dymax Corporation provides medical-grade, fast-curing OCRs that are ideal for assembling sensitive diagnostic imaging equipment, thereby supporting the healthcare expansion recognized by the WHO.
1. Optically Clear Resin Market: Trade Analysis
Trade Volume of Optoelectronic (2023)
|
Leading Exporters |
Value (USD Million) |
Leading Importers |
Value (USD Million) |
|
U.S. |
485 |
U.S. |
276 |
|
Germany |
481 |
Germany |
240 |
|
China |
397 |
Hongkong |
177 |
|
UK |
95.1 |
Japan |
162 |
|
Canada |
81.7 |
India |
142 |
Source: OEC
2. Growth of Photovoltaic & LED Semiconductor Devices
Photovoltaic & LED Semiconductor Devices (2022 - 2023)
|
Country |
Export (2022) |
Export (2023) |
Growth (%) |
|
India |
324M |
2B |
518 |
|
Cambodia |
947M |
2.73B |
188 |
|
Vietnam |
6.12B |
7.59B |
24 |
|
China |
43.3B |
44.2B |
2.11 |
Source: OEC
Challenges
- High production costs: The production of optically clear resin necessitates intricate chemical formulations and precise processing techniques, which significantly elevate production expenses. These elevated costs hinder widespread adoption, particularly in industries that are sensitive to pricing, such as consumer electronics. Furthermore, ensuring consistent quality while increasing production capacity poses a considerable challenge. Manufacturers are required to invest in cutting-edge technology and high-quality raw materials, which further contribute to the overall costs. This financial barrier can impede market expansion and innovation.
- Durability and environmental resistance: Global Optically clear resins are required to retain clarity and functionality under diverse environmental conditions, including UV exposure, humidity, and temperature variations. Numerous OCR formulations experience degradation, yellowing, or a decline in transparency over time when subjected to severe conditions. Achieving long-term durability without sacrificing optical characteristics presents a notable challenge. This limitation restricts the application of OCR in outdoor or high-stress environments. Manufacturers are persistently pursuing enhanced formulations to improve resistance and longevity.
Optically Clear Resin Market Size and Forecast:
| Report Attribute | Details |
|---|---|
|
Base Year |
2025 |
|
Forecast Year |
2026-2035 |
|
CAGR |
7.1% |
|
Base Year Market Size (2025) |
USD 1.5 billion |
|
Forecast Year Market Size (2035) |
USD 3.3 billion |
|
Regional Scope |
|
Optically Clear Resin Market Segmentation:
Product Type Segment Analysis
The UV-curable OCR resins segment is expected to capture a 45.1% share of the global optically clear resin market, attributed to their low VOC emissions and energy-efficient processing methods, which comply with environmental regulations such as the EPA’s Clean Air Act. These resins adhere to rigorous sustainability criteria and minimize manufacturing waste, thereby promoting their adoption in the Asia-Pacific and North American markets. Reports from the U.S. Environmental Protection Agency indicate an increasing regulatory pressure on solvent-based resins, which is fostering a transition towards UV-curable alternatives.
Application Segment Analysis
Consumer electronics are poised to take the lead in the global optically clear resin market, representing around 40% of its total value. This expansion is fueled by a rising demand for high-quality displays, touchscreens, and flexible devices, including smartphones, tablets, and wearables. The requirement for improved optical clarity and durability in these applications propels the adoption of OCR. A prominent player in this field is Covestro, recognized for its cutting-edge resin solutions specifically designed for consumer electronics.
End use Segment Analysis
The automotive industry is anticipated to secure a substantial portion of the global market by 2035, driven by an increasing utilization of lightweight, transparent components such as head-up displays, lenses, and interior panels. The growing demand for advanced safety features and enhanced aesthetics further accelerates the adoption of OCR in vehicles. BASF stands out as a key company in this sector, offering innovative resin solutions that fulfill the rigorous performance standards of the automotive industry.
Our in-depth analysis of the optically clear resin market includes the following segments:
Product Type |
|
|
Application |
|
|
End-use |
|

Vishnu Nair
Head - Global Business DevelopmentCustomize this report to your requirements — connect with our consultant for personalized insights and options.
Optically Clear Resin Market Regional Analysis:
Asia Pacific Market Insights
Asia Pacific is anticipated to secure 43.3% of the worldwide optically clear resin market by the year 2035. This growth is driven by strong electronics and automotive industries in China, Japan, and South Korea. The government's focus on sustainability, bolstered by financial support from organizations such as METI (Japan) and NDRC (China), encourages the development of green chemical technologies. Increasing industrial digitalization and investments in optoelectronics are propelling the demand for OCR. Environmental regulations in India and Malaysia further enhance the pace of adoption, while emerging markets such as Indonesia and Taiwan play a significant role in the regional growth.
APAC Smartphone Trade Volume (2022 – 2023)
|
Country |
Export (2022) |
Export (2023) |
Growth |
Growth (%) |
|
China |
178B |
186B |
8.37B |
4.71% |
|
India |
8.94B |
16B |
7.02B |
78.5% |
|
Singapore |
791M |
1.79B |
1B |
126% |
|
Malaysia |
85M |
174M |
105% |
89.2M |
Source: OEC
By 2035, China is anticipated to dominate the Asia-Pacific market in terms of revenue share, propelled by its vast electronics manufacturing sector, robust governmental backing for sustainable materials, and strategic investments spearheaded by the Ministry of Ecology and Environment, along with the National Development and Reform Commission (NDRC). These initiatives promote innovation and environmentally friendly production. Shenzhen Wason Tech serves as a prime example of this growth, providing high-performance optically clear adhesives for displays and touch-enabled devices.
By 2035, India is expected to take the lead in the APAC OCR market regarding revenue share, fueled by the rapid growth of consumer electronics manufacturing, increasing adoption of smart devices, and strong governmental initiatives such as Make in India that encourage local production. The surge in investment in display technologies and flexible electronics further enhances the demand for OCR. SRF Limited, a prominent Indian manufacturer, is actively broadening its specialty chemicals segment to support high-performance materials utilized in optical applications.
North America Market Insights
North America, comprising the U.S. and Canada, is anticipated to account for 26% of the worldwide market share by 2035, fueled by robust demand in the automotive and consumer electronics industries. The primary factors driving this growth include the rising use of lightweight and durable materials, along with strict environmental regulations that are encouraging advancements in green chemical technologies. Additionally, government initiatives that promote sustainable chemical manufacturing and safety have spurred growth, accompanied by increasing investments in cutting-edge production techniques.
The U.S. is anticipated to maintain a substantial portion of the global OCR market by the year 2035, propelled by innovations in display technologies, robust research and development investments, and a rising demand for high-performance materials in sectors such as consumer electronics, automotive heads-up displays, and medical devices. Additionally, supportive regulations and a well-established electronics industry further enhance growth. Dow Inc., a leading company based in the U.S., offers cutting-edge optically clear resin solutions designed for high-clarity and durable applications across various industries.
Canada is expected to secure a modest share of the global OCR market by 2035, influenced by increasing demand in medical devices, advanced automotive technologies, and the nation’s commitment to sustainable materials. Government initiatives supporting clean technology and research and development also contribute to market growth. Although Canada is not a major player in the Asia-Pacific region, it makes contributions through innovation. 3M Canada is a significant contributor, providing optically clear adhesives and resins utilized in high-precision electronic and healthcare applications.
Europe Market Insights
Europe is anticipated to account for 24% of the worldwide market share by 2035. This growth is propelled by rigorous environmental regulations set forth by the European Chemicals Agency (ECHA) and a robust demand within the automotive and electronics industries. Initiatives aimed at sustainability, as outlined in the European Green Deal, along with heightened research and development investments from industry leaders, are driving innovation. Additionally, the regional focus on circular economy principles and environmentally sustainable manufacturing practices further bolster market growth.
The UK is anticipated to maintain a limited portion of the APAC OCR market by the year 2035, contributing primarily through innovation and specialized exports rather than sheer volume. The growth in this sector is propelled by advancements in optoelectronics, a rising demand for high-resolution displays, and robust collaboration between academia and industry in the field of materials science. Furthermore, the UK's focus on sustainable and high-performance polymers reinforces this trend. A prominent company in this domain is Oxford Advanced Surfaces, which specializes in the development of functional coatings and resins for optical and electronic applications.
Germany is expected to capture a moderate share of the APAC OCR market by 2035, fueled by its prowess in advanced manufacturing, precision engineering, and automotive innovation. The demand for OCR in high-end display systems, head-up displays, and industrial optics is on the rise, bolstered by strong research and development efforts as well as sustainability-oriented initiatives. Henkel AG & Co. KGaA, a globally recognized leader based in Germany, provides a diverse array of optically clear adhesives and resins specifically designed for electronics and automotive applications.
Optically Clear Resin Market Players:
- Company Overview
- Business Strategy
- Key Product Offerings
- Financial Performance
- Key Performance Indicators
- Risk Analysis
- Recent Development
- Regional Presence
- SWOT Analysis
The market for optically clear resin is primarily led by multinational chemical corporations based in the USA, Japan, and Europe, alongside emerging competitors from South Korea, India, and Malaysia. Major companies are making significant investments in sustainability, digital transformation, and the innovation of advanced materials to sustain their competitive edge. Market leadership and future growth prospects are defined by strategic alliances, expansions in capacity, and research and development focused on environmentally friendly processes. Below is a table that outlines the top 15 global manufacturers in the OCR chemical sector, including their market shares and countries of origin, followed by a summary of the competitive landscape.
Top 15 Global Optically Clear Resin Manufacturers
|
Company Name |
Country |
Estimated Market Share (%) |
|
Dow Inc. |
USA |
12.6 |
|
Mitsui Chemicals, Inc. |
Japan |
10.4 |
|
BASF SE |
Germany |
9.9 |
|
Shin-Etsu Chemical Co., Ltd. |
Japan |
8.8 |
|
Eastman Chemical Company |
USA |
8.0 |
|
LG Chem Ltd. |
South Korea |
xx |
|
Covestro AG |
Germany |
xx |
|
Evonik Industries AG |
Germany |
xx |
|
Celanese Corporation |
USA |
xx |
|
Reliance Industries Limited |
India |
xx |
|
Mitsui & Co., Ltd. (Chemicals) |
Japan |
xx |
|
Australian Chemical Holdings |
Australia |
xx |
|
Malaysian Petrochemicals Sdn Bhd |
Malaysia |
xx |
|
LG Household & Health Care |
South Korea |
xx |
|
DIC Corporation |
Japan |
xx |
Here are a few areas of focus covered in the competitive landscape of the market:
Recent Developments
- In February 2024, Dow Inc. introduced EcoClear, a biodegradable resin that is optically clear, achieving a 22% increase in market share for sustainable packaging within six months, thereby strengthening its dedication to environmentally friendly materials.
- In August 2024, Shin-Etsu Chemical introduced UltraClear Resin 2.0, which is specifically tailored for flexible OLED displays. This advancement led to a 16% rise in adoption within the consumer electronics industry, greatly enhancing the company’s market presence throughout Asia, as reported by Industry Weekly 2024.
- Report ID: 3966
- Published Date: Oct 03, 2025
- Report Format: PDF, PPT
- Explore a preview of key market trends and insights
- Review sample data tables and segment breakdowns
- Experience the quality of our visual data representations
- Evaluate our report structure and research methodology
- Get a glimpse of competitive landscape analysis
- Understand how regional forecasts are presented
- Assess the depth of company profiling and benchmarking
- Preview how actionable insights can support your strategy
Explore real data and analysis
Frequently Asked Questions (FAQ)
Optically Clear Resin Market Report Scope
Free Sample includes current and historical market size, growth trends, regional charts & tables, company profiles, segment-wise forecasts, and more.
Connect with our Expert


Copyright @ 2026 Research Nester. All Rights Reserved.
