Industrial Cleaning Chemicals Market Outlook:
Industrial Cleaning Chemicals Market size was valued at USD 58.9 billion in 2025 and is projected to reach USD 111.6 billion by the end of 2035, rising at a CAGR of 6.6% during the forecast period, i.e., 2026-2035. In 2026, the industry size of industrial cleaning chemicals is estimated at USD 62.7 billion.
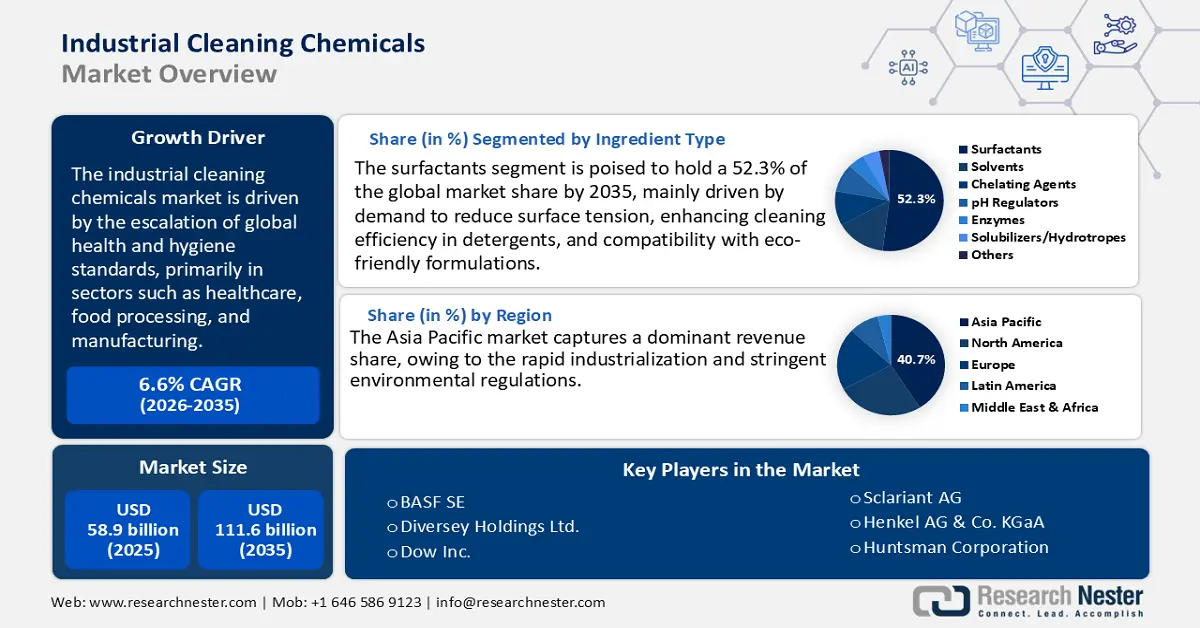
The industrial cleaning chemicals market is growing strongly, mainly due to the increasing emphasis on health and hygiene standards in critical sectors such as health, food processing, and production. Regulators such as the US Labor Safety and Health Service (OSHA) and the Environmental Protection Agency (EPA) are stepping up monitoring and forcing industries to adopt advanced cleaning products that meet strict safety and environmental criteria. OSHA has a sanitary standard (29 CFR 1910.141) which prescribes regular and effective cleaning at the workplace, thus increasing the consistent demand for disinfectants and disinfectants. The Safer Choice program, with more than 2,000 certified eco-friendly chemical formulations, ensures the purchase of sustainable cleaning solutions. As reported by the US Census Bureau, the yearly survey concerning chemical manufacturing experienced an increase of 11.4% from 2020 to 2023.
Producer Price Index by Industry: Chemical Manufacturing
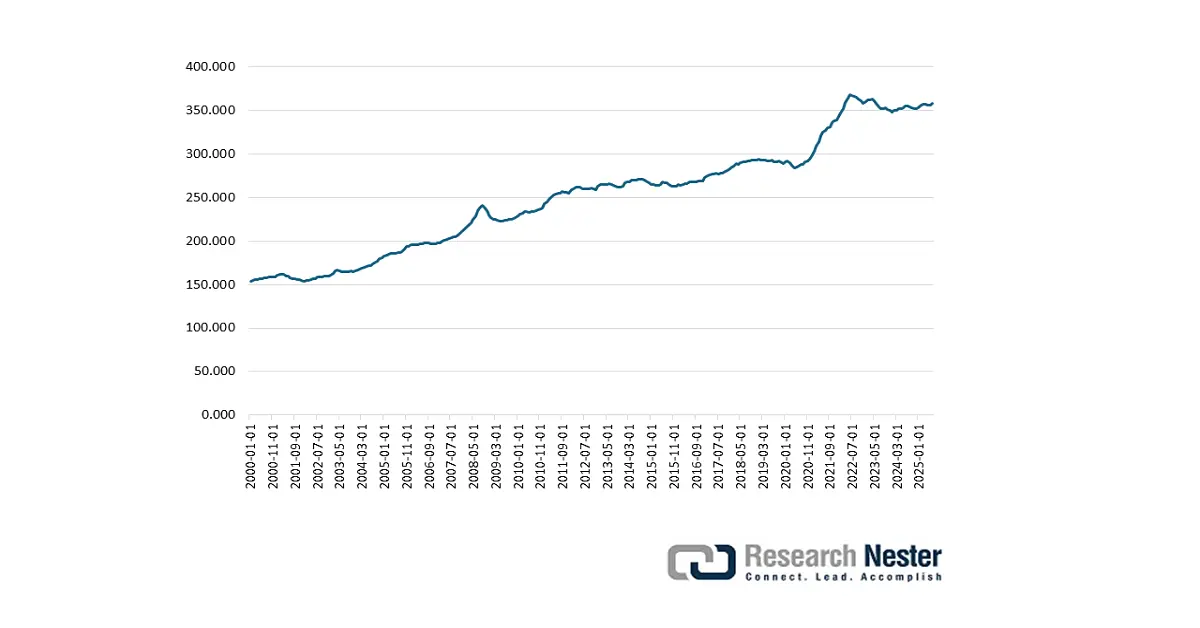
Source: FRED
The stable supply chain of raw materials, in petrochemical derivatives such as ethylene and ethane, is expected to have a positive influence on the production economy. The US Energy Information Administration (EIA) noted that the ethylene and ethane consumption stood at 2.36 million/barrels per day in the fourth quarter of 2025. Further, the Federal Reserve Bank of St. Louis reported that the producer price index for chemical production was calculated at 357.756 in July 2025. The state-sponsored incentives for low-VOC formulations and automated blending infrastructure are expected to drive investments in the industrial cleaning chemical production.
Key Industrial Cleaning Chemicals Market Insights Summary:
Regional Highlights:
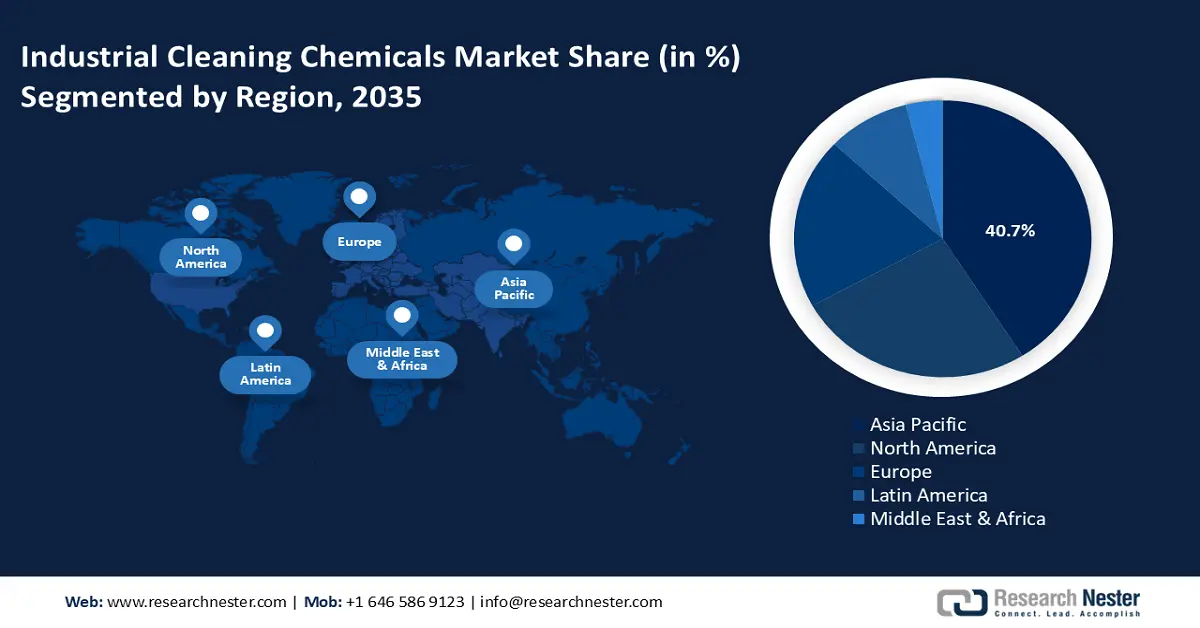
- The Asia Pacific industrial cleaning chemicals market is anticipated to capture around 40.7% of global revenue share by 2035, driven by rapid industrialization, stringent environmental regulations, and strong demand from food, pharmaceutical, and electronics sectors.
- The North America market is expected to hold 24% of the global revenue share by 2035, fueled by advanced industrial infrastructure, strict regulatory compliance, and high adoption across healthcare, food, and pharmaceutical industries.
Segment Insights:
- The surfactants segment of the industrial cleaning chemicals Market is projected to dominate with a 52.3% share by 2035, propelled by their critical role in reducing surface tension and aligning with the growing preference for eco-friendly cleaning solutions.
- The healthcare sector is anticipated to capture a 38% share by 2035, driven by the increasing emphasis on infection control and compliance with stringent sanitation standards such as cGMP and ISO 14644.
Key Growth Trends:
- Growth of industrial and institutional (I&I) cleaning demand
- Green chemical trend
Major Challenges:
- Stringent environmental regulations and compliance costs
- Pricing pressures due to raw material volatility and regulatory tariffs
Key Players: Ecolab Inc., BASF SE, Akzo Nobel N.V., Solvay S.A., Dow Inc., Clariant AG, Kao Corporation, Henkel AG & Co. KGaA, Huntsman Corporation, LG Chem Ltd., UPL Limited, Clorox Company, Arkema S.A., BASF Malaysia Sdn. Bhd., Mitsui Chemicals, Inc.
Global Industrial Cleaning Chemicals Market Forecast and Regional Outlook:
Market Size & Growth Projections:
- 2025 Market Size: USD 58.9 billion
- 2026 Market Size: USD 62.7 billion
- Projected Market Size: USD 111.6 billion by 2035
- Growth Forecasts: 6.6% CAGR (2026-2035)
Key Regional Dynamics:
- Largest Region: Asia Pacific (40.7% Share by 2035)
- Fastest Growing Region: Europe
- Dominating Countries: China, United States, Germany, Japan, India
- Emerging Countries: South Korea, France, Canada, Australia, Singapore
Last updated on : 9 September, 2025
Industrial Cleaning Chemicals Market - Growth Drivers and Challenges
Growth Drivers
- Growth of industrial and institutional (I&I) cleaning demand: Post-pandemic hygiene protocols have strengthened the long-term demand for healthcare, food processing, and institutional facilities. The Centers for Disease Control and Prevention (CDC) recommends disinfection and sterilization in healthcare facilities, which indirectly fuels the sales of large quantities of industrial cleaning products. According to the Federal Reserve Bank of St. Louis, the producer price index for chemicals and allied products, including soaps & detergents, commercial, industrial, and institutional, stood at 360.945 in July 2025. Thus, strict sterilization standards are directly fueling the consumption of cleaning chemicals.
- Green chemical trend: The sustainability and green chemical trends are expected to boost the sales of biodegradable cleaning chemicals. The bio-based surfactants and solvent-free degreasers are estimated to gain traction in the years ahead. Compared to petrochemical-based surfactants, green alternatives are readily biodegradable and often have lower toxicity. Bio-based surfactants are widely used in clean-in-place (CIP) and hard surface cleaning as they deliver strong wetting and emulsification while meeting sustainability targets. In September 2023, Dow, in a strategic collaboration with LanzaTech Global, Inc., introduced a readily biodegradable cleaning solution that utilizes circular carbon capture technology for home care. This indicates that key players are also investing heavily in innovations to introduce bio-based cleaning solutions.
- Technological developments: The ongoing technological advancements are anticipated to fuel the sales of industrial cleaning chemicals. The integration of IoT-enabled dosing systems and smart sensors is expected to drive control in chemical use in cleaning product use. The automated equipment and technologies are also set to boost the production of industrial cleaning chemicals. Advanced technologies reduce wastage and guarantee compliance with strict regulatory standards. Technological trends are likely to create premium opportunities for industrial cleaning chemical manufacturers in the years ahead.
Challenges
- Stringent environmental regulations and compliance costs: Industrial cleaning chemicals frequently include hazardous materials that are governed by stringent environmental regulations globally. Adhering to regulations such as the EU’s REACH (Registration, Evaluation, Authorization, and Restriction of Chemicals) and the U.S. EPA’s Toxic Substances Control Act (TSCA) results in significant expenses for manufacturers. The small enterprises and start-ups often deters from trending opportunities due to complex and stringent environmental regulations.
- Pricing pressures due to raw material volatility and regulatory tariffs: The raw materials used in industrial cleaning chemicals, such as surfactants and solvents, experience price fluctuations caused by disruptions in the supply chain. Additionally, government tariffs further complicate global pricing models. Thus, small players are often challenged by pressure margins and limited expansion.
Industrial Cleaning Chemicals Market Size and Forecast:
| Report Attribute | Details |
|---|---|
|
Base Year |
2025 |
|
Forecast Year |
2026-2035 |
|
CAGR |
6.6% |
|
Base Year Market Size (2025) |
USD 58.9 billion |
|
Forecast Year Market Size (2035) |
USD 111.6 billion |
|
Regional Scope |
|
Industrial Cleaning Chemicals Market Segmentation:
Ingredient Type Segment Analysis
The surfactants segment is expected to lead the global industrial cleaning chemicals market, representing around 52.3% of the overall share. This robust market presence is attributed to the essential function of surfactants in lowering surface tension, which significantly improves the cleaning effectiveness of industrial detergents and formulations. Moreover, their compatibility with environmentally friendly products corresponds with the increasing demand for sustainable solutions. The growing use of bio-based surfactants, such as methyl ester ethoxylates, is also being driven by regulatory pressures, especially from the U.S. Environmental Protection Agency (EPA), which requires reductions in volatile organic compound (VOC) emissions in various industrial applications.
End user Segment Analysis
The healthcare sector is projected to account for 38% of the global industrial cleaning chemicals market share, owing to the essential requirement for strict hygiene and infection control measures. The Centers for Disease Control and Prevention states that on any day, about 1 out of every 31 hospital patients has an infection they got while in the hospital. This highlights the necessity for effective disinfectants and sanitizers. Regulatory guidelines such as the U.S. FDA’s current Good Manufacturing Practices (cGMP) and ISO 14644 standards for cleanroom settings further necessitate that healthcare facilities uphold stringent sanitation protocols. These elements are significantly enhancing the demand for specialized cleaning chemicals aimed at ensuring patient safety and adhering to rigorous regulatory compliance standards.
Product Type Segment Analysis
The general & medical device cleaners segment is expected to hold a leading market share throughout the forecast period. The factors fueling the use of general & medical device cleaners are their vital role in ensuring hygiene and safety. Industries such as healthcare, pharmaceuticals, and biotechnology are leading the use of general & medical device cleaners. The general cleansers are also used in other industries, such as manufacturing and commercial offices. For example, the U.S. Bureau of Labor Statistics discloses that around 2,172,500 janitors and cleaners, except maids and housekeeping cleaners, were employed in May 2023. This directly indicates a high demand for industrial cleaning chemicals.
Our in-depth analysis of the industrial cleaning chemicals market includes the following segments:
|
Segment |
Subsegments |
|
Ingredient Type |
|
|
Product Type |
|
|
End user |
|
|
Form |
|

Vishnu Nair
Head - Global Business DevelopmentCustomize this report to your requirements — connect with our consultant for personalized insights and options.
Industrial Cleaning Chemicals Market - Regional Analysis
Asia Pacific Market Insights
The Asia Pacific industrial cleaning chemicals market is anticipated to capture around 40.7% of the global revenue share by 2035, due to the swift industrialization and rigorous environmental regulations. The government spending on sustainable chemical technologies is increasing at a high pace in the region. The strong presence of industries such as food and beverage processing, pharmaceuticals, and electronics manufacturing is significantly boosting the consumption of industrial cleaning chemicals. The shift toward sustainable, bio-based formulations is further expected to propel the demand for green cleaning chemicals. The increasing hygienic importance and domestic production of chemicals are likely to boost foreign direct investments (FDIs) in the region.
The India industrial cleaning chemicals market is expected to increase at the fastest CAGR from 2026 to 2035. The growing hygiene awareness and regulatory tightening across key end use sectors are propelling the demand for cleaning chemicals. The India Brand Equity Foundation (IBEF) reports that the FDI inflows in the chemicals sector other than fertilizers totaled USD 23.2 billion in FY25. Many specialty chemical companies are expanding their operation in the country to meet the domestic and overseas needs. Furthermore, IBEF also reveals that the government earmarked around USD 18.7 billion for the Ministry of Chemicals and Fertilizers under the Union Budget 2025-26. The supportive government funding and policies are poised to accelerate the production and commercialization of industrial cleaning chemicals.
North America Market Insights
The North America industrial cleaning chemicals market is expected to hold 24% of the global revenue share throughout the study period. The stringent regulatory frameworks and advanced industrial infrastructure are propelling the trade of industrial cleaning chemicals. The healthcare, food and beverage, and pharmaceutical sectors are some of the leading end users of industrial cleaning chemicals in the region. Compliance with U.S. Environmental Protection Agency (EPA), the Occupational Safety and Health Administration (OSHA), and Food and Drug Administration (FDA) standards, as well as the Canadian Environmental Protection Act (CEPA), is driving ed users to invest in effective cleaning solutions.
The U.S. leads the sales of industrial cleaning chemicals, owing to the strong presence of extensive healthcare infrastructure and advanced pharmaceutical production facilities. The strict cleaning and disinfecting protocols are promoting the consumption of cleaning chemicals. The country’s large aerospace and defense industry also relies on high-performance degreasers and corrosion inhibitors for advanced alloys and composite materials, which substantially contribute to the overall market growth. Further, the sustainability trend is likely to push the adoption of bio-based surfactants and PFAS-free cleaners in the years ahead.
Europe Market Insights
The Europe industrial cleaning chemicals market is foreseen to expand at the fastest CAGR between 2026 to 2035, due to the strict regulatory oversight and presence of the advanced manufacturing sectors. The strong emphasis on sustainability is also estimated to drive the sales of biodegradable cleaning solutions. Food and beverage processing and pharmaceutical and healthcare sectors are leading the sales of industrial cleaning chemicals. The rapidly expanding automotive production is also contributing to high consumption of degreasers and cleaners. Germany, France, and the U.K. are the most lucrative markets for industrial cleaning chemical investors.
The sales of industrial cleaning chemicals in Germany are set to be driven by its dominant pharmaceutical, food processing, and automotive sectors. The stringent regulations focused on ensuring hygiene standards are creating a profitable environment for specialized cleaning chemical producers. The report by Trade & Invest discloses that around 4.1 million passenger cars and 351,000 commercial vehicles were produced in the country in 2024. This indicates that automotive and aerospace enterprises both fuel a high demand for specialty degreasers and PFAS-free metal cleaners to protect high-performance materials.
Key Industrial Cleaning Chemicals Market Players:
- Ecolab Inc.
- Company Overview
- Business Strategy
- Key Product Offerings
- Financial Performance
- Key Performance Indicators
- Risk Analysis
- Recent Development
- Regional Presence
- SWOT Analysis
- BASF SE
- Akzo Nobel N.V.
- Solvay S.A.
- Dow Inc.
- Clariant AG
- Kao Corporation
- Henkel AG & Co. KGaA
- Huntsman Corporation
- LG Chem Ltd.
- UPL Limited
- Clorox Company
- Arkema S.A.
- BASF Malaysia Sdn. Bhd.
- Mitsui Chemicals, Inc.
The industrial cleaning chemical sector is fiercely competitive, with major multinational companies primarily from the USA, Europe, and Asia leading the charge. Key players such as Ecolab and BASF are concentrated on sustainable product innovation, the digital transformation of cleaning operations, and the broadening of their green chemistry offerings to comply with strict environmental standards. Companies from Japan and South Korea, including Kao Corporation and LG Chem, emphasize the development of environmentally friendly formulations. Meanwhile, Indian and Malaysian companies, such as UPL Limited and BASF Malaysia, capitalize on local manufacturing benefits and government support to enhance their market presence. Ongoing strategic partnerships, acquisitions, and investments in research and development are essential for maintaining market dominance and facilitating regional growth.
The table below describes the top industrial cleaning chemical manufacturers along with their share in the global market:
Recent Developments
- In March 2025, Evonik announced that it had entered into an exclusive agreement with the Cleveland-based Sea-Land Chemical Company for the distribution of its cleaning solutions in the U.S. This deal is set to make its eco-friendly, advanced cleaning products more available across the U.S.
- In September 2024, Zep, Inc. unveiled the launch of three new products at Lowe's Home Improvement stores nationwide. These new products are, namely, the Industrial Purple Degreaser & Cleaner Mist, the Heavy-Duty Citrus Degreaser & Cleaner Mist, and the Outdoor Foaming Cleaner & Brightener.
- Report ID: 2763
- Published Date: Sep 09, 2025
- Report Format: PDF, PPT
- Explore a preview of key market trends and insights
- Review sample data tables and segment breakdowns
- Experience the quality of our visual data representations
- Evaluate our report structure and research methodology
- Get a glimpse of competitive landscape analysis
- Understand how regional forecasts are presented
- Assess the depth of company profiling and benchmarking
- Preview how actionable insights can support your strategy
Explore real data and analysis
Frequently Asked Questions (FAQ)
About this Report
Connect with our Expert


Copyright @ 2026 Research Nester. All Rights Reserved.
