Hydrogenation Catalyst Market Outlook:
Hydrogenation Catalyst Market size was valued at USD 4.4 billion in 2025 and is poised to reach USD 10.1 billion by the end of 2035, growing at around 8.6% CAGR during the forecast period, i.e., 2026-2035. In 2026, the industry size of hydrogenation catalyst is assessed at USD 4.8 billion.
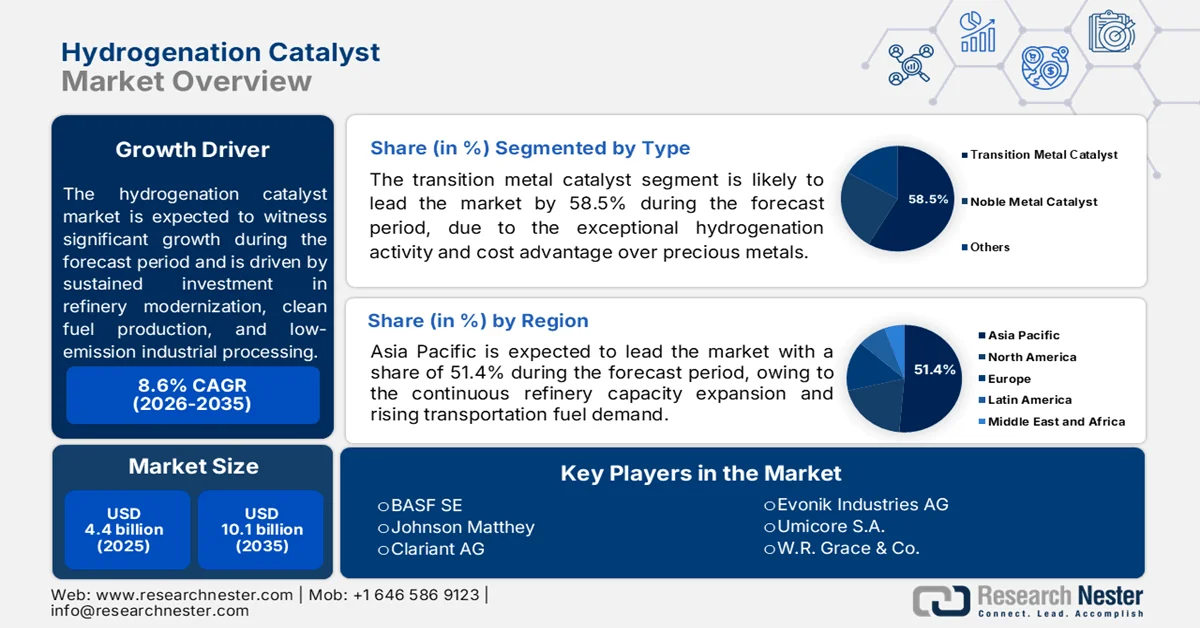
The hydrogenation catalyst market is supported by sustained investment in refinery modernization, clean fuel production, and low-emission industrial processing. According to the EIA June 2025 data, the U.S. refinery capacity exceeded 18.4 million barrels per day, with the refiners continuing to expand the hydroprocessing operations to comply with stricter sulfur reduction requirements in the transportation fuels. The International Energy Agency's February 2025 data reported that the global hydrogen demand reached approximately 97 million metric tons in 2023, with refining and chemical manufacturing accounting for the majority of consumption. This has increased procurement requirements for nickel, palladium, platinum, and ruthenium-based catalyst systems used in desulfurization, hydrogenation, and petrochemical upgrading operations.
Besides, the market is also benefiting from regulatory pressure on emissions-intensive sectors and the scaling of bio-based feedstock processing. The NPR October 2023 data indicates that nearly USD 7 billion is allocated for regional clean hydrogen hubs to accelerate industrial hydrogen deployment, and on the other hand, the European Commission’s Hydrogen Bank mechanism introduced multi-billion-euro support programs for renewable hydrogen supply chains. These initiatives are increasing investments in catalytic upgrading technologies for renewable diesel, hydrotreated vegetable oil, and synthetic fuel production. According to the International Energy Agency 2023 data, the global biofuel demand is expected to expand by nearly 30% between 2023 and 2028, reinforcing catalyst consumption in fuel conversion units. Manufacturers are therefore prioritizing catalyst durability, metal recovery efficiency, and process selectivity to reduce operational costs and improve throughput in large-scale continuous processing environments.
Key Hydrogenation Catalyst Market Insights Summary:
Regional Highlights:
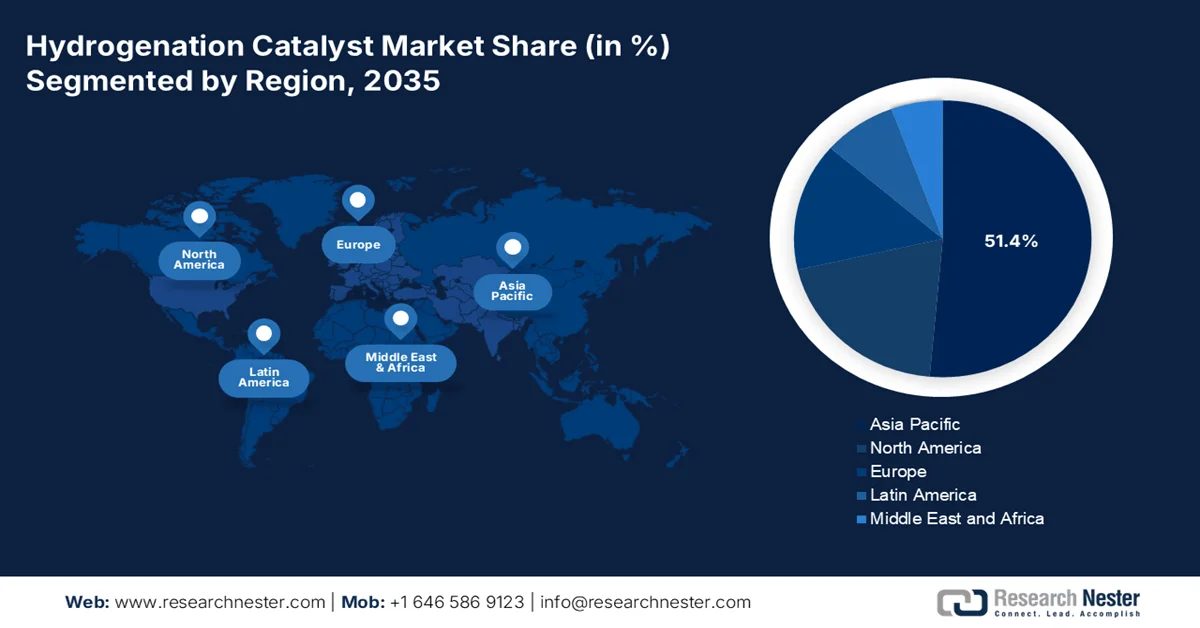
- The hydrogenation catalyst market in Asia Pacific is projected to account for 51.4% revenue share by 2035, fueled by continuous refinery capacity expansion and rising investments in hydroprocessing and renewable diesel integration across China, India, and Southeast Asia
- North America is forecast to witness rapid growth in the market throughout 2026-2035, attributed to increasing refinery conversions toward renewable diesel production and stringent environmental compliance requirements
Segment Insights:
- The hydrogenation catalyst market transition metal catalysts segment is anticipated to capture 58.5% share by 2035, propelled by rising adoption of nickel-based catalysts for renewable diesel, green jet fuel, and bio-based chemical production
- The refinery hydrotreating sub-segment is expected to maintain its dominance through 2035, stimulated by expanding distillate hydrotreating and hydrocracking capacities to support low-sulfur fuel production
Key Growth Trends:
- Rising refinery utilization
- Fertilizer investments supporting ammonia
Major Challenges:
- High precious metal price volatility
- Stringent environmental regulations
Key Players: BASF SE, Johnson Matthey, Clariant AG, Evonik Industries AG, Umicore S.A., W.R. Grace & Co., Albemarle Corporation, Haldor Topsoe A/S, Axens S.A., Honeywell UOP, Dow Inc., Cataler Corporation and others.
Global Hydrogenation Catalyst Market Forecast and Regional Outlook:
Market Size & Growth Projections:
- 2025 Market Size: USD 4.4 billion
- 2026 Market Size: USD 4.8 billion
- Projected Market Size: USD 10.1 billion by 2035
- Growth Forecasts: 8.6% CAGR (2026-2035)
Key Regional Dynamics:
- Largest Region: Asia Pacific (51.4% Share by 2035)
- Fastest Growing Region: North America
- Dominating Countries: China, United States, India, Germany, Japan
- Emerging Countries: Indonesia, Vietnam, Malaysia, Brazil, Saudi Arabia
Last updated on : 21 May, 2026
Hydrogenation Catalyst Market - Growth Drivers and Challenges
Growth Drivers
- Rising refinery utilization: Petrochemical refinery throughput and the fuel quality requirements are driving the hydrogenation catalyst market. According to the U.S. Energy Information Administration, May 2026 data, U.S. crude oil refinery inputs averaged 16.4 million barrels per day while the refineries operated at 91.7% of operable capacity. Gasoline production also increased to 9.8 million barrels per day during the same period. Higher refinery utilization increases the need for the hydroprocessing and desulfurization activities that depend on the hydrogenation catalysts to remove the sulfur compounds and improve the fuel stability. Refiners are also investing in the catalyst systems that improve the conversion efficiency and optimize petrochemical feedstock yields, particularly as governments continue enforcing low-emission fuel standards and cleaner industrial processing requirements.
Refinery Activity (Thousands Barrel Per Day), 2026
|
|
5/8/26 |
5/1/26 |
5/9/25 |
|
Crude Oil Input to Refineries |
16,121 |
16,032 |
16,110 |
|
Refinery Capacity Utilization (Percent) |
90.1 |
89.6 |
89.0 |
|
Motor Gasoline Production |
9,816 |
9,810 |
9,656 |
|
Distillate Fuel Oil Production |
4,900 |
4,919 |
4,616 |
Source: EIA May 2026
- Fertilizer investments supporting ammonia: Rising government expenditure on fertilizer production is supporting demand for hydrogenation catalysts, which are used in ammonia synthesis and downstream chemical processing. As per the PIB August 2025 data, nearly USD 23.0 billion is allocated to the Department of Fertilizers via supplementary demands for grants approved by parliament, reflecting continued emphasis on fertilizer supply security and domestic production expansion. Increased investment in fertilizer manufacturing infrastructure is driving higher utilization of ammonia plants, where hydrogenation catalysts are essential in hydrogen conversion and synthesis gas processing operations. Producers are also upgrading facilities to improve energy efficiency and production output amid rising agricultural demand. This trend is strengthening procurement of iron-, nickel-, and ruthenium-based catalyst systems across large-scale fertilizer and ammonia production facilities.
Challenges
- High precious metal price volatility: Extreme price fluctuations in palladium, platinum, and ruthenium create significant procurement risks and working capital pressures for manufacturers. Moreover, the sudden price spikes can delay purchasing decisions or encourage customers to choose catalyst regeneration over replacement, directly reducing fresh catalyst demand. This volatility particularly impacts specialty applications in pharmaceuticals and fine chemicals, where noble metal intensity is highest
- Stringent environmental regulations: Manufacturers must continuously adapt to tightening global fuel sulfur limits and renewable fuel mandates. Regulatory frameworks such as REACH in Europe and TSCA in the US impose strict registration, testing, and reporting requirements for catalyst chemical components. The complexity of maintaining compliance across multiple jurisdictions creates significant barriers for smaller entrants lacking dedicated regulatory teams.
Hydrogenation Catalyst Market Size and Forecast:
| Report Attribute | Details |
|---|---|
|
Base Year |
2025 |
|
Forecast Year |
2026-2035 |
|
CAGR |
8.6% |
|
Base Year Market Size (2025) |
USD 4.4 billion |
|
Forecast Year Market Size (2035) |
USD 10.1 billion |
|
Regional Scope |
|
Hydrogenation Catalyst Market Segmentation:
Type Segment Analysis
In the hydrogenation catalyst market, the type segment is dominated by transition metal catalysts and is poised to hold the share value of 58.5% by 2035. Nickel-based catalysts are driving the growth due to their exceptional hydrogenation activity and cost advantage over precious metals. Nickel serves as a critical element in the shift to sustainable energy systems, with demand projected to exceed 6 million tons annually by 2040, as per the NLM April 2025 study. This surge directly influences the hydrogenation catalyst sector, as nickel-based catalysts are essential for producing renewable diesel, green jet fuel, and bio-based chemicals via hydrodeoxygenation processes. Refineries upgrading to biofuels require high-performance nickel catalysts to remove oxygen from vegetable oils and waste fats. Moreover, the rising nickel demand reinforces the dominance of transition metal catalysts in enabling low-carbon fuel production.
Application Segment Analysis
Under the application segment, the refinery hydrotreating sub-segment is dominating in the hydrogenation catalyst market. The segment is experiencing significant demand from capacity expansion projects. According to the EIA August 2024 data, distillate hydrotreating capacity expansions in India total more than 600,000 barrels per day, with the hydrocracking expansions exceeding 200,000 barrels per day. These investments aim to increase production of low-sulfur distillate fuel oil, which constituted 35% of all liquid fuels consumed in India in 2023, double that of motor gasoline. Each new hydrotreater unit requires substantial quantities of hydrogenation catalysts, primarily nickel molybdenum and cobalt-molybdenum formulations, to remove sulfur and nitrogen. As refineries in India continue expanding both conventional and deep hydrotreating capacities to meet cleaner fuel mandates, the refinery hydrotreating sub-segment will remain the dominant application driver for hydrogenation catalysts.
End use Industry Segment Analysis
Within the end use industry segment, the oil & gas sector is dominating in the hydrogenation catalyst market. This sub-segment encompasses upstream gas purification, midstream hydrogenation of pyrolysis gasoline, and downstream refining operations, including hydrotreating and hydrocracking. Hydrogenation catalysts are essential for removing the sulfur, nitrogen, and aromatics from crude fractions, enabling the production of cleaner transportation fuels. Refineries increasingly rely on nickel and cobalt-based catalysts to process heavier crude slats and integrate renewable feedstocks. As oil & gas operators modernize existing facilities and expand hydroprocessing capacities, this sub-segment continues to drive bulk catalyst consumption and technological innovation across the hydrogenation catalyst market.
Our in-depth analysis of the hydrogenation catalyst market includes the following segments:
|
Segment |
Subsegments |
|
Type |
|
|
Application |
|
|
End use Industry |
|
|
Process |
|
|
Metal Group |
|
|
Form |
|
|
Production Method |
|

Vishnu Nair
Head - Global Business DevelopmentCustomize this report to your requirements — connect with our consultant for personalized insights and options.
Hydrogenation Catalyst Market - Regional Analysis
APAC Market Insights
Asia Pacific is dominating the hydrogenation catalyst market and is expected to capture the regional revenue share of 51.4% by the end of 2035. The market is driven by the driven by continuous refinery capacity expansion across China, India, and Southeast Asia. Rapid industrialization and rising transportation fuel demand sustain high utilization rates of hydrotreating and hydrocracking units. National oil companies in the region prioritize deep conversion projects to process heavier crude slates and produce ultra-low sulfur fuels meeting stricter environmental norms. Nickel-molybdenum and cobalt-molybdenum catalysts dominate consumption. Emerging economies like Indonesia, Vietnam, and Malaysia invest in new refining complexes with integrated hydroprocessing. Additionally, China and India aggressively expand renewable diesel and petrochemical integration, creating sustained demand for selective hydrogenation catalysts across both conventional and bio-based applications.
Government-backed carbon utilization and clean fuel initiatives are driving the hydrogenation catalyst market in India. As per the PIB October 2024 data, the NTPC’s research division, NETRA, in collaboration with the Indian Institute of Petroleum (IIP) Dehradun, developed an indigenous catalyst for hydrogenation of carbon dioxide into methanol, supporting domestic innovation in catalytic processing technologies. The pilot facility, designed to produce 10 kilograms of methanol per day, achieved methanol purity above 99%, demonstrating the commercial potential of locally developed catalyst systems for carbon capture utilization applications. These projects align with India’s broader decarbonization strategy and NTPC Green Energy Limited’s commitment to reducing greenhouse gas emissions and supporting India’s net zero target for 2070. Increasing investment in CO₂ conversion, green hydrogen, and synthetic fuel technologies is expected to strengthen long-term demand for hydrogenation catalysts across India’s energy and chemical sectors.
The Japan hydrogenation catalyst market is projected to grow from USD 510.3 million in 2025 to USD 845.6 million by the end of 2035 and will expand at a CAGR of 7.5%. In 2026, the market is projected to reach USD 525.6 million. The market is expanding due to rising hydrogen adoption, stringent fuel quality regulations, and growth in specialty chemical manufacturing. Japan aims to produce and import up to 3 million tons of hydrogen annually by 2030, increasing catalyst demand across refining, fuel processing, and hydrogen conversion applications, as per the JETRO February 2025 report. In addition, the Ministry of Economy, Trade, and Industry mandates an ultra-low sulfur fuel standard of 10 ppm, driving higher catalyst replacement rates in refinery desulfurization units. JAMA 2025 report indicated that Japan’s manufacturing shipments contributing 19.2%, supporting demand for selective hydrogenation processes in high-value chemical production.
North America Market Insights
The North America is projected to emerge rapidly in the hydrogenation catalyst market during the assessed period, 2026 to 2035. The market is driven by the shifting refining priorities and environmental compliance requirements. Refineries across the region continue to operate hydrotreating and hydrocracking units essential for producing cleaner transportation fuels, but overall refining capacity has seen selective rationalization. A significant trend is the conversion of conventional refineries into renewable diesel production facilities, which rely on nickel-based hydrogenation catalysts for the hydrodeoxygenation of vegetable oils, animal fats, and other bio feedstocks. The hydrogenation catalyst market is characterized by long-term supply contracts between major catalyst manufacturers and integrated oil companies, creating high barriers for new entrants. Regulatory drivers continue to favor advanced hydroprocessing solutions.
The sustained refinery processing activity and federal investment in clean industrial technologies is shaping the hydrogenation catalyst market in the U.S. According to the U.S. Energy Information Administration (EIA) June 2025 data the U.S. catalytic hydrocracking capacity remained above 2.2 million barrels per calendar day in 2025 while catalytic cracking fresh feed capacity exceeded 5 million barrels per day reflecting continued demand for hydroprocessing and fuel upgrading operations that rely on hydrogenation catalysts. The EIA June 2025 data also reported that the U.S. maintained 132 operable refineries in 2025, with major refiners including Marathon, Valero, and ExxonMobil implementing process efficiency improvements. Moreover, the U.S. government approved USD 1.7 billion for six industrial decarbonization projects, while final clean hydrogen tax credit rules under the Inflation Reduction Act supported investment in hydrogen-related processing infrastructure and catalyst-intensive technologies.
Downstream Charge Capacity (Barrels per Calendar Day), 2020-2025
|
|
2020 |
2021 |
2022 |
2023 |
2024 |
2025 |
|
Catalytic Reforming |
3,509,171 |
3,320,353 |
3,285,715 |
3,323,502 |
3,308,735 |
3,290,897 |
|
total Coking |
2,793,506 |
2,702,906 |
2,673,997 |
2,675,408 |
2,731,238 |
2,694,542 |
|
Catalytic Cracking - Fresh Feed |
5,573,398 |
5,189,568 |
5,089,089 |
5,063,828 |
5,078,119 |
5,099,771 |
|
Catalytic Hydro-Cracking |
2,296,131 |
2,219,689 |
2,237,826 |
2,211,475 |
2,226,438 |
2,201,801 |
Source: EIA June 2025
The investments in clean fuels, refinery modernization, and hydrogen production infrastructure are driving the hydrogenation catalyst market in Canada. According to the Government of Canada, in January 2026, the Clean Fuels Fund allocated more than USD 1.5 billion to expand domestic clean fuel production capacity, including renewable diesel and sustainable aviation fuel projects that require hydrogenation catalysts in hydroprocessing operations. Natural Resources Canada also reported that Canada’s hydrogen strategy could generate billions in annual domestic hydrogen-related revenues, accelerating industrial investment in catalytic hydrogen applications. In addition, the Government of Canada's February 2026 data stated that petroleum and coal product manufacturing revenues exceeded USD 9,663 million in 2024, reflecting continued refining and petrochemical processing activity. These developments are increasing demand for catalyst systems used in fuel upgrading, renewable fuel processing, specialty chemicals, and industrial hydrogen conversion applications.
Canada Government Investments Supporting the Hydrogenation Catalyst Market, 2026
|
Government Program / Initiative |
Investment / Funding |
Timeline / Status |
|
Clean Fuels Fund (CFF) |
USD 1.1 billion (CAD 1.5 billion) |
Announced in Budget 2021 |
|
Hydrogen Production Projects under CFF |
Over USD 220 million (CAD 300 million) across ~10 projects |
As of October 2023 |
|
Come By Chance Refinery Conversion Project |
Included under CFF support |
Ongoing |
|
Strategic Innovation Fund – Net Zero Accelerator (SIF-NZA) |
USD 220 million (CAD 300 million) for Air Products project; USD 11 million (CAD 15 million) for AVL Fuel Cell Canada |
Announced 2023–2024 |
|
Canada Growth Fund (CGF) |
USD 11 billion (CAD 15 billion) |
Announced in Fall 2022 Economic Statement |
|
Canada Infrastructure Bank (CIB) Hydrogen Initiative |
USD 367 million (CAD 500 million) |
Active Program |
|
Varennes Biorefinery and Hydrogen Electrolysis Project |
USD 203 million (CAD 277 million) financing |
Confirmed March 2023 |
|
Zero Emission Vehicle Infrastructure Program (ZEVIP) |
USD 499 million (CAD 680 million) |
Through 2029 |
|
Zero Emission Transit Fund (ZETF) |
USD 2 billion (CAD 2.75 billion) |
Active Program |
|
Zero-Emission Trucking Program (ZETP) |
USD 55 million (CAD 75 million) |
Active Program |
Source: Government of Canada January 2026
Europe Market Insights
The hydrogenation catalyst market in Europe is shaped by aggressive climate policy frameworks and refinery restructuring. The region continues to implement stringent fuel sulfur standards and carbon reduction mandates under the European Green Deal, directly influencing hydrotreating catalyst demand. However, multiple refinery closures across Western Europe, driven by the electrification of passenger vehicles and declining domestic crude processing, have shifted market dynamics toward export-oriented refining hubs and specialized biofuel production. Nickel and cobalt-based catalysts remain essential for co-processing renewable feedstocks alongside conventional crude fractions in remaining facilities. Catalyst suppliers focus on selective hydrogenation applications for circular economy processes, including plastic waste-derived pyrolysis oil upgrading. The market also sees growing demand for catalyst regeneration and precious metal recovery services as refiners prioritize cost optimization and supply chain security. Southern and Eastern European refineries serving diverse crude slats require customized catalyst solutions.
Strong investment in hydrogen infrastructure, refinery decarbonization, and industrial chemical production is shaping the hydrogenation catalyst market in Germany. According to the FNB GAS, in September 2022, Germany approved funding for hydrogen projects under the IPCEI Hydrogen program, exceeding EUR 8 billion, accelerating the deployment of hydrogen processing and industrial conversion technologies. The CEFIC January 2025 data reported that the country’s chemical-pharmaceutical industry generated turnover of EUR 655 billion in revenue, sustaining demand for selective hydrogenation catalysts in specialty chemicals and pharmaceutical manufacturing. In addition, Germany’s National Hydrogen Strategy targets 10 GW of domestic electrolysis capacity by 2030, as per the Federal Government's 2023, which significantly increased hydrogen-related industrial investments. These developments are strengthening the catalyst demand across refining, renewable fuels, petrochemicals, and industrial hydrogen conversion applications.
Large-scale government investment in low-carbon hydrogen infrastructure and production capacity expansion is driving the hydrogenation catalyst market in the UK. According to the UK Government's January 2024 data, the UK government confirmed support for 11 green hydrogen projects under Hydrogen Allocation Round 1, including GBP 90 million in capital grants through the Net Zero Hydrogen Fund and more than GBP 2 billion in revenue support through the Hydrogen Production Business Model. These projects are expected to become operational, increasing demand for hydrogenation catalysts used in hydrogen conversion, refining, and synthetic fuel production. The government’s target to achieve 10 GW of hydrogen production capacity by 2030, as per the Low Carbon Contracts Company 2026 data supported through the Contracts for Difference framework, is further accelerating investment in catalyst-intensive hydrogen processing technologies across the UK industrial sector.
Key Hydrogenation Catalyst Market Players:
- BASF SE (Germany)
- Johnson Matthey (UK)
- Clariant AG (Switzerland)
- Evonik Industries AG (Germany)
- Umicore S.A. (Belgium)
- W.R. Grace & Co. (U.S.)
- Albemarle Corporation (U.S.)
- Haldor Topsoe A/S (Denmark)
- Axens S.A. (France)
- Honeywell UOP (U.S.)
- Dow Inc. (U.S.)
- Cataler Corporation (Japan)
- JGC Catalysts and Chemicals (Japan)
- SK Innovation (South Korea)
- KPX Chemical Co., Ltd. (South Korea)
- IndianOil Corporation Ltd. (India)
- G Chem (South Korea)
- Magma Catalysts (India)
- Petronas Chemicals Group Berhad (Malaysia)
- Fujian Jinjiang Petrochemical (China)
- Company Overview
- Business Strategy
- Key Product Offerings
- Financial Performance
- Key Performance Indicators
- Risk Analysis
- Recent Development
- Regional Presence
- SWOT Analysis
- BASF SE is the dominating player in the hydrogenation catalyst market and uses its extensive R&D capabilities to offer a broad portfolio of high-performance catalysts for refining petrochemicals and fine chemicals. The company focuses on developing advanced copper chromite and nickel-based hydrogenation catalysts that improve selectivity and yield.
- Johnson Matthey holds a strong position in the hydrogenation catalyst market mainly via its innovative precious metal catalysts used in pharmaceutical and specialty chemical hydrogenations. The company has adopted a strategy of high-value customization and circular economy models, including precious metal recycling services. In 2024, the company made revenue of USD 16.56 billion.
- Clariant AG competes in the hydrogenation catalyst market by offering nickel, copper, and iron-based catalysts under product lines. The company’s strategic initiatives center on sustainability, including the development of catalysts for green chemistry and renewable diesel production. According to the 2025 Integrated Report, the company has made sales of USD 4.42 billion.
- Evonik Industries AG specializes in the hydrogenation catalyst market, fixed-bed and slurry phase hydrogenation catalysts mainly for fine chemicals and intermediates. The company differentiates itself via its Noblyst series of palladium and platinum catalysts, which offer high reusability and low metal leaching.
- Umicore S.A. is a key player in the hydrogenation catalyst market, renowned for its precious metal-based hydrogenation catalysts, including the ruthenium, rhodium, and palladium formulations. The company’s strategy revolves around the closed-loop metal management offering, catalyst leasing, recovery, and refining services to reduce costs and environmental impact.
Here is a list of key players operating in the global hydrogenation catalyst market:
The global hydrogenation catalyst market is moderately consolidated, with key players from North America, Europe, and the Asia Pacific driving the innovation via R&D and strategic expansions. Major companies focus on developing highly active selective catalysts to meet refining and petrochemical demands. Strategic initiatives include mergers and acquisitions, capacity expansions, and partnerships with downstream users. For example, in February 2026, Axens announced the successful closing of the acquisition of 100% of Eurecat. The shift towards bio-based feedstocks and cleaner fuels further intensifies the competition, prompting investments in next-generation catalysts for hydroprocessing and fine chemical synthesis.
Corporate Landscape of the Hydrogenation Catalyst Market:
Recent Developments
- In November 2025, Clariant received awards at the 2025 Gulf Energy Information Excellence Awards, Best Catalyst Technology for its chromium-free HySat catalyst platform for hydrogenation processes, and another was the Best Petrochemical Technology prize with its partner Linde for their jointly developed EDHOX Technology.
- In April 2025, Axens Catalyst Arabia Limited (ACAL) announced the expansion to manufacture Tail Gas Treatment Catalyst on the site. The company has completed the expansion of its Axens Catalyst Arabia Limited site, aimed at providing local and regional partners with the latest Tail Gas Treatment Catalysts, in addition to the site’s legacy catalyst hydroprocessing manufacturing capacity.
- In February 2025, Evonik announced the launch of Purocel™ products and catalyst technologies to improve the quality of pyrolysis oil, driving greater circularity for plastics. Moreover, the company is adopting an innovative series of adsorbents, hydrotreating catalysts, and polishing units for the purification of pyrolysis product streams
- Report ID: 3872
- Published Date: May 21, 2026
- Report Format: PDF, PPT
- Explore a preview of key market trends and insights
- Review sample data tables and segment breakdowns
- Experience the quality of our visual data representations
- Evaluate our report structure and research methodology
- Get a glimpse of competitive landscape analysis
- Understand how regional forecasts are presented
- Assess the depth of company profiling and benchmarking
- Preview how actionable insights can support your strategy
Explore real data and analysis
Frequently Asked Questions (FAQ)
About this Report
Connect with our Expert

Report, 2026-2035


Copyright @ 2026 Research Nester. All Rights Reserved.
