Gin Market Outlook:
Gin Market size was valued at USD 17.63 billion in 2025 and is estimated to reach USD 28.07 billion by the end of 2035, registering a CAGR of 4.8% during the forecast period, i.e., 2026-2035. In 2026, the industry size of gin is evaluated at USD 18.46 billion.
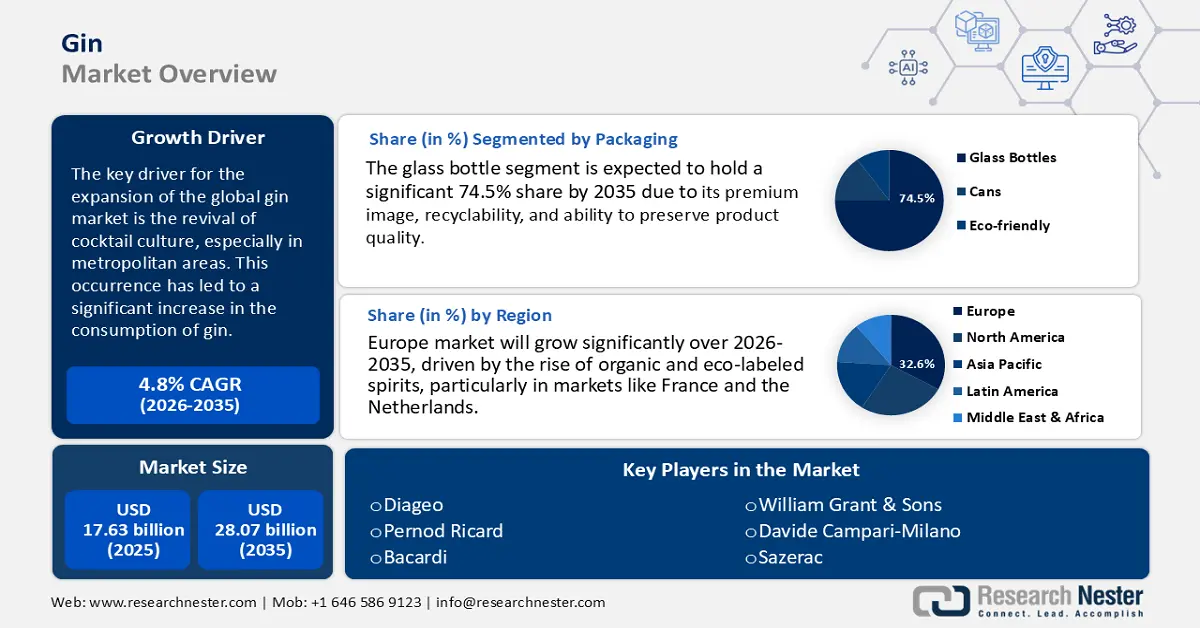
The key driver for the expansion of the global market is the revival of cocktail culture, especially in metropolitan areas. This occurrence has led to a significant increase in the consumption of gin. For example, in Hong Kong, the value of retained imports of spirits, including gin, increased by 30% in 2023 compared to the previous year, totaling $779 million, following the easing of pandemic-related restrictions. This increase reflects a strong demand for gin, driven by evolving consumer tastes and heightened social engagements.
The production of gin is heavily reliant on agricultural resources, including juniper berries and a variety of botanicals, within the supply chain. According to the U.S. Department of Agriculture, the United States stands as a prominent exporter of raw agricultural goods, which are vital for gin manufacturing. In April 2020, the Producer Price Index of Distilleries, which includes bottled gin, vodka, rum, cordials, and cocktails, was 104, according to the U.S. Bureau of Labor Statistics. On the consumer front, the Bureau of Labor Statistics monitors the Consumer Price Index (CPI) for distilled spirits, including gin, offering valuable insights into retail price movements. The U.S. government's dedication to R&D, as highlighted in budget documents, emphasizes the significance of innovation in sustaining competitiveness within the spirits market.
Key Gin Market Insights Summary:
Regional Insights:
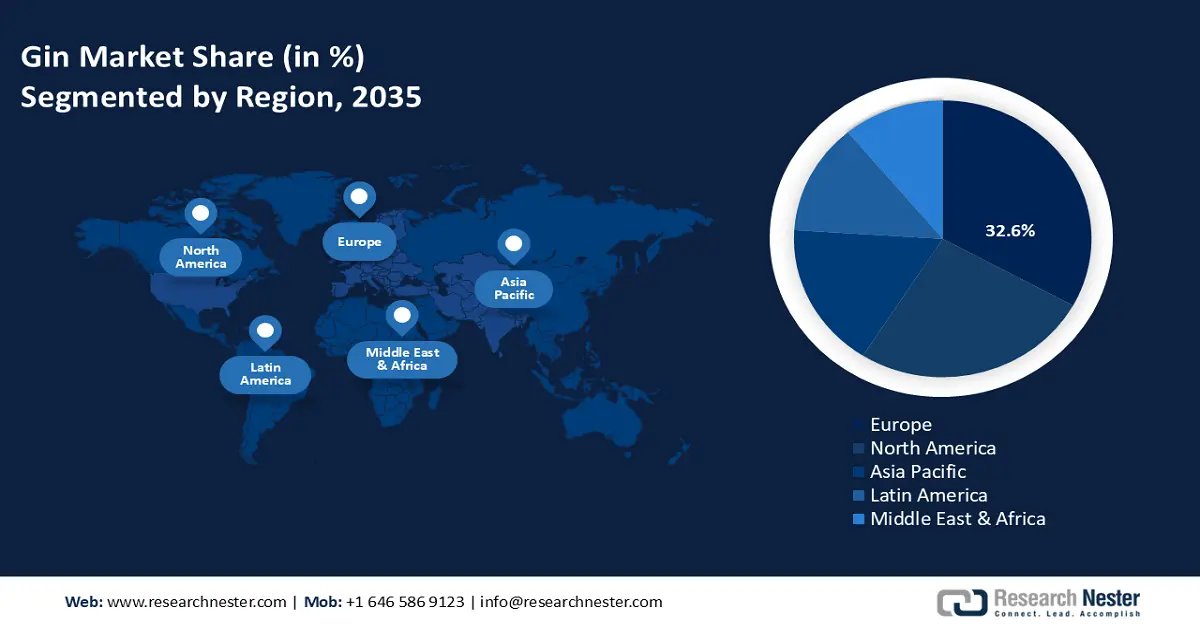
- By 2035, Europe is projected to command a 32.6% share of the global gin market, spurred by increasing demand for premium, environmentally friendly, and botanical-based spirits.
- By 2035, North America is expected to account for 28.5% of the market, underpinned by the increasing craft-distillery movement and cocktail culture.
Segment Insights:
- By 2035, the glass bottles segment in the gin market is projected to secure a 74.5% share, propelled by its upscale perception and recyclability.
- By 2035, the on-trade distribution sector is set to achieve a 38.5% revenue share, supported by the resurgence of Japan’s hospitality and tourism industries.
Key Growth Trends:
- Shift toward natural botanicals
- Advanced catalytic technologies
Major Challenges:
- Supply chain disruptions
- Rising production and energy costs
Key Players: BASF SE, Dow Inc., DuPont de Nemours, Inc., Solvay S.A., Evonik Industries AG, LG Chem Ltd., Sabic (Saudi Basic Industries Corporation), INEOS Group Ltd., SABIC Innovative Plastics US LLC, Reliance Industries Ltd., Petronas Chemicals Group Berhad, Orica Limited, Arkema S.A.
Global Gin Market Forecast and Regional Outlook:
Market Size & Growth Projections:
- 2025 Market Size: USD 17.63 billion
- 2026 Market Size: USD 18.46 billion
- Projected Market Size: USD 28.07 billion by 2035
- Growth Forecasts: 4.8% CAGR (2026-2035)
Key Regional Dynamics:
- Largest Region: Europe (32.6% Share by 2035)
- Fastest Growing Region: Asia Pacific
- Dominating Countries: – United States, United Kingdom, Germany, Japan, Canada
- Emerging Countries: – China, India, South Korea, Australia, Brazil
Last updated on : 28 August, 2025
Gin Market - Growth Drivers and Challenges
Growth Drivers
-
Shift toward natural botanicals: Consumer tastes in the gin industry are progressively leaning towards products enriched with natural botanicals like juniper, coriander, citrus peel, and assorted herbs. This trend corresponds with wider movements towards sustainability and clean-label ingredients. Consequently, producers are implementing sophisticated extraction techniques, such as CO₂ supercritical fluid extraction and water-based distillation, which remove the necessity for harmful solvents and greatly minimize chemical residues and waste. These environmentally friendly chemistry methods not only improve the purity and flavor profile of the product but also promote ecological objectives, enhancing brand value and fulfilling regulatory requirements in environmentally aware global markets.
-
Advanced catalytic technologies: The incorporation of sophisticated catalytic technologies into distillation methods has resulted in notable enhancements in energy efficiency. These advancements, which encompass catalytic distillation systems and heat-recovery stills, have effectively contributed to decreasing carbon emissions and lowering overall production expenses. By increasing throughput and providing cleaner, more refined outputs, these innovations are being increasingly embraced by mid-sized distilleries that seek to enhance operational efficiency and sustainability. As environmental regulations become more stringent and energy prices escalate, the implementation of such catalytic technologies enables producers to maintain competitiveness while fulfilling both economic and environmental performance standards.
-
Gin-based cocktail renaissance: The increasing demand for gin cocktails is driving gin growth in the market. In the U.S., 9 million 9-liter cases of gin were sold in 2023, generating just over $1 billion, according to the Distilled Spirits Council of the United States. The super-premium segment increased by an astounding 16%, underscoring consumer preferences for higher-quality and more versatile spirits. The wind in the market sails towards consumer-friendly drinks like the Negroni and the Gin & Tonic, helping gin build strength in both on-premise and off-premise areas.
Trade Data for Gin and Geneva
Top 5 Exporters of Gin and Geneva (2021)
|
Exporter |
Export Value (USD thousands) |
Quantity (Liters) |
|
United Kingdom |
744,891.23 |
133,909,000 |
|
European Union |
203,086.21 |
35,540,000 |
|
Germany |
95,807.99 |
16,766,400 |
|
Spain |
82,543.90 |
14,841,600 |
|
France |
75,562.29 |
13,223,400 |
Source: WITS
Top 5 Importers of Gin and Geneva
|
Importer |
Trade Value (USD thousands) |
Quantity (Liters) |
|
European Union |
490,606.83 |
47,788,000 |
|
United States |
416,057.06 |
43,661,400 |
|
Italy |
184,903.17 |
18,010,800 |
|
Spain |
120,415.68 |
11,729,300 |
|
Germany |
98,650.49 |
10,264,800 |
Source: WITS
Challenges
-
Supply chain disruptions: Gin is produced from botanicals such as juniper berries, citrus peels, and coriander. Many of these botanicals are sourced from around the world. Supply chain issues, often caused by political instability, climate change, or global shipping disruption, can cause these botanicals to be short in supply and raise ingredient costs. The COVID-19 pandemic has exposed these supply chain vulnerabilities, such as the availability of glass bottles and packaging material. Distillers now walk a fine line to balance the quality of gin with the [input] costs while creating distillate with consistent flavor profiles. Long-term disruptions could lead to a degraded sense of brand reputation if consistency in product quality and availability does not align with consumer expectations.
-
Rising production and energy costs: Gin production is also an energy-intensive process that relies on heating and cooling, as well as a system for measuring the quality of the distillate. Rising energy prices have not only affected energy costs, but inflation during the same time for raw materials and labor has greatly increased distilling costs. Smaller distillers, especially, feel pressure since they do not have the leverage of economies of scale to offset the costs of production without affecting their retail price. If a distiller is to offset costs solely based on a higher retail price, this reduction in competitiveness creates a great risk, especially in price-sensitive markets. Long-term sustainability may require a large capital expenditure to invest in new energy-efficient equipment and renewable energy.
Gin Market Size and Forecast:
| Report Attribute | Details |
|---|---|
|
Base Year |
2025 |
|
Forecast Year |
2026-2035 |
|
CAGR |
4.8% |
|
Base Year Market Size (2025) |
USD 17.63 billion |
|
Forecast Year Market Size (2035) |
USD 28.07 billion |
|
Regional Scope |
|
Gin Market Segmentation:
Packaging Type Segment Analysis
The glass bottles segment is expected to hold a significant 74.5% share by 2035 in the global gin market, attributed to its upscale perception, recyclability, and capacity to maintain product integrity. Glass improves brand visibility and attracts consumers, especially within the craft and premium gin sectors. Its inert characteristics guarantee that the gin’s flavor and alcohol content are preserved over time, making it the preferred option for both producers and consumers. Increasing environmental consciousness and regulatory encouragement for sustainable packaging further enhance demand. As the global market continues to grow, particularly in Europe and the Asia-Pacific region, glass bottles are projected to sustain their dominant status.
Distribution Channel Segment Analysis
The on-trade distribution sector is expected to lead with a 38.5% share of revenue by 2035, fueled by the resurgence of Japan's hospitality and tourism industries following the COVID pandemic, government tourism initiatives under the Inbound Consumption Expansion Plan by the Ministry of Economy, Trade and Industry (METI), and a growing presence of gin-specialty bars in metropolitan areas such as Tokyo and Osaka. Trends towards premiumization are also enhancing on-trade sales as bars aim to offer distinctive craft gins to attract both tourists and younger demographics.
Product Type Segment Analysis
The premium gin sector is expected to lead with a 30.2% share of revenue by 2035, due to increasing consumer preference for high-quality spirits offering complexity and quality botanicals. Growing preferences among millennials and urban consumers, and premiumization across alcoholic beverages, provide support for growth. Furthermore, Premium gin products also fit into the growing cocktail and mixology culture and are preferred by mixologists at premium bars and restaurants. In addition to this, premium products benefit from brand strength, attractive packaging, and further global exposure around travel retail, as compared to standard and craft/artisanal options.
Our in-depth analysis of the global gin market includes the following segments:
|
Segment |
Subsegments |
|
Packaging Type |
|
|
Distribution Channel |
|
|
Product Type |
|
|
Consumer Demographics |
|
|
Flavour Profile |
|

Vishnu Nair
Head - Global Business DevelopmentCustomize this report to your requirements — connect with our consultant for personalized insights and options.
Gin Market - Regional Analysis
Europe Market Insights
By the year 2035, Europe is anticipated to take the lead in the global gin market with a 32.6% market share, fueled by an increasing demand for premium, environmentally friendly, and botanical-based spirits. Consumption has experienced continual growth over the past few years, driven by the popularity of flavored and low-alcohol variants. The growth of gin consumption continues to occur in Spain, the U.K., and Germany, among others, with gin exports to markets outside of Europe increasing since 2020. Sustainable activities, including reduced bottle weight and sourcing local botanicals, are shaping brand positioning and product development.
Germany's gin market is being driven by premium gin products and consumer interest in unusual botanical combinations. The growth of domestic distilleries producing craft gin has also been significant, especially in Bavaria and Berlin, with interest from both local consumers and export buyers. Exports of German gin have been rising each year in volume, primarily to neighboring European countries. Trends in consumer demand are also being influenced by limited and seasonal offerings, sustainability initiatives, and increased use of organic botanicals and environmentally friendly packaging.
UK Exports of Gin and Geneva
|
Destination |
Export Value (1,000 USD) |
Quantity (Liters) |
|
United States |
269,013.48 |
29,457,000 |
|
Spain |
76,941.00 |
8,425,040 |
|
Italy |
76,624.90 |
8,390,430 |
|
Germany |
49,826.27 |
5,455,980 |
|
Canada |
31,159.72 |
3,411,990 |
Source: WITS
North America Market Insights
By the year 2035, it is anticipated that North America will represent 28.5% of the global gin market, due to increasing craft-distillery movement and cocktail culture. Small-batch producers are trying new things with native botanicals, barrel-aging, and specialty flavor infusions outside of normal juniper-driven gin. Both the U.S. and Canada have regulatory bodies involved in oversight of production standards and labeling. Major producers will continue to thrive alongside artisanal producers, and the premium and flavored gin categories will continue to grow with consumer preference changes.
In 2024, U.S. distilled spirits exports reached a record total of $2.4 billion, representing nearly a 10% increase from 2023. Among these, American Whiskeys, despite experiencing a 5.4% decline overall, still contributed over $1.3 billion in export value, accounting for 54% of the value and 33% of the volume. Gin exports grew by 32% in 2024 to $53 million, firmly establishing itself as one of the industry’s fastest-growing categories. Other notable segments included cordials, which surged 128% to $367 million, and vodka, which increased by 82% to $292 million. Conversely, exports of rum and brandy declined by 12% and 39%, respectively, amounting to $86 million and $23 million. The value of these exports has quintupled from $478 million to over $2.4 billion in 2024.
Asia Pacific Market Insights
By the year 2035, it is anticipated that the Asia Pacific will represent 17.5% of the global gin market, due to increasing consumer consumption of premium and craft spirits that are influenced by global cocktail culture. Mega trends, including urbanization, a growing middle class, and exposure to Western drinking styles, are increasing demand for novel flavors and the botanicals that create gin. More local distillers are using local ingredients such as yuzu, pandan, and lemongrass to reflect emerging tastes. In the Asia Pacific, e-commerce and specialty liquor sellers are increasingly providing access to more options, while local brands replacing or complementing international brands are supporting gin’s premium positioning in the region.
India Exports of Gin and Geneva (2022)
|
Export Destination |
Trade Value (USD thousands) |
Quantity (Liters) |
|
Togo |
1,003.55 |
662,970 |
|
United Arab Emirates |
638.13 |
86,274 |
|
Ghana |
423.42 |
331,438 |
|
United States |
383.66 |
33,838 |
|
Netherlands |
353.78 |
37,229 |
Source: WITS
Key Gin Market Players:
- BASF SE
- Company Overview
- Business Strategy
- Key Product Offerings
- Financial Performance
- Key Performance Indicators
- Risk Analysis
- Recent Development
- Regional Presence
- SWOT Analysis
- Dow Inc.
- DuPont de Nemours, Inc.
- Solvay S.A.
- Evonik Industries AG
- LG Chem Ltd.
- Sabic (Saudi Basic Industries Corporation)
- INEOS Group Ltd.
- SABIC Innovative Plastics US LLC
- Reliance Industries Ltd.
- Petronas Chemicals Group Berhad
- Orica Limited
- Arkema S.A.
The international market for gin chemicals is intensely competitive, influenced by innovation, adherence to regulations, and trends in sustainable production. Major companies such as BASF, Dow, and Solvay lead the market due to their diverse product offerings and proactive research and development in green chemistry. Strategic partnerships, particularly in Europe and Asia, are prevalent, with businesses aligning themselves with environmental initiatives such as REACH and the European Green Deal. New entrants from India and Malaysia, bolstered by government-supported innovation programs, are enhancing their bio-based chemical solutions to capture a larger share of the global market.
The table below presents the top 15 global manufacturers in the gin chemical market:
Recent Developments
- In April 2024, Toray Industries announced the development of spherical fine particles made from polyamide 4, intended to break down in marine ecosystems. The company intends to further its technological advancements for large-scale production and provide samples for use in sectors like cosmetics, where conventional alternatives face limitations. The product is anticipated to be launched in the market by March 2025.
- In September 2023, BASF unveiled the first biomass-balanced plastic additives in the industry, namely Irganox 1010 BMBcert and Irganox 1076 FD BMBcert. These additives have received certification from TÜV Nord by the ISCC PLUS standard, which guarantees sustainability in their production. This introduction seeks to substitute fossil feedstock with renewable resources in response to the increasing demand for sustainable chemical alternatives.
- Report ID: 55
- Published Date: Aug 28, 2025
- Report Format: PDF, PPT
- Explore a preview of key market trends and insights
- Review sample data tables and segment breakdowns
- Experience the quality of our visual data representations
- Evaluate our report structure and research methodology
- Get a glimpse of competitive landscape analysis
- Understand how regional forecasts are presented
- Assess the depth of company profiling and benchmarking
- Preview how actionable insights can support your strategy
Explore real data and analysis
Frequently Asked Questions (FAQ)
Gin Market Report Scope
Free Sample includes current and historical market size, growth trends, regional charts & tables, company profiles, segment-wise forecasts, and more.
Connect with our Expert


Copyright @ 2026 Research Nester. All Rights Reserved.
