Global Distributed Antenna System Market TOC
- An Introduction to the Research Study
- Preface
- Market Taxonomy
- Definition of the Market and the Segments
- Acronyms and Assumptions
- The Research Procedure
- Sources of Data
- Primary
- Secondary
- Calculation and Derivation of Market Size
- Top-Down Approach
- Bottom-up Approach
- Sources of Data
- Recommendation by Analyst for C-Level Executives
- An Abstract of the Report
- Evaluation of Market Fluctuations and Outlook
- Market Growth Drivers
- Market Growth Deflation
- Market Trends
- Fundamental Market Prospects
- Strategic Competitive Opportunities
- Geographic Opportunities
- Application Centric Opportunities
- Regulatory & Standards Landscape
- Decarbonization Strategy and Carbon Credit Benefits for Market Players
- Global Government Decarbonization Plans/Goals by Each Country under 2015 Agreement Agreed by 20 Countries
- Measures taken by Countries to Reduce Carbon Footprints
- Carbon Credits and Subsidy Plans/Benefits Rolled out by the Government for Market Players
- Effective Ways to Harness Carbon-Credits and Impact on Profit Margins
- Demand Impact on the Companies Opting for Carbon Credits
- Economic Outlook: Japan
- Limitations to Japan’s Economic Recovery
- Uplifting Policies to Foster the Growth of the Economy
- Future-Outlook and Strategic Move for Sustainable Economy
- Technological Shift and Implementation Analysis
- Industry Value Chain Analysis
- Regional Demand Analysis
- Industry Growth Outlook
- Use Case Analysis
- Global Distributed Antenna Systems Market Valuation, Business Viewpoint and Forecast, 2023-2036: Worldwide Factors Fostering the Industry Growth
- Market Summary
- Market Value (USD Million) Current and Future Projections, 2023-2036
- Market Increment $ Opportunity Assessment, 2023-2036
- Year on Year Growth Forecast (%)
- Global Distributed Antenna Systems Market Valuation, Business Viewpoint and Forecast by Offering, 2023-2036
- Component, Market Value (USD Million) Current and Future Projections, 2023-2036
- Services, Market Value (USD Million) Current and Future Projections, 2023-2036
- Global Distributed Antenna Systems Market Valuation, Business Viewpoint and Forecast by Coverage, 2023-2036
- Indoor, Market Value (USD Million) Current and Future Projections, 2023-2036
- Outdoor, Market Value (USD Million) Current and Future Projections, 2023-2036
- Global Distributed Antenna Systems Market Valuation, Business Viewpoint and Forecast by User Facilities, 2023-2036
- > 500K SQ.FT, Market Value (USD Million) Current and Future Projections, 2023-2036
- 200K – 500K SQ.FT, Market Value (USD Million) Current and Future Projections, 2023-2036
- < 200K SQ.FT, Market Value (USD Million) Current and Future Projections, 2023-2036
- Global Distributed Antenna Systems Market Valuation, Business Viewpoint and Forecast by Ownership, 2023-2036
- Carrier, Market Value (USD Million) Current and Future Projections, 2023-2036
- Neutral-host, Market Value (USD Million) Current and Future Projections, 2023-2036
- Enterprise, Market Value (USD Million) Current and Future Projections, 2023-2036
- Global Distributed Antenna Systems Market Valuation, Business Viewpoint and Forecast by Vertical, 2023-2036
- Commercial, Market Value (USD Million) Current and Future Projections, 2023-2036
- Public Safety, Market Value (USD Million) Current and Future Projections, 2023-2036
- Global Distributed Antenna Systems Market Valuation, Business Viewpoint and Forecast by Region, 2023-2036
- North America, Market Value (USD Million) Current and Future Projections, 2023-2036
- Latin America, Market Value (USD Million) Current and Future Projections, 2023-2036
- Europe, Market Value (USD Million) Current and Future Projections, 2023-2036
- Asia Pacific Excluding Japan, Market Value (USD Million) Current and Future Projections, 2023-2036
- Japan, Market Value (USD Million) Current and Future Projections, 2023-2036
- Middle East & Africa, Market Value (USD Million) Current and Future Projections, 2023-2036
- Cross Analysis of Coverage w.r.t. User Facilities (USD Million), 2023
- Global Distributed Antenna Systems Market Valuation, Business Viewpoint and Forecast by Offering, 2023-2036
- North America Distributed Antenna Systems Market Valuation, Business Viewpoint and Forecast by Region, 2023-2036
- Outline of the Segment
- Detailed Overview
- Year-on-Year Growth Forecast (%)
- North America Distributed Antenna Systems Market Valuation, Business Viewpoint and Forecast by Offering, 2023-2036
- Component, Market Value (USD Million) Current and Future Projections, 2023-2036
- Services, Market Value (USD Million) Current and Future Projections, 2023-2036
- North America Distributed Antenna Systems Market Valuation, Business Viewpoint and Forecast by Coverage, 2023-2036
- Indoor, Market Value (USD Million) Current and Future Projections, 2023-2036
- Outdoor, Market Value (USD Million) Current and Future Projections, 2023-2036
- North America Distributed Antenna Systems Market Valuation, Business Viewpoint and Forecast by User Facilities, 2023-2036
- > 500K SQ.FT, Market Value (USD Million) Current and Future Projections, 2023-2036
- 200K – 500K SQ.FT, Market Value (USD Million) Current and Future Projections, 2023-2036
- < 200K SQ.FT, Market Value (USD Million) Current and Future Projections, 2023-2036
- North America Distributed Antenna Systems Market Valuation, Business Viewpoint and Forecast by Ownership, 2023-2036
- Carrier, Market Value (USD Million) Current and Future Projections, 2023-2036
- Neutral-host, Market Value (USD Million) Current and Future Projections, 2023-2036
- Enterprise, Market Value (USD Million) Current and Future Projections, 2023-2036
- North America Distributed Antenna Systems Market Valuation, Business Viewpoint and Forecast by Vertical, 2023-2036
- Commercial, Market Value (USD Million) Current and Future Projections, 2023-2036
- Public Safety, Market Value (USD Million) Current and Future Projections, 2023-2036
- North America Distributed Antenna Systems Market Valuation, Business Viewpoint and Forecast by Country, 2023-2036
- US, Market Value (USD Million) Current and Future Projections, 2023-2036
- Canada, Market Value (USD Million) Current and Future Projections, 2023-2036
- North America Distributed Antenna Systems Market Valuation, Business Viewpoint and Forecast by Offering, 2023-2036
- Latin America Distributed Antenna Systems Market Valuation, Business Viewpoint and Forecast by Region, 2023-2036
- Outline of the Segment
- Detailed Overview
- Year-on-Year Growth Forecast (%)
- Latin America Distributed Antenna Systems Market Valuation, Business Viewpoint and Forecast by Offering, 2023-2036
- Latin America Distributed Antenna Systems Market Valuation, Business Viewpoint and Forecast by Coverage, 2023-2036
- Latin America Distributed Antenna Systems Market Valuation, Business Viewpoint and Forecast by User Facilities, 2023-2036
- Latin America Distributed Antenna Systems Market Valuation, Business Viewpoint and Forecast by Ownership, 2023-2036
- Latin America Distributed Antenna Systems Market Valuation, Business Viewpoint and Forecast by Vertical, 2023-2036
- Latin America Distributed Antenna Systems Market Valuation, Business Viewpoint and Forecast by Country, 2023-2036
- Brazil, Market Value (USD Million) Current and Future Projections, 2023-2036
- Mexico, Market Value (USD Million) Current and Future Projections, 2023-2036
- Argentina, Market Value (USD Million) Current and Future Projections, 2023-2036
- Rest of Latin America, Market Value (USD Million) Current and Future Projections, 2023-2036
- Europe Distributed Antenna Systems Market Valuation, Business Viewpoint and Forecast by Region, 2023-2036
- Outline of the Segment
- Detailed Overview
- Year-on-Year Growth Forecast (%)
- Europe Distributed Antenna Systems Market Valuation, Business Viewpoint and Forecast by Offering, 2023-2036
- Europe Distributed Antenna Systems Market Valuation, Business Viewpoint and Forecast by Coverage, 2023-2036
- Europe Distributed Antenna Systems Market Valuation, Business Viewpoint and Forecast by User Facilities, 2023-2036
- Europe Distributed Antenna Systems Market Valuation, Business Viewpoint and Forecast by Ownership, 2023-2036
- Europe Distributed Antenna Systems Market Valuation, Business Viewpoint and Forecast by Vertical, 2023-2036
- Europe Distributed Antenna Systems Market Valuation, Business Viewpoint and Forecast by Country, 2023-2036
- UK, Market Value (USD Million) Current and Future Projections, 2023-2036
- Germany, Market Value (USD Million) Current and Future Projections, 2023-2036
- France, Market Value (USD Million) Current and Future Projections, 2023-2036
- Italy, Market Value (USD Million) Current and Future Projections, 2023-2036
- Spain, Market Value (USD Million) Current and Future Projections, 2023-2036
- BENELUX, Market Value (USD Million) Current and Future Projections, 2023-2036
- Russia, Market Value (USD Million) Current and Future Projections, 2023-2036
- Poland, Market Value (USD Million) Current and Future Projections, 2023-2036
- Rest of Europe, Market Value (USD Million) Current and Future Projections, 2023-2036
- Asia Pacific Excluding Japan (APEJ) Distributed Antenna Systems Market Valuation, Business Viewpoint and Forecast by Region, 2023-2036
- Outline of the Segment
- Detailed Overview
- Year on Year Growth Forecast (%)
- Asia Pacific Excluding Japan (APEJ) Distributed Antenna Systems Market Valuation, Business Viewpoint and Forecast by Offering, 2023-2036
- Asia Pacific Excluding Japan (APEJ) Distributed Antenna Systems Market Valuation, Business Viewpoint and Forecast by Coverage, 2023-2036
- Asia Pacific Excluding Japan (APEJ) Distributed Antenna Systems Market Valuation, Business Viewpoint and Forecast by User Facilities, 2023-2036
- Asia Pacific Excluding Japan (APEJ) Distributed Antenna Systems Market Valuation, Business Viewpoint and Forecast by Ownership, 2023-2036
- Asia Pacific Excluding Japan (APEJ) Distributed Antenna Systems Market Valuation, Business Viewpoint and Forecast by Vertical, 2023-2036
- Asia Pacific Excluding Japan (APEJ) Distributed Antenna Systems Market Valuation, Business Viewpoint and Forecast by Country, 2023-2036
- China, Market Value (USD Million) Current and Future Projections, 2023-2036
- Malaysia, Market Value (USD Million) Current and Future Projections, 2023-2036
- India, Market Value (USD Million) Current and Future Projections, 2023-2036
- Indonesia, Market Value (USD Million) Current and Future Projections, 2023-2036
- South Korea, Market Value (USD Million) Current and Future Projections, 2023-2036
- New Zealand, Market Value (USD Million) Current and Future Projections, 2023-2036
- Singapore, Market Value (USD Million) Current and Future Projections, 2023-2036
- Australia, Market Value (USD Million) Current and Future Projections, 2023-2036
- Rest of APEJ, Market Value (USD Million) Current and Future Projections, 2023-2036
- Japan Distributed Antenna Systems Market Valuation, Business Viewpoint and Forecast by Region, 2023-2036
- Outline of the Segment
- Detailed Overview
- Year-on-Year Growth Forecast (%)
- Japan Distributed Antenna Systems Market Valuation, Business Viewpoint and Forecast by Offering, 2023-2036
- Japan Distributed Antenna Systems Market Valuation, Business Viewpoint and Forecast by Coverage, 2023-2036
- Japan Distributed Antenna Systems Market Valuation, Business Viewpoint and Forecast by User Facilities, 2023-2036
- Japan Distributed Antenna Systems Market Valuation, Business Viewpoint and Forecast by Ownership, 2023-2036
- Japan Distributed Antenna Systems Market Valuation, Business Viewpoint and Forecast by Vertical, 2023-2036
- Middle East & Africa (MEA) Distributed Antenna Systems Market Valuation, Business Viewpoint and Forecast by Region, 2023-2036
- Outline of the Segment
- Detailed Overview
- Year on Year Growth Forecast (%)
- Middle East & Africa (MEA) Distributed Antenna Systems Market Valuation, Business Viewpoint and Forecast by Offering, 2023-2036
- Middle East & Africa (MEA) Distributed Antenna Systems Market Valuation, Business Viewpoint and Forecast by Coverage, 2023-2036
- Middle East & Africa (MEA) Distributed Antenna Systems Market Valuation, Business Viewpoint and Forecast by User Facilities, 2023-2036
- Middle East & Africa (MEA) Distributed Antenna Systems Market Valuation, Business Viewpoint and Forecast by Ownership, 2023-2036
- Middle East & Africa (MEA) Distributed Antenna Systems Market Valuation, Business Viewpoint and Forecast by Vertical, 2023-2036
- Middle East & Africa (MEA) Distributed Antenna Systems Market Valuation, Business Viewpoint and Forecast by Country, 2023-2036
- Combined Gulf Countries, Market Value (USD Million) Current and Future Projections, 2023-2036
- Israel, Market Value (USD Million) Current and Future Projections, 2023-2036
- South Africa, Market Value (USD Million) Current and Future Projections, 2023-2036
- Rest of MEA, Market Value (USD Million) Current and Future Projections, 2023-2036
- Competitive Landscape
- Market share of Key Competitors in the Market (%), 2023
- Benchmarking of the Competitors
- Profile of the Major Vendors
- CommScope Holding Company, Inc.
- Business Overview
- Key Business Strategies for the Growth of Revenue
- Financial Performance and Revenue Representation
- Major Products Offered
- Mergers and Acquisitions
- Latest Trends
- Regional and Worldwide Presence
- Corning Incorporated
- HUBER+SUHNER
- Comba Telecom Systems Holdings Ltd.
- SOLiD
- ATC TRS V LLC
- Boingo Wireless, Inc.
- PBE Group
- Zinwave
- Advanced RF Technologies, Inc.
- Siemon
- TAMAGAWA ELECTRONICS CO., LTD.
- Other Key Players
- CommScope Holding Company, Inc.
Distributed Antenna Systems Market Outlook:
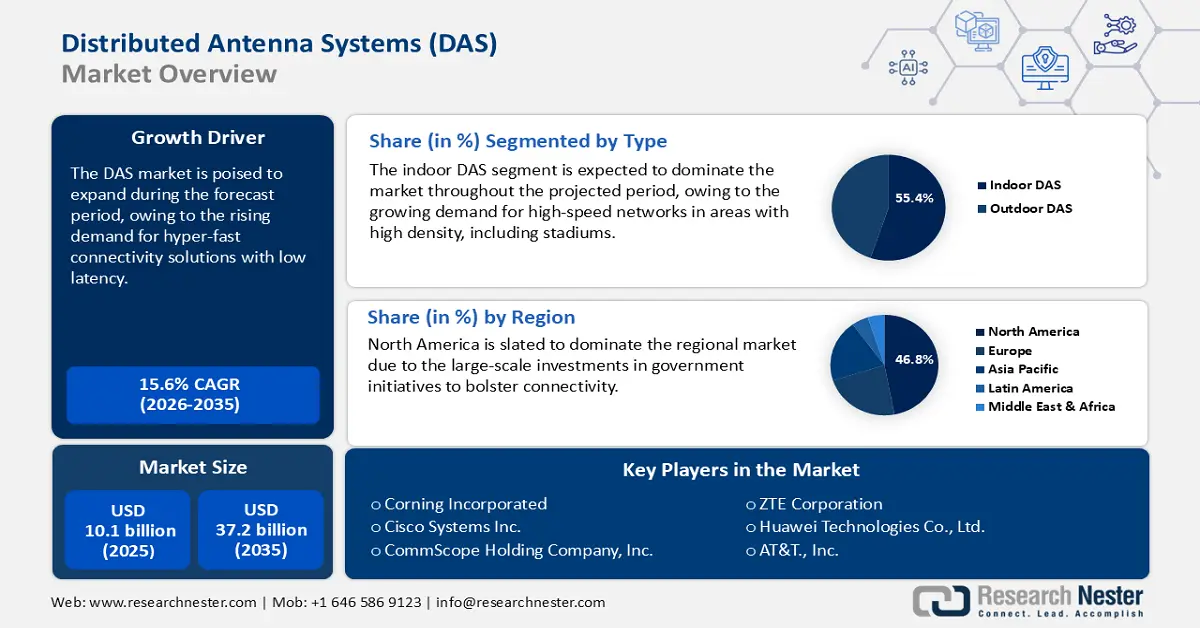
Distributed Antenna Systems (DAS) Market size was valued at USD 10.1 billion in 2025 and is projected to reach USD 37.2 billion by the end of 2035, expanding at a CAGR of 15.6% during the anticipated timeline from 2026 to 2035. In 2026, the industry size of distributed antenna systems is evaluated at USD 11.6 billion.
The DAS market supply chain is characterized by several critical components, including fiber-optic cables, amplifiers, antennas, copper, and aluminum. The Federal Reserve Bank of St. Louis reveals that the producer price index (PPI) for telecommunication equipment stood at 83.3 in May 2025. The rising material prices & labor costs, and the increasing demand for better connectivity in urban areas mainly drive the producer price index and consumer price index.
The World Trade Organization, in its Global Trade Outlook and Statistics report, revealed that the office and telecom equipment trade increased by 10% in 2024. Also, the commercial telecom services trade grew by 7% between 2023 and 2024. The future trade outlook reflects a greater sourcing of raw materials from countries blessed with large-scale production capabilities, such as China, while the global assembly lines are set to embrace greater automation against the backdrop of heightened demand.
Key Distributed Antenna Systems (DAS) Market Insights Summary:
Regional Highlights:
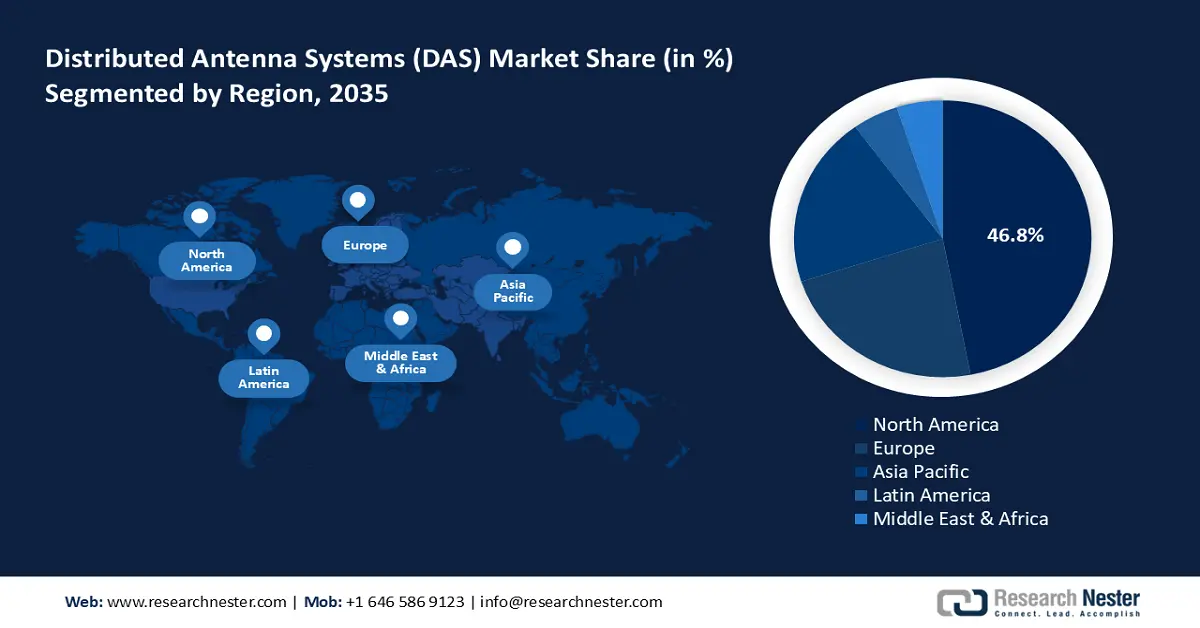
- North America is anticipated to capture 46.8% of the global share by 2035 in the distributed antenna systems (DAS) market as its strong telecom infrastructure and digitalized economy intensify the need for ultra-fast connectivity owing to a well-established regional supply chain.
- Asia Pacific is projected to expand at a 9.7% CAGR from 2026-2035 as rising high-speed connectivity demand and rapid 5G adoption across major economies spur DAS deployments impelled by nationwide digital initiatives.
Segment Insights:
- By 2035, the indoor segment of the distributed antenna systems (DAS) market is set to hold a 55.4% share as active DAS gains preference for strengthening high-density network performance owing to the calls for scalable solutions in network connectivity.
- The antennas segment is forecasted to command a 39.6% revenue share throughout 2026–2035 propelled by the expansion of 5G networks.
Key Growth Trends:
- Expansion of 5G Networks and mobile data demand
- Smart city growth and the rising urbanization rates
Major Challenges:
- Stringent data protection and privacy regulations
- Spectrum Licensing barriers
Key Players: Corning Incorporated, Cisco Systems, Inc., CommScope Holding Company, Inc., American Tower Corporation, ZTE Corporation, Huawei Technologies Co., Ltd., Ruckus Networks (Broadcom), Anixter International, AT&T Inc., Telecom Malaysia, Samsung Electronics Co., Ltd., NEC Corporation, Fujitsu Limited, Mitsubishi Electric Corporation, SoftBank Group Corp.
Global Distributed Antenna Systems (DAS) Market Forecast and Regional Outlook:
Market Size & Growth Projections:
- 2025 Market Size: USD 10.1 billion
- 2026 Market Size: USD 11.6 billion
- Projected Market Size: USD 37.2 billion by 2035
- Growth Forecasts: 15.6% CAGR (2026-2035)
Key Regional Dynamics:
- Largest Region: North America (46.8% Share by 2035)
- Fastest Growing Region: Asia Pacific
- Dominating Countries: United States, China, Japan, Germany, United Kingdom
- Emerging Countries: India, South Korea, Australia, Canada, France
Last updated on : 28 August, 2025
Distributed Antenna Systems Market - Growth Drivers and Challenges
Growth Drivers
-
Expansion of 5G Networks and mobile data demand: A significant factor contributing to the market’s sustained expansion is the proliferation of 5G networks. Due to 5G’s expansion across the world, latency has reduced, leading to more stable connections. The improved speed has additionally impacted consumer preferences, as the end user is not merely satisfied with low connectivity speeds and proactively demands ultra-fast connectivity solutions, creating an extremely competitive market. According to India's Press Information Bureau, the global 5G revolution is gaining momentum, and by 2030, 5G is projected to handle 80% of all mobile data traffic worldwide, showing its major role in shaping the future of internet connectivity. A wider consumer base with increasing disposable income is set to offer high-earning opportunities for key manufacturers in the years ahead.
-
Smart city growth and the rising urbanization rates: Smart cities have become the backbone of a country’s development goals, while large-scale urbanization has ensured a sustained demand for improved connectivity solutions. Economies in APAC and Latin America are experiencing heightened urbanization rates, and companies are striving to keep pace with the ultra-fast connectivity demands. The question arises as to why DAS is vital for smart cities; its significance lies in integration with urban appliances such as smart lighting to public management systems such as intelligent transport systems.
-
Proliferation of smartphone usage and BYOD trends: Current trends indicate that smartphones have become an integral part of daily routine. Moreover, a new trend has proliferated in workplaces, i.e., the bring-your-own-device (BYOD) trend. This creates a data deluge where DAS steps in to handle it seamlessly. The use of smartphones with high data usage apps is also gaining momentum. To measure the deluge of data, the Groupe Spéciale Mobile Association (GSMA) released a report in 2023 noting that more than 53% of the global population, which accounts for over 4.1 billion people, uses smartphones. The report also noted that mobile internet usage stood at 57% worldwide, owing to increased connectivity programs.
Challenges
-
Stringent data protection and privacy regulations: The DAS market is plagued with challenges for market entrants as well as established players. Strict data privacy laws, such as the General Data Protection Regulation (GDPR) in Europe, have imposed major constraints on how the data is handled and transferred, causing barriers for the adoption of DAS. Many companies faced major compliance issues with the GDPR whilst expanding DAS solutions across Europe.
-
Spectrum Licensing barriers: DAS deployments are impaired by licensing hurdles. Moreover, allocations in regions with crowded or limited spectrum can pose challenges. An example of the challenge is the delay faced by some key players in Brazil, owing to restrictive spectrum licensing policies, which led to a delay of 9 months and a significant increase in the costs of installation. The challenge is further exacerbated in emerging markets such as the Asia Pacific and Latin America, where spectrum availability is likely to be limited.
Distributed Antenna Systems Market Size and Forecast:
| Report Attribute | Details |
|---|---|
|
Base Year |
2025 |
|
Forecast Year |
2026-2035 |
|
CAGR |
15.6% |
|
Distributed Antenna Systems Market Size and Forecast: |
USD 10.1 billion |
|
Forecast Year Market Size (2035) |
USD 37.2 billion |
|
Regional Scope |
|
Distributed Antenna Systems Market Segmentation:
Type Segment Analysis
The indoor segment is expected to hold a 55.4% share through 2035, and is particularly led by active DAS. The calls for scalable solutions in network connectivity bolster the segment’s growth. Additionally, trends indicate a surge in the requirement for ultra-fast networks in environments with high density, such as commercial buildings, stadiums, and transportation hubs. Active DAS solves a pain point by offering a centralized architecture that amplifies coverage in areas experiencing substantial data traffic. Operators prefer active DAS as it integrates with the future of connectivity solutions seamlessly. In January 2024, Parallel Wireless and SOLiD teamed up to cut the power used by Open RAN-DAS systems by 81%. This highlights that the increasing demand for indoor DAS solutions is boosting the revenues of key producers.
Component Segment Analysis
The antennas segment is estimated to account for 39.6% revenue share throughout the forecast period. The rise of antennas in DAS is directly connected with the expansion of 5G networks, which led to the surging calls for more reliable coverage. Antennas are vital for transmitting and receiving signals in both active and passive DAS setups. Moreover, the rise in mobile data consumption has led to the growth in the requirement for advanced antenna systems that can support larger data volumes. Manufacturers that support the demand with advanced antennas are set to bolster their revenue share. For instance, in January 2024, Toshiba Infrastructure Systems announced the launch of the ART3711, which is a 5G supporting DAS antenna system for neutral-host environments that support multiple operators to bolster indoor coverage. Thus, manufacturers are expected to earn lucrative gains through new product launches and innovations.
End user Segment Analysis
The corporate segment is projected to capture the highest market share throughout the study period. The convergence of connectivity, workforce, and operational needs is fueling the use of DAS systems in the corporate offices. The mobile-first workflows and cloud-based applications are also necessitating enterprises to rely on DAS solutions. Further, the unified communications platforms, which demand uninterrupted in-building wireless coverage, are also contributing to the segmental growth. Another growth driver is the shift toward hybrid work, where video conferencing, collaboration tools, and secure VPN access require low-latency, high-capacity networks.
Our in-depth analysis of the global distributed antenna systems (DAS) market includes the following segments:
|
Segment |
Subsegments |
|
Type |
|
|
Component |
|
|
End user |
|
|
Ownership |
|
|
Signal Source |
|

Vishnu Nair
Head - Global Business DevelopmentCustomize this report to your requirements — connect with our consultant for personalized insights and options.
Distributed Antenna Systems Market - Regional Analysis
North America Market Insights
The North America DAS market is anticipated to account for 46.8% of the global revenue share by 2035. North America has a well-established telecommunications infrastructure, which has a direct impact on the demand for DAS solutions. Additionally, due to a digitalized economy, spurred by the U.S. and Canada, the demand for ultra-fast connectivity solutions is high in the region. The report by 5G Americas reveals that in the first quarter of 2025, the 5G connections reached 314 million, around 83% of the population in the region. The per-user base is 15x more than in other regions. Additionally, stakeholders in the market are buoyed by a well-established regional supply chain.
The U.S. DAS market is poised to hold a leading revenue share, owing to a greater demand for improved connectivity solutions. A key facet in the market is the intensifying competition between leading AI companies such as OpenAI, xAI, Microsoft, etc., broadening the frontiers and creating a favorable ecosystem for the adoption of DAS solutions. Moreover, the U.S. seeks to maintain its position as a global leader in communication technology, creating ample opportunities to proliferate DAS solutions. The table below highlights policy shifts in the U.S. that have a direct impact on the expansion of the U.S. DAS sector.
Canada is another lucrative market in North America supported by the government’s commitment to expanding high-speed internet access across the country. The Innovation, Science, and Economic Development (ISED) has established targets to expand broadband to the remote regions of the country, in a move that is expected to bolster demand for DAS solutions.
APAC Market Insights
The APAC distributed antenna systems market is poised to register the fastest expansion with a CAGR of 9.7% from 2026 to 2035. A major driver is the large percentage of consumers demanding high-speed connectivity solutions in the region. APAC has also been at the forefront of 5G adoption, especially in economies such as China, Japan, and South Korea. A key facet of the market is the presence of a strong supply chain, supported by the manufacturing capabilities of China, Japan, and India. Additionally, the Digital India Program and the 5G National Strategy of South Korea are examples of nationwide initiatives that will create long-term demand for DAS systems.
The China DAS market is expected to have the largest deployment during the forecast period, whilst maintaining a dominant revenue share in the region. A key facet is the country’s position as the largest 5G market in the world, owing to the presence of more than 4 million 5G base stations. The government has been extremely proactive in promoting nationwide hyper-connectivity, which augurs well for the future outlook. Major policy shifts include the Made in China 2025 initiative, which is expected to create lucrative opportunities for manufacturing antenna components within the country.
The Japan DAS market benefits from the Society 5.0 initiatives that envision a digitally connected, sustainable future of the country, which creates a high demand for advanced connectivity solutions. The JETRO report reveals that the government has granted nearly USD 660 million for the promotion of digitalization. The Ministry of Internal Affairs and Communications (MIC) has also set targets to hasten 5G penetration across the country, fueling the requirement for DAS systems. With Japan creating a favorable ecosystem for the entry of foreign companies, the market is set to be more competitive.
Europe Market Insights
The Europe distributed antenna systems market is likely to hold a significant share during the forecast period, owing to the expanding number of enterprises, telecom operators, and government offices. These all push for improved indoor wireless coverage to support rising data traffic, creating a profitable marketplace for DAS companies. The European Commission’s report reveals that more than 90% of households in the EU have 5G access. Further, with swift 5G rollouts accelerating across the region, mobile operators are partnering with infrastructure providers to deploy DAS in high-capacity venues such as airports, stadiums, shopping centers, and transport hubs.
The DAS sales in Germany are expected to be driven by the rapid digital transformation and Industry 4.0 adoption. The majority of the population living in urban areas is directly fueling the demand for indoor connectivity in the country. The office complexes, manufacturing facilities, and transport networks are mainly driving the sales of distributed antenna systems. The federal government’s Digital Strategy 2030, focusing on next-generation connectivity across industries, is also boosting DAS deployment.
The U.K. distributed antenna systems market is expected to increase at the fastest CAGR, owing to the strong enterprise demand and a dense urban landscape. The government-backed digital infrastructure initiatives are also contributing to the sales of distributed antenna technologies. The government’s Project Gigabit and 5G infrastructure investments, encouraging telecom operators and neutral-host providers to scale DAS deployments across commercial and public venues, are creating a profitable environment for key market players.
Key players in Distributed Antenna Systems Market
- Corning Incorporated
- Company Overview
- Business Strategy
- Key Product Offerings
- Financial Performance
- Key Performance Indicators
- Risk Analysis
- Recent Development
- Regional Presence
- SWOT Analysis
- Cisco Systems, Inc.
- CommScope Holding Company, Inc.
- American Tower Corporation
- ZTE Corporation
- Huawei Technologies Co., Ltd.
- Ruckus Networks (Broadcom)
- Anixter International
- AT&T Inc.
- Telecom Malaysia
- Samsung Electronics Co., Ltd.
- NEC Corporation
- Fujitsu Limited
- Mitsubishi Electric Corporation
- SoftBank Group Corp.
The distributed antenna systems (DAS) market remains highly competitive. Major players such as CommScope, Cisco, and Corning are leading the market’s growth curve. With policy shifts indicating that numerous countries are likely to embrace the push for nationwide hyper-connectivity, the opportunities within the market are expected to boom. The table below provides a list of the major players in the distributed antenna systems (DAS) market.
Recent Developments
- In March 2025, ZTE announced the launch of all-scenario simplified site solutions covering outdoor macro, indoor, FWA, and rural scenarios. These solutions enable ubiquitous digitalization with a superior user experience
- In February 2024, CommScope introduced three industry-leading Open RAN (Radio Access Network). The advances to its network portfolio, facilitating open, sustainable, and converged 5G indoor networks.
- Report ID: 1841
- Published Date: Aug 28, 2025
- Report Format: PDF, PPT
- Explore a preview of key market trends and insights
- Review sample data tables and segment breakdowns
- Experience the quality of our visual data representations
- Evaluate our report structure and research methodology
- Get a glimpse of competitive landscape analysis
- Understand how regional forecasts are presented
- Assess the depth of company profiling and benchmarking
- Preview how actionable insights can support your strategy
Explore real data and analysis
Frequently Asked Questions (FAQ)
About this Report
Connect with our Expert


Copyright @ 2026 Research Nester. All Rights Reserved.
