Chromium Salts Market Outlook:
Chromium Salts Market size was valued at USD 5.1 billion in 2025 and is projected to reach USD 7.7 billion by the end of 2035, rising at a CAGR of 4.2% during the forecast period 2026-2035. In 2026, the industry size of chromium salts is evaluated at USD 5.3 billion.
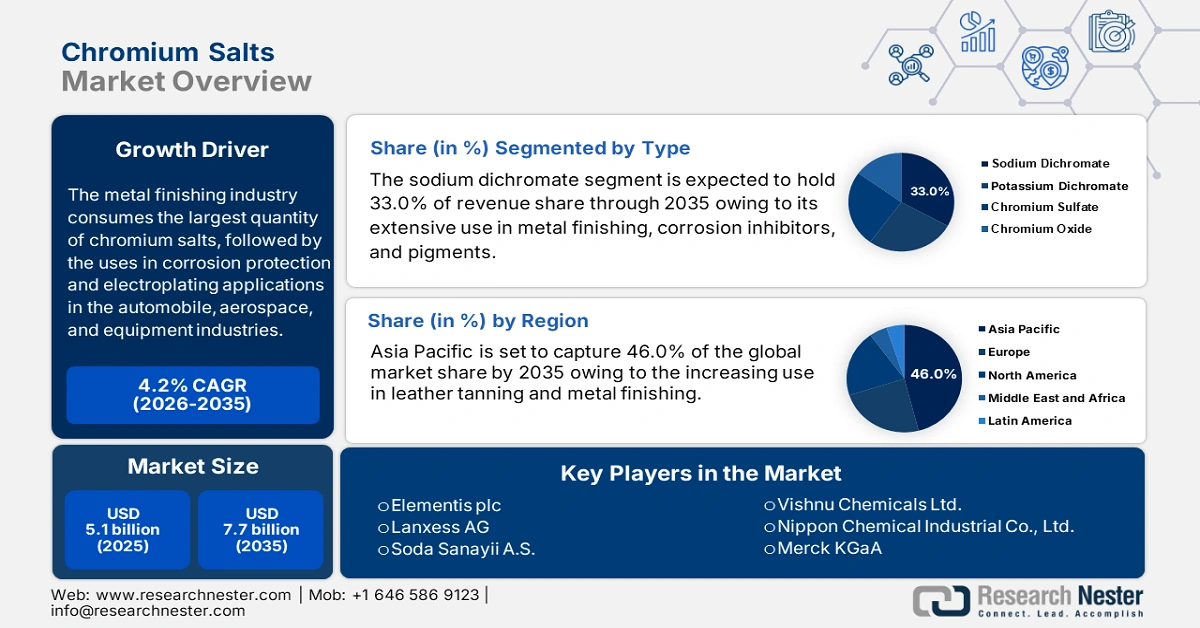
The metal finishing industry is the largest consumer of chromium salts, followed by the uses in corrosion protection and electroplating applications in the automobile, aerospace, and equipment industries. Global consumption of chromium salt for metal finishing increased according to the United States Geological Survey (USGS), and the leadership positions are held by China, the United States, and Germany. High-purity chromium compounds are in demand, driven by regulations like the EPA's Chromium Electroplating NESHAP regulations in North America and Europe, which have prompted demand.
In 2022, apparent U.S. chromium consumption, including recycled chromium, was 569,000 metric tons (t) and was about the same as 2021 levels. Total domestic consumption of chromium material, excluding stainless steel, was down 29%. The largest use for chromium was in steelmaking (93%), with superalloys and other uses taking up the remaining 7%. U.S. exports of chromite ore, chromium chemicals, ferroalloys, chromium metal, and stainless-steel products increased by 16% from the previous year, totaling 133,000 t. U.S. imports of the needs categories increased by 7%, totaling 609,000 t by chromium content.
Key Chromium Salts Market Insights Summary:
Regional Insights:
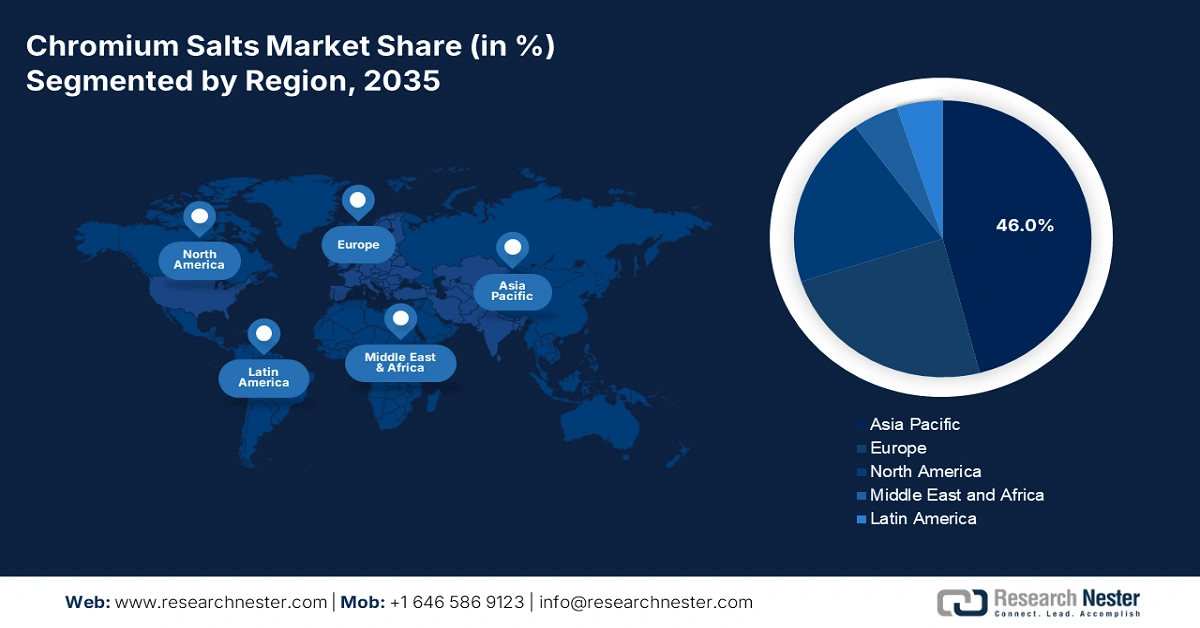
- Asia Pacific is projected to hold a 46% share by 2035, driven by rapid industrialization, major leather processing centers, and growth in chemical manufacturing.
- Europe is expected to account for 24% share by 2035, impelled by demand from automotive coatings, leather processing, and metal finishing.
Segment Insights:
- The sodium dichromate segment is projected to account for 33% share by 2035, propelled by its critical role in metal finishing, leather tanning, wood preservation, and pigment production.
- The leather tanning segment is expected to hold a 29.2% share by 2035, owing to the rising demand for soft, durable, and thermally stable chrome-tanned leather.
Key Growth Trends:
- Growth in the leather tanning industry
- Rising demand in pigments and coatings
Major Challenges:
- Volatility in raw material supply
- Rising production costs
Key Players: Elementis plc,Lanxess AG,Soda Sanayii A.S.,Vishnu Chemicals Ltd.,Nippon Chemical Industrial Co., Ltd.,American Elements,Hebei Chromate Chemical Co., Ltd.,Aktyubinsk Chromium Chemicals Plant,MidUral Group,Merck KGaA,Yinzhou Mingwei Chemical Co., Ltd.,Chemetall (BASF SE),Pacific Chemicals (Pvt) Ltd.,Dongwon Metal Co., Ltd.,Malaysian Chromium Industries
Global Chromium Salts Market Forecast and Regional Outlook:
Market Size & Growth Projections:
- 2025 Market Size: USD 5.1 billion
- 2026 Market Size:USD 5.3 billion
- Projected Market Size: USD 7.7 billion by 2035
- Growth Forecasts: 4.2% CAGR (2026-2035)
Key Regional Dynamics:
- Largest Region: Asia Pacific (46% Share by 2035)
- Fastest Growing Region: Asia Pacific
- Dominating Countries: - China, India, Germany, United States, Japan
- Emerging Countries: - South Korea, Brazil, Turkey, Mexico, Indonesia
Last updated on : 12 September, 2025
Chromium Salts Market - Growth Drivers and Challenges
Growth Drivers
- Growth in the leather tanning industry: Chromium salts (especially basic chromium sulfate) are an essential component in leather tanning as they increase the leather's strength, flexibility, and resistance. As demand for premium leather apparel in fashion, footwear, automotive, and furniture continues to increase, so has the consumption of chromium salt. In 2023, the global trade of leather, further prepared after tanning or crusting (excluding ovine), totaled $801M, down 11.2% from $902M in 2022. Over the past five years, it declined at a 9.79% annualized rate, ranking 966 among 1,222 products and representing less than 0.005% of world trade. Thus, chromium salts will remain essential to any tanning operation.
- Rising demand in pigments and coatings: Chromium salts are also fundamental in producing pigments, which are utilized in paints, coatings, ceramics, and plastics. These pigments maintain heat and UV resistance, which is necessary for industrial applications and decorative coatings. Growth in the construction sector, demand for automotive coatings, and sustainable packaging are key emerging segments within the chromium pigments sector. An example of a chromium oxide green pigment is found in many cement tiles and near-opaque ceramic tiles because of their durability. With most urban infrastructure projects underway globally, and rising demand for decorative coatings utilized in consumer products, all contribute to the increasing relevance of chromium salts in this context.
- Expansion of electroplating applications: Chromium salts are important raw materials in the electroplating process, which is a protective and decorative coating for metals. Major end-user industries include automotive, aerospace, and electronics, as chromium plating increases hardness, provides corrosion resistance, and improves the aesthetics of the coating. This growth in electroplating is expected to continue with global manufacturing output anticipated to increase, especially in Asia-Pacific economies such as China and India. In addition, demand for wear-resistant components for industrial machinery and aerospace applications will continue to boost the market for chromium salts, which are essential to high-performance surface finishing applications.
Growth in Global Chromium Ore Trade
Top Exporters of Chromium Ores and Concentrates in 2023
|
Exporter |
Trade Value (USD thousands) |
Quantity (Kg) |
|
South Africa |
3,942,399.35 |
17,791,500,000 |
|
Turkey |
397,500.54 |
1,465,530,000 |
|
Pakistan |
126,552.18 |
465,046,000 |
|
Kazakhstan |
116,606.56 |
390,776,000 |
|
Albania |
82,192.16 |
403,126,000 |
|
Oman |
44,709.89 |
107,509,000 |
|
Netherlands |
36,347.44 |
97,164,700 |
|
Philippines |
26,418.37 |
101,281,000 |
|
Madagascar |
22,235.58 |
91,293,800 |
Source: WITS
Challenges
- Volatility in raw material supply: The chromium salts business is heavily dependent on chromium ore (chromite), which is located in very few places, i.e., South Africa, Kazakhstan, and India. There are a number of risks where political instability, mining strikes, or export controls may occur in these regions and potentially disrupt global supply chains. The fluctuations in chromite price affect the production costs of chromium salts and deflate profit margins. Companies that rely on the importation of chromium ore (chromite) are at the same time exposed to tariffs and trade restrictions, with higher risks of logistics delays. This makes it difficult for manufacturers to offer stable pricing and long-term supply commitments to customers.
- Rising production costs: Chromium salts production requires significant energy usage, specialized equipment, and costly pollution control systems. Energy pricing is volatile, and environmental standards are tightening, increasing manufacturing costs. Furthermore, the necessary advanced treatment of toxic and hazardous by-products and waste raises operational costs. Smaller producers are faced with being uncompetitive, and larger producers simply increase costs to customers until the demand wanes. All of this is magnified by the pressures of inflationary pricing and increased labor costs in key producer locations, which further deplete operating margins.
Chromium Salts Market Size and Forecast:
| Report Attribute | Details |
|---|---|
|
Base Year |
2025 |
|
Forecast Year |
2026-2035 |
|
CAGR |
4.2% |
|
Base Year Market Size (2025) |
USD 5.1 billion |
|
Forecast Year Market Size (2035) |
USD 7.7 billion |
|
Regional Scope |
|
Chromium Salts Market Segmentation:
Type Segment Analysis
The sodium dichromate segment is predicted to gain the largest market share of 33% during the projected period by 2035. Sodium dichromate is the cornerstone of the chromium salts market, serving as the primary precursor for nearly all chromium-based compounds. Its strong oxidizing properties and chemical stability make it indispensable in applications such as metal finishing, leather tanning, wood preservation, and pigment production. As industries like automotive, aerospace, and construction expand, the demand for corrosion-resistant and durable materials continues to rise, boosting sodium dichromate consumption. Its versatility also supports growth in specialty chemicals, catalysts, and glass coloring. With increasing industrialization in regions like South Asia and Eurasia, sodium dichromate remains the dominant product type driving market growth. Despite environmental concerns, its critical role in downstream applications secures its position at the core of the chromium salts segment.
Application Segment Analysis
The leather tanning segment is anticipated to hold a 29.2% share by 2035. Chromium salts, particularly basic chromium sulfate, are essential in this process due to their ability to produce soft, durable, and thermally stable leather. The widespread use of chrome-tanned leather in footwear, garments, and accessories fuels consistent demand for these salts. Economically, chrome tanning is faster and more cost-effective than vegetable alternatives, making it attractive to manufacturers. As global leather exports rise and developing economies expand their tanning industries, the consumption of chromium salts continues to grow. This sustained demand positions leather tanning as a cornerstone of the chromium salts market.
End use Segment Analysis
The chemicals & petrochemicals segment is anticipated to hold a 24.2% share by 2035. Due to the rising applications involving catalysts, pigments, plating, and corrosion inhibitors. These compounds that contain chromium in chemical applications to support surface treatment have witnessed growth in the market share for this segment. The growth attributed to government-backed industrial expansion in emerging economies and increased chemical production further solidifies the chemicals & petrochemicals segment as the leading end-use segment, as opposed to metallurgy, construction, or automotive.
Our in-depth analysis of the chromium salts market includes the following segments:
|
Segment |
Subsegment |
|
Type |
|
|
Application |
|
|
End use |
|

Vishnu Nair
Head - Global Business DevelopmentCustomize this report to your requirements — connect with our consultant for personalized insights and options.
Chromium Salts Market - Regional Analysis
Asia Pacific Market Insights
Asia Pacific will contribute 46% of the global chromium salts market revenue by 2035, due to rapid industrialization, major leather processing centers, and growth in chemical manufacturing. Demand is primarily from electroplating, pigments, and metallurgy, with backing from the major automotive and construction sectors. Governments in the region have initiated plans to invest in sustainable processing technology, while rising regulatory standards to promote environmentally viable processing will work towards even more environmentally friendly methods of production, which will maintain the dominant position that the region holds for global chromium salts consumption.
India is one of the fastest-growing chromium salts market in the Asia Pacific, driven by leather tanning, textiles, and metal finishing. India represents a major percentage of global leather production, and chromium salts are a significant part of the process for leather tanning. Industrial clusters in Tamil Nadu and Uttar Pradesh anchor consumer activity. The Government of India’s dual focus on effluent management and sustainable leather tanning is fostering both market growth and environmental accountability. By encouraging cleaner production practices and stricter waste treatment protocols, the government is driving innovation and investment in eco-friendly technologies. This balanced approach not only supports the expansion of the leather industry but also reinforces its commitment to sustainability. As a result, environmental responsibility is becoming an integral part of industrial progress.
Pigments and Preparations Based on Chromium Compounds (2023)
|
Country |
Export Value (thousands USD) |
Quantity (Kg) |
|
India |
56,205.91 |
14,974,800 |
|
China |
16,281.65 |
4,591,850 |
|
Indonesia |
2,586.80 |
495,981 |
|
Japan |
1,813.35 |
135,945 |
|
Malaysia |
429.09 |
76,321 |
|
Australia |
374.39 |
41,710 |
|
South Korea |
321.97 |
54,322 |
Source: WITS
Europe Market Insights
Europe will contribute 24% of the global chromium salts revenue by 2035, due to demand from automotive coatings, leather processing, and metal finishing. Demand is spread across the major economies, and with such diversified downstream applications, it helps balance out price volatility and support revenue stability. Environmental standards for chromium hexavalent discharges are tightening, particularly from the electroplating industry, leading to upgrades to their processes, with some moving to a new specialty grade with better environmental compliance.
Germany remains the major driver of regional demand for chromium salts due to advanced surface treatment and electroplating applications, used in high-performance pigments. Industrial clusters are visible as supplier integration systems support shorter lead times whilst supporting product quality assurance. Although reliance on imports for chromium intermediates will continue, local formulators are capturing greater value as they offer customized solutions and increasingly stricter compliance. End-use exposure remains balanced across automotive, machinery, construction, engineered components, and premium leather tanning for footwear and clothing accessories.
Clothing Accessories of Leather or Composition 2023
|
Country |
Trade Value (USD '000) |
Quantity (Kg) |
|
United Kingdom |
8,704.76 |
115,131 |
|
Germany |
2,885.23 |
33,951 |
|
France |
13,228.47 |
92,386 |
|
Italy |
55,435.73 |
432,410 |
|
Spain |
10,268.76 |
83,400 |
|
Russia (Russian Federation) |
47.36 |
2,905 |
Source: WITS
North America Market Insights
North America will contribute 20% of the global chromium salts revenue by 2035. The North American market for chromium salts operates under advanced chemical processing capabilities, strong regulatory oversight, and diverse end-use markets like automotive, aerospace, construction, and metallurgy, which means that demand is developed through the use of its classical applications in surface treatment, electroplating, and pigments. The regional players are investing in sustainable alternatives and are cognizant of complying with environmental regulations imposed on them by the EPA and OSHA. However, domestic refining and innovations in specialty products can support growth.
The U.S. remains the dominant player in the market, the substantial use in coatings for automotive coatings, especially in alloys for aerospace, and for tanning in the leather industry. Strong regulatory enforcement from the EPA and OSHA facilitates the move away from chromium and encourages the development of safer and sustainable replacements. The U.S. produced chromium chemicals, as well as stainless steel, in 2022. Chromium chemicals derived from chemical-grade chromite ore are concentrated to high chromium chemicals with greater than 45% chromic oxide (Cr2O3), which will generally be converted to sodium dichromate.
Key Chromium Salts Market Players:
- Elementis plc
- Company Overview
- Business Strategy
- Key Product Offerings
- Financial Performance
- Key Performance Indicators
- Risk Analysis
- Recent Development
- Regional Presence
- SWOT Analysis
- Lanxess AG
- Soda Sanayii A.S.
- Vishnu Chemicals Ltd.
- Nippon Chemical Industrial Co., Ltd.
- American Elements
- Hebei Chromate Chemical Co., Ltd.
- Aktyubinsk Chromium Chemicals Plant
- MidUral Group
- Merck KGaA
- Yinzhou Mingwei Chemical Co., Ltd.
- Chemetall (BASF SE)
- Pacific Chemicals (Pvt) Ltd.
- Dongwon Metal Co., Ltd.
- Malaysian Chromium Industries
The global market for chromium salts is moderately concentrated, with Lanxess and Elementis leading the market through significant R&D and eco-friendly manufacturing efforts. Nippon Chemical and Vishnu Chemicals are growing through low-cost production and export strategies. Kazakh and Chinese companies lead raw material provision, while Merck and BASF specialize in high-purity chromium used in electronics. Major trends involve green chemistry investments, increased REACH/EPA compliance, and vertical integration to secure chromium ore sources.
Some of the key players operating in the market are listed below:
Recent Developments
- In March 2024, Lanxess AG introduced EcoTan Plus, a low-carbon tanning ingredient for the leather industry that reduces CO₂ emissions by 41% compared to conventional salts. Lanxess reported a 16% rise in orders from European tanneries in the first quarter of 2024, spurred by tighter EU sustainability standards. The business expects this product to generate €51 million in yearly revenue by 2025.
- In January 2024, BASF/Chemetall (Germany) introduced Closed-Loop Chromium Recycling, a proprietary hydrometallurgical technology that recovers 96% or more of chromium from industrial wastewater, lowering raw material prices by 26%. BASF adopted this system in two German factories, reducing energy consumption by 31% and removing 5,000 tons of hazardous waste per year. The technology is now being licensed to European and North American companies.
- Report ID: 1145
- Published Date: Sep 12, 2025
- Report Format: PDF, PPT
- Explore a preview of key market trends and insights
- Review sample data tables and segment breakdowns
- Experience the quality of our visual data representations
- Evaluate our report structure and research methodology
- Get a glimpse of competitive landscape analysis
- Understand how regional forecasts are presented
- Assess the depth of company profiling and benchmarking
- Preview how actionable insights can support your strategy
Explore real data and analysis
Frequently Asked Questions (FAQ)
Chromium Salts Market Report Scope
Free Sample includes current and historical market size, growth trends, regional charts & tables, company profiles, segment-wise forecasts, and more.
Connect with our Expert


Copyright @ 2026 Research Nester. All Rights Reserved.
