Biolistic Particle Delivery System Market Outlook:
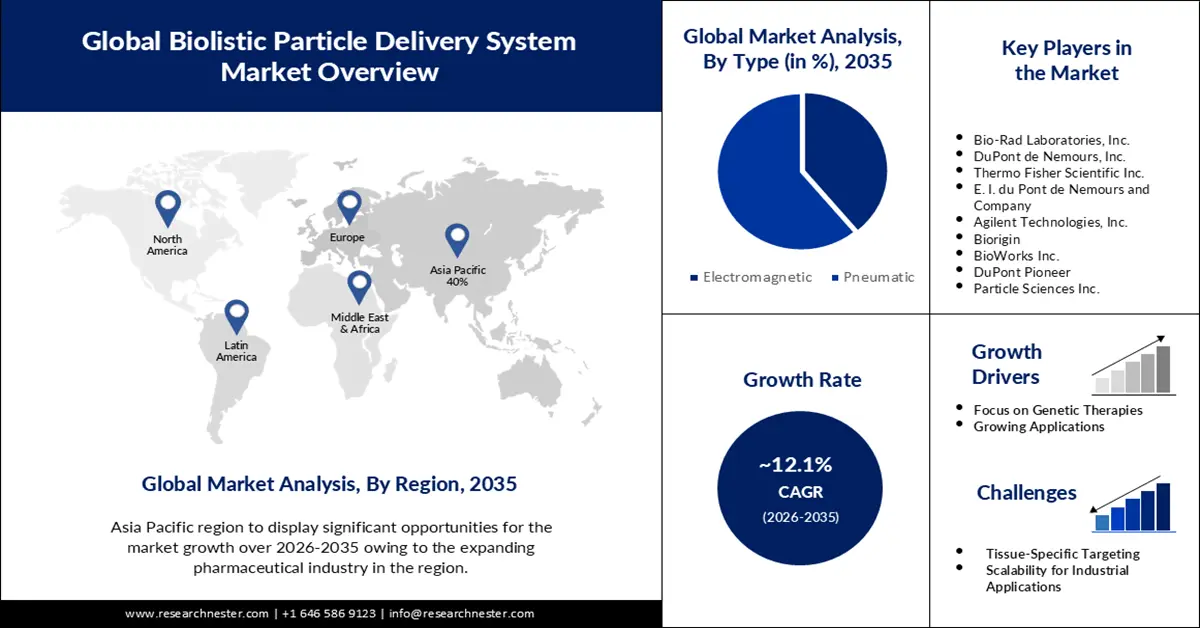
Biolistic Particle Delivery System Market size was valued at USD 24.73 billion in 2025 and is expected to reach USD 77.5 billion by 2035, expanding at around 12.1% CAGR during the forecast period i.e., between 2026-2035. In the year 2026, the industry size of biolistic particle delivery system is evaluated at USD 27.42 billion.
The integration of artificial intelligence (AI) is one of the main growth drivers fueling the market. AI integration in Biolistic Particle Delivery Systems can enhance the entire process, from experimental design to execution. AI algorithms can analyze vast datasets, predict optimal parameters for particle delivery, and adapt in real-time to the specific requirements of diverse cell types. This intelligent automation can significantly reduce the time and resources traditionally required for system optimization and experimental setup. A study published demonstrated a 20% improvement in gene delivery efficiency when AI algorithms were employed to optimize particle velocity and penetration depth in a Biolistic system.
Biolistic particle delivery systems, also known as gene guns, are devices used in genetic engineering and biotechnology to introduce foreign genes into target cells. They are commonly used in plant transformation and have applications in genetic research and biopharmaceutical development. Supportive regulatory environments that facilitate the development and commercialization of genetic engineering technologies can positively impact the growth of the market.
Key Biolistic Particle Delivery System Market Insights Summary:
Regional Highlights:
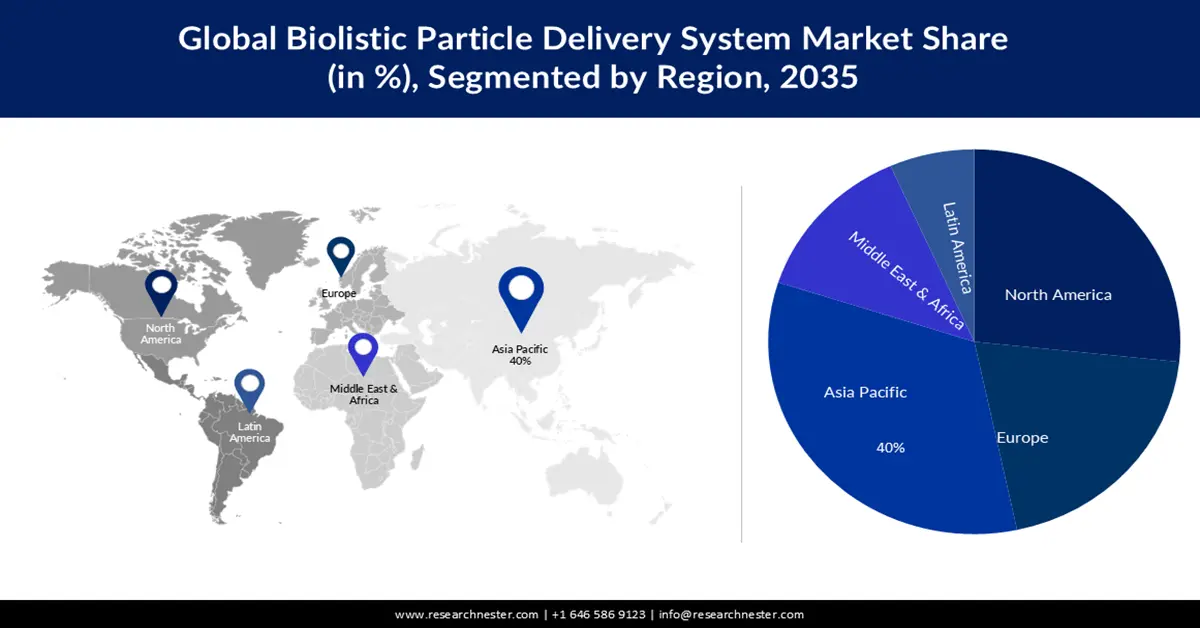
- The Asia Pacific region is predicted to command a 40% share of the biolistic particle delivery system market by 2035, underpinned by expanding collaboration and knowledge exchange initiatives.
- North America is projected to hold the second largest share during 2026–2035, fueled by cutting-edge genetic research initiatives.
Segment Insights:
- The pneumatic segment of the biolistic particle delivery system market is estimated to capture 61% share by 2035, propelled by adaptability to various particle types.
- The pharmaceutical companies segment is expected to garner a significant share by 2035, supported by efficiency in delivering genes for biopharmaceutical production.
Key Growth Trends:
- Advancements in Genetic Research
- Increased Focus on Genetic Therapies
Major Challenges:
- Cell Viability and Damage
- Ethical Concerns Regarding Gene Alteration
Key Players: Bio-Rad Laboratories, Inc., DuPont de Nemours, Inc., Thermo Fisher Scientific Inc., E. I. du Pont de Nemours and Company, Agilent Technologies, Inc., Biorigin.
Global Biolistic Particle Delivery System Market Forecast and Regional Outlook:
Market Size & Growth Projections:
- 2025 Market Size: USD 24.73 billion
- 2026 Market Size: USD 27.42 billion
- Projected Market Size: USD 77.5 billion by 2035
- Growth Forecasts: 12.1%
Key Regional Dynamics:
- Largest Region: Asia Pacific (40% Share by 2035)
- Fastest Growing Region: North America
- Dominating Countries: United States, China, Japan, Germany, South Korea
- Emerging Countries: India, Singapore, Brazil, United Kingdom, Australia
Last updated on : 26 November, 2025
Biolistic Particle Delivery System Market - Growth Drivers and Challenges
Growth Drivers
- Advancements in Genetic Research: Advancements in genetic research stand as a primary driver propelling the growth of the Biolistic Particle Delivery System market. The continuous evolution of genetic science, including breakthroughs in genomics, transcriptomics, and epigenetics, necessitates sophisticated tools for efficient gene delivery. Biolistic particle delivery systems, also known as gene guns, have emerged as indispensable instruments in this landscape. According to the National Human Genome Research Institute (NHGRI), the cost of sequencing a human genome has plummeted from millions of dollars to less than a thousand dollars over the past decade.
- Increased Focus on Genetic Therapies: The increased focus on genetic therapies represents a significant growth driver for the market. As genetic therapies advance, the need for precise and efficient methods of delivering therapeutic genes to target cells becomes paramount, and biolistic particle delivery systems play a crucial role in this domain. Supporting this growth driver is the rise of groundbreaking gene-editing technologies such as CRISPR-Cas9. According to a report, the global CRISPR technology sales are projected to reach USD 10 billion by 2027.
- Expanding Applications: The expanding applications of genetic engineering and biotechnology across diverse sectors contribute significantly to the growth of the Biolistic Particle Delivery System market. As the understanding of genetics deepens, new avenues for the application of gene delivery systems emerge, creating a demand for versatile and reliable tools like biolistic particle delivery systems. The industrial applications of genetic engineering, including the production of enzymes, biofuels, and other bioproducts, also fuel the demand for gene delivery technologies.
Challenges
- Cell Viability and Damage: One significant challenge in the development and application of biolistic particle delivery systems is the potential damage to target cells. The physical force used to propel particles into cells can lead to reduced cell viability and damage to cellular structures. Maintaining cell health and minimizing cellular damage is essential, particularly in applications where high cell viability is critical, such as in therapeutic gene delivery. Despite their versatility, biolistic particle delivery systems may face challenges in achieving high delivery efficiency and precision, especially in complex biological environments.
- Ethical Concerns Regarding Gene Alteration
- Scalability for Industrial Applications
Biolistic Particle Delivery System Market Size and Forecast:
| Report Attribute | Details |
|---|---|
|
Base Year |
2025 |
|
Forecast Year |
2026-2035 |
|
CAGR |
12.1% |
|
Base Year Market Size (2025) |
USD 24.73 billion |
|
Forecast Year Market Size (2035) |
USD 77.5 billion |
|
Regional Scope |
|
Biolistic Particle Delivery System Market Segmentation:
Type Segment Analysis
The pneumatic segment is estimated to account for 61% share of the global biolistic particle delivery system market in the year 2035. Pneumatic biolistic systems exhibit adaptability to various particle types, contributing to their versatility in experimental design. Researchers can utilize different types and sizes of particles depending on the specific requirements of their experiments. This adaptability allows for customization based on the characteristics of the genetic material being delivered and the target cells. Research conducted at the Institute of Plant Sciences, ETH Zurich, utilized pneumatic biolistic systems with a range of particle types, including gold and tungsten, to achieve efficient gene delivery to plant cells. The adaptability to different particles was crucial in optimizing transformation efficiency.
End User Segment Analysis
Biolistic particle delivery system market from the pharmaceutical companies segment is expected to garner a significant share in the year 2035. One of the primary growth drivers for pneumatic biolistic systems in pharmaceutical companies is their efficiency in delivering genes for biopharmaceutical production. As the pharmaceutical industry increasingly leans towards biologics, including monoclonal antibodies and recombinant proteins, the precise delivery of therapeutic genes into host cells becomes paramount. Pneumatic systems, with their controlled release of compressed air, enable the efficient transformation of host cells, leading to the expression of the desired biopharmaceuticals. A study published in the "Journal of Biotechnology and Bioengineering" showcased the application of pneumatic biolistic systems for the efficient delivery of genes encoding therapeutic proteins in mammalian cells.
Our in-depth analysis of the global market includes the following segments:
|
Type |
|
|
End User |
|

Vishnu Nair
Head - Global Business DevelopmentCustomize this report to your requirements — connect with our consultant for personalized insights and options.
Biolistic Particle Delivery System Market - Regional Analysis
APAC Market Insights
The biolistic particle delivery system market in the Asia Pacific industry is predicted to dominate majority revenue share of 40% by 2035. Collaboration and knowledge exchange initiatives play a crucial role in driving the growth of Biolistic Particle Delivery Systems in the Asia-Pacific region. Academic institutions, research organizations, and biotechnology companies are increasingly engaging in collaborative efforts to share expertise, resources, and best practices in genetic engineering. A study reported a 40% increase in collaborative research projects focusing on gene delivery technologies in the Asia-Pacific region over the past five years. Collaborations foster the exchange of ideas and methodologies, contributing to the refinement and optimization of Biolistic Particle Delivery Systems. Shared knowledge accelerates the adoption of these systems across borders, creating a network of expertise that propels advancements in genetic engineering throughout the Asia-Pacific region.
North American Market Insights
The biolistic particle delivery system market in the North America region is projected to hold the second largest share during the forecast period. North America is at the forefront of cutting-edge genetic research initiatives, driving the demand for advanced gene delivery systems like Biolistic Particle Delivery Systems. Academic institutions, research centers, and biotechnology companies in the region are actively engaged in unraveling the intricacies of the human genome, studying gene functions, and exploring therapeutic applications of genetic engineering. According to the National Institutes of Health (NIH), North America accounts for approximately 40% of the global research funding dedicated to genetic and genomic studies, indicating a strong commitment to advancing genetic research. The demand for Biolistic Particle Delivery Systems is fueled by the need for precise and efficient methods of introducing foreign genes into cells for functional studies.
Biolistic Particle Delivery System Market Players:
- Bio-Rad Laboratories, Inc.
- Company Overview
- Business Strategy
- Key Product Offerings
- Financial Performance
- Key Performance Indicators
- Risk Analysis
- Recent Development
- Regional Presence
- SWOT Analysis
- DuPont de Nemours, Inc.
- Thermo Fisher Scientific Inc.
- E. I. du Pont de Nemours and Company
- Agilent Technologies, Inc.
- Biorigin
- BioWorks Inc.
- Micromeritics Instrument Corporation
- DuPont Pioneer
- Particle Sciences Inc.
Recent Developments
- In 2022, DuPont acquired Microbac Laboratories, Inc., a leading manufacturer of microbial products for industrial, environmental, and food processing applications. The acquisition expanded DuPont's portfolio of microbial solutions and technologies.
- In 2023, DuPont acquired Spectrum Plastics Group, a recognized leader in specialty medical devices and components markets. The acquisition added Spectrum's best-in-class advanced manufacturing capabilities and decades-long customer relationships to DuPont's existing healthcare portfolio.
- Report ID: 5397
- Published Date: Nov 26, 2025
- Report Format: PDF, PPT
- Explore a preview of key market trends and insights
- Review sample data tables and segment breakdowns
- Experience the quality of our visual data representations
- Evaluate our report structure and research methodology
- Get a glimpse of competitive landscape analysis
- Understand how regional forecasts are presented
- Assess the depth of company profiling and benchmarking
- Preview how actionable insights can support your strategy
Explore real data and analysis
Frequently Asked Questions (FAQ)
Biolistic Particle Delivery System Market Report Scope
Free Sample includes current and historical market size, growth trends, regional charts & tables, company profiles, segment-wise forecasts, and more.
Connect with our Expert


Copyright @ 2026 Research Nester. All Rights Reserved.
