Anti-Caking Agent Market Outlook:
Anti-Caking Agent Market size was valued at USD 1.3 billion in 2025 and is projected to reach USD 2.7 billion by the end of 2035, rising at a CAGR of 6.3% during the forecast period, from 2026 to 2035. In 2026, the industry size of anti-caking agent is estimated at USD 1.4 billion.
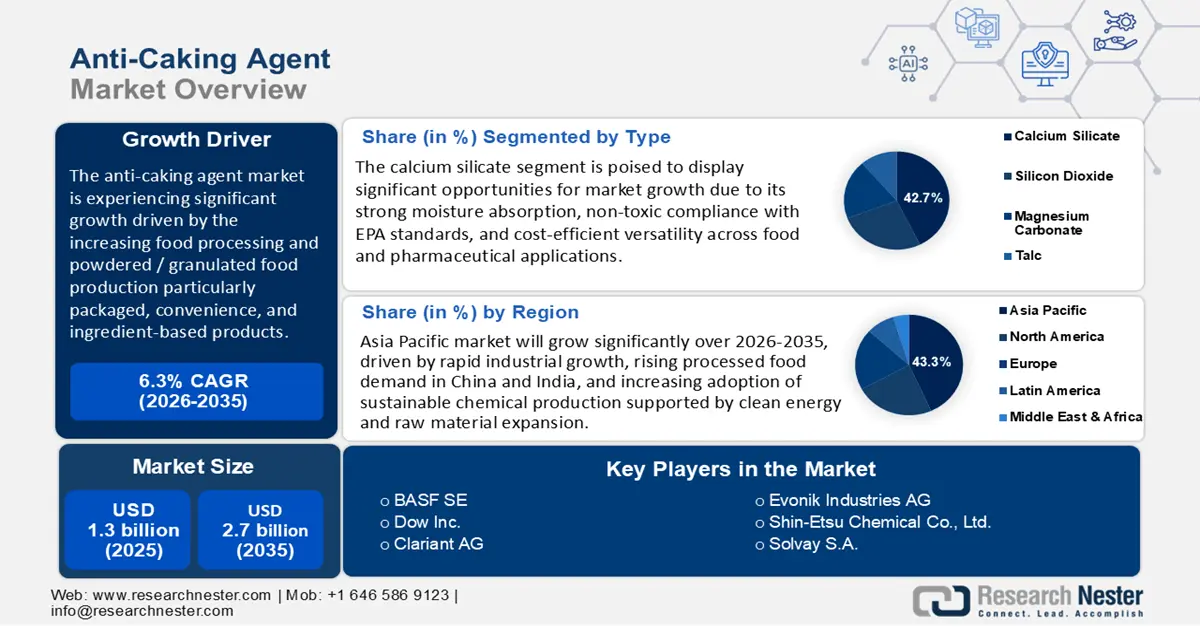
The anti-caking agent market is anticipated to grow significantly over the forecast period, primarily driven by the increasing food processing and powdered/granulated food production, particularly packaged, convenience, and ingredient-based products. This causes more of the additives that stop clumping, improve flow, and shelf life to be used. The Producer Price Index (PPI) of the commodity of materials used in the food additive production (which would also entail raw materials) was 264.996 in January 2025 (seasonally adjusted), with a year-on-year-month growth of +5.9. In addition, the rising demand from the food sector, especially for processed and convenience food items, is further stimulating the growth of the market globally. As reported by the U.S. Department of Agriculture (USDA), the global market for anti-caking additives was estimated to be around USD 3.6 billion in 2022, with forecasts suggesting an annual growth rate of 5.3% over the next five years. This expansion is linked to the necessity of preserving product quality and shelf life in powdered food products.
The supply chain for raw materials used in anti-caking agents encompasses the procurement of minerals and chemicals from diverse regions, with notable production capabilities found in nations such as China and India. For example, China has exported anti-caking agents to more than 10 countries. The growth in manufacturing capabilities is highlighted by investments in facilities like Evonik's hydrophobic fumed silica plant located in Germany. Since most anti-caking agents are mineral-based (e.g., silicates, phosphates, calcium/magnesium compounds) and chemical-based, their supply chain is very reliant on raw materials (e.g., phosphates, silicates, salts, etc.), which are usually mined or manufactured in areas with access to mineral deposits. As an example, the U.S. Economic Research Service (USDA ERS) provides data on fertilizer imports/exports. In the case of mineral or chemical fertilizers containing phosphorus, in 2023, the U.S. exported minerals to Canada of approximately USD 1,535,480 (thousand USD) of about 662,093 Kg. Also, the fertilizer trade statistics indicate the high dependence on the imported raw materials, particularly on potassium (potash) and phosphates. The data on fertilizers and raw minerals in global trade is high in terms of quantity and quality, and there are indications that the supply of some of the raw inputs is available but influenced by the trade policy, tariffs, and supply inputs. For example, since 2020, net imports of phosphate rock in the U.S. have contributed to the annual consumption, which amounts to about 6% to 16%.
Key Anti-Caking Agent Market Insights Summary:
Regional Highlights:
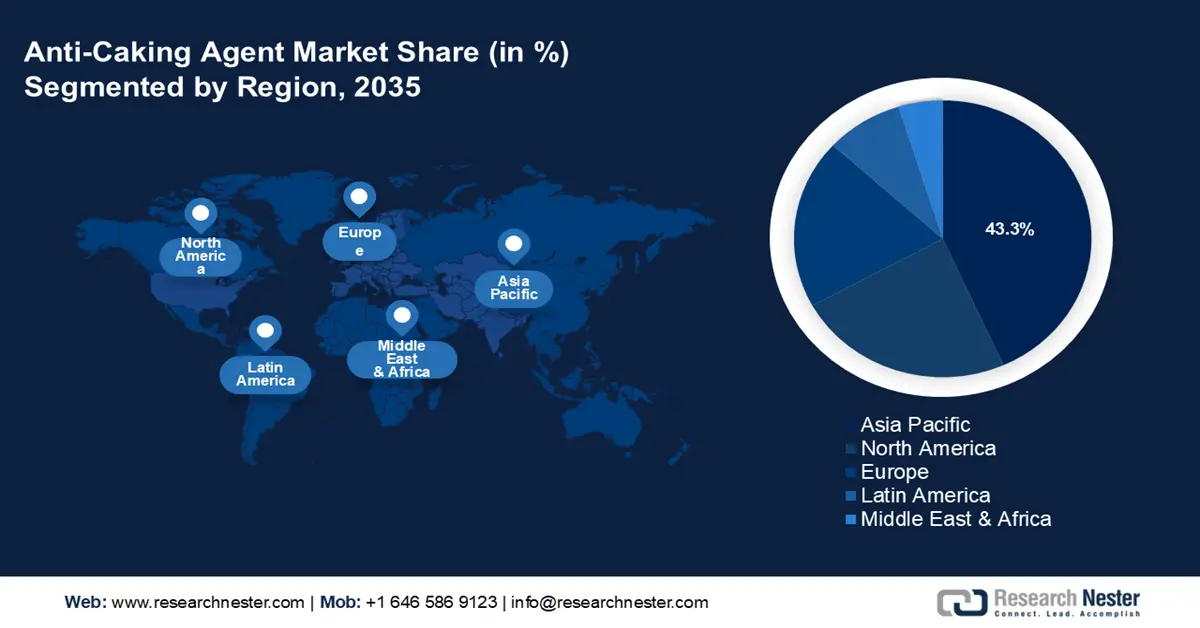
- Asia-pacific is anticipated to secure a 43.3% revenue share by 2035 in the anti-caking agent market as a result of its rapid industrial development and expanding food processing sector.
- North america is projected to account for a 23.7% share by 2035 driven by rising demand within pharmaceuticals and food industries alongside strong regulatory support for sustainable chemical manufacturing.
Segment Insights:
- Calcium silicate is anticipated to capture a 42.7% share of the anti-caking agent market by 2035 supported by its strong moisture absorption properties and broad acceptance in regulated food and pharmaceutical applications.
- The food additives segment is projected to secure a 37.3% share through the forecast period propelled by heightened demand for powdered food products and strict quality standards in processed food manufacturing.
Key Growth Trends:
- Technological advancements in production methods
- Shift towards sustainable and green alternatives
Major Challenges:
- Pricing pressures and cost sensitivity
- Market access barriers and trade restrictions
Key Players: Dow Inc., Clariant AG, Nouryon (formerly AkzoNobel Specialty Chemicals), Evonik Industries AG, Shin-Etsu Chemical Co., Ltd., Solvay S.A., The Chemours Company, Arkema S.A., Wacker Chemie AG, Mitsubishi Chemical Corporation, Galaxy Surfactants Ltd., LKAB Minerals, Songwon Industrial Co., Ltd., Synthomer plc.
Global Anti-Caking Agent Market Forecast and Regional Outlook:
Market Size & Growth Projections:
- 2025 Market Size: USD 7.41 billion
- 2026 Market Size: USD 7.78 billion
- Projected Market Size: USD 12.66 billion by 2035
- Growth Forecasts: 5.5% CAGR (2026-2035)
Key Regional Dynamics:
- Largest Region: Asia Pacific (43.3% Share by 2035)
- Fastest Growing Region: Europe
- Dominating Countries: United States, Germany, France, China, Japan
- Emerging Countries: China, India, Japan, South Korea, Thailand
Last updated on : 29 September, 2025
Anti-Caking Agent Market: Growth Drivers and Challenges
Growth Drivers
- Technological advancements in production methods: New developments in production technologies are enhancing the efficiency and sustainability of the manufacturing process for anti-caking agents. The implementation of advanced catalytic processes and automation has resulted in a 21% decrease in energy consumption in certain facilities. These developments not only reduce operational expenses but also correspond with environmental sustainability objectives, rendering products more appealing to eco-conscious consumers. Furthermore, according to U.S. statistics in the Manufacturing Energy Consumption Survey, the chemical industries in the total manufacturing sector energy usage contribute approximately 29% of the total manufacturing sector energy usage, and energy savings through equipment upgrading and process optimization in the areas of separation, compression, and feedstock handling are highly possible.
Further adopting combined heat and power (cogeneration) in the chemical and plastics manufacturing sectors can provide up to 45% of energy savings in greenhouse gases per plant. Measurable reductions in fuel consumption and operating downtime are being realized at facilities that are upgrading furnace/cracking tube material, enhancing the use of better absorption, lower temperature distillation, or more effective process control. - Shift towards sustainable and green alternatives: There is an increasing demand for eco-friendly and sustainable anti-caking agents, influenced by consumer preferences and regulatory requirements. The European Union's Green Deal highlights the importance of utilizing renewable chemicals and minimizing carbon footprints. This transition is prompting manufacturers to create bio-based and biodegradable anti-caking agents, thereby broadening their market presence and adhering to environmental standards. The EU, under its revised Renewable Energy Directive and policies, has set the target of renewable energy in EU consumption to 42.5% by 2030, a significant increase on the current 23% in 2022. The further requirement of the EU Chemicals Strategy for Sustainability is that new chemicals should be designed to be safe and sustainable, where manufacturers should decrease the use of fossil feeds and focus on renewable or bio-derived materials. Also, the Green Deal Industrial Plan and Clean Industrial Deal combine fiscal incentives, trade policy assistance, and regulatory easing to produce low-carbon chemicals. The manufacturers who are complying with these structures are accessing funds, market favor, and regulatory leeway.
- Regulatory pressure & health/safety standards: The regulatory pressure in relation to health, safety, and environmental impact is another potent force that is propelling the market of anti-caking agents. Governments and agencies are placing more and more regulations on the use of some of the additives or certain chemicals that are considered dangerous (e.g., PFAS, heavy metals), and this requires them to resort to more environmentally friendly alternatives, such as anti-caking agents. There is also pressure of regulation through stricter EU regulations on food additives and specifications. The Union list under Regulation (EC) No. 1333/2008 contains all food additives (including anti-caking agents) and must meet safety and purity standards (as established under Regulation (EU) No. 231/2012).
Under the re-evaluation program, the European Food Safety Authority (EFSA) has now issued 135 scientific opinions on 243 additives, 72 of which are still under review as of mid-2025. The EU, in its turn, states in its report on the Transition Pathway of the Chemical Industry that approximately 80% of the measures that have been identified to mitigate the adverse effects of chemicals production on the environment and human health have already started being put in place. Safety of chemicals is not only a cost burden to current materials but also puts obstacles to entry in non-compliant suppliers, hence the favorable strategy to innovation and investment in green R&D.
Trade Dynamics
Silicon dioxide is one of the most widely used anti-caking additives in food, feed, and industrial applications, as it prevents clumping, improves flow properties, and enhances product shelf life. Rising imports ensure a consistent supply to domestic processors and food manufacturers, particularly in regions where local production is limited. This steady availability supports large-scale adoption across industries such as bakery, powdered foods, seasonings, fertilizers, and pharmaceuticals. Additionally, growing trade volumes of silicon dioxide lower input costs, expand product variety, and encourage formulators to integrate it more extensively. Overall, increasing imports of silicon dioxide directly strengthens the anti-caking agents’ market by meeting demand for high-purity, reliable, and cost-effective raw materials.
U.S. Silicon Dioxide Imports by Country, 2022
|
Country |
Import Value (USD thousands) |
Quantity (kg) |
|
China |
249,253.17 |
120,448,000 |
|
Germany |
107,416.65 |
12,420,600 |
|
Japan |
79,175.39 |
10,454,900 |
|
United Kingdom |
22,808.56 |
4,142,150 |
|
India |
8,373.10 |
3,464,900 |
|
Canada |
3,561.63 |
275,333 |
(Source: worldbank.org)
U.S. Natural magnesium carbonate (magnesite) imports by country, 2022
|
Country |
Import Value (USD, thousands) |
Quantity (kg) |
|
China |
6,150.85 |
11,810,000 |
|
Japan |
2,081.44 |
553,000 |
|
India |
19.06 |
23,000 |
|
Germany |
15.89 |
9,000 |
(Source: worldbank.org)
Challenges
- Pricing pressures and cost sensitivity: The ongoing fluctuations in raw material costs and fierce price competition are exerting continuous pressure on profit margins. Pricing strategies need to consider the increasing compliance costs while still being competitive in the marketplace. For example, in 2022, there was a 13% increase in global production costs attributed to the price volatility of essential inputs such as silica and calcium carbonate.
- Market access barriers and trade restrictions: Tariffs, import quotas, and non-tariff barriers hinder the efficiency of supply chains, resulting in extended lead times and higher costs. As per data from the WTO, trade tensions led to an 8% decline in chemical trade flows between China and the U.S. in 2021. Additionally, customs delays and regulatory challenges further complicate global supply operations.
Anti-Caking Agent Market Size and Forecast:
| Report Attribute | Details |
|---|---|
|
Base Year |
2025 |
|
Forecast Year |
2026-2035 |
|
CAGR |
6.3% |
|
Base Year Market Size (2025) |
USD 1.3 billion |
|
Forecast Year Market Size (2035) |
USD 2.7 billion |
|
Regional Scope |
|
Anti-Caking Agent Market Segmentation:
Type Segment Analysis
Calcium silicate is anticipated to capture a 42.7% share of the anti-caking agent market, leading the industry owing to its excellent moisture absorption and anti-caking characteristics, which render it a favored option in the food and pharmaceutical sectors. The Environmental Protection Agency emphasizes the material's non-toxic nature and adherence to environmental standards, which promotes its use particularly in regulated markets such as North America and Europe. Its adaptability and cost efficiency further support the projection of a 42% revenue share.
Food Grade is commonly regulated by the U.S. Food and Drug Administration under 21 CFR 172.410, which allows it to be used at up to 2% by weight in most food and up to 5% in baking powder in good manufacturing practices. It is also listed in the FDA Food Substances Database due to its role as an anti-caking and free-flowing agent in powdered foodstuffs. Pharmaceutical Grade is utilized as an excipient in the form of a tablet and capsule and has higher purity and compositional requirements than a drug formulation. It has to meet specifications that have been specified on pharmaceutical excipients, should be free of contaminants, and be consistent as stipulated under current Good Manufacturing Practice (cGMP) specifications, as mandated by the FDA under 21 CFR Part 210211. These two grades are used in different markets of manufacturing food and pharmaceuticals, but both use the anti-caking property of calcium silicate to ensure the stability and flowability of the products.
Application Segment Analysis
The food additives segment is projected to account for 37.3% of the global anti-caking agent market, continuing to generate the largest revenue share due to strict quality standards and a growing consumer demand for powdered and granulated food items. Anti-caking agents such as calcium silicate and silicon dioxide play a crucial role in maintaining the flow of powders, which is vital for processed food products. As per reports from the FDA and USDA, the increasing demand for packaged foods, particularly in developing regions, is anticipated to expand at a CAGR of 4.3% through 2035, thereby enhancing the consumption of anti-caking agents.
The bakery and confectionery subsegment is a crucial contributor to the demand for anti-caking agents since they need to use powdered substances such as baking mixes and icing sugar, free-flowing and moist at the same time. The U.S. trade data demonstrates that imports of bakery and confectionery products are on the rise, as the imports grew to USD 1757.43 million in February, as compared to USD 1731.17 million in January of 2024, which indicates high production volumes and the necessity of additives that maintain the preservation of products. Meanwhile, the seasoning/condiments sub-group drives high demand as it needs the use of anti-caking agents to ensure free-flow characteristics in dry spice mixtures and powdered sauces. In 2024, the U.S. exported condiments and sauces to a total of USD 2.39 billion, a fact that indicates an ongoing demand for stable, ready products globally.
End use Segment Analysis
The food & beverages segment in the anti-caking agent market is expected to grow steadily over the projected year, owing to the large-scale utilization of powdered and granulated ingredients, in which flowability and moisture resistance are needed. The growing world demand for packaged, shelf-stable foods and convenience products, such as instant soups, spice mixes, bakery premixes, and powdered beverages, has enhanced the use of anti-caking additives to preserve the texture and shelf life. The U.S. export of processed food products in the year 2024 was USD 39.4 billion and 11.32 million metric tons, which indicates the size of the segment and diversity of the products in the international market. In addition, food and beverage manufacturing is used domestically and has 1.7 million workers, and it is 15.4% of all manufacturing jobs in the U.S., indicating that there will be an industrial need for ingredient stabilization and flow control in large-scale manufacturing.
Our in-depth analysis of the anti-caking agent market includes the following segments:
|
Segment |
Subsegment |
|
Type |
|
|
Application |
|
|
End-use |
|

Vishnu Nair
Head - Global Business DevelopmentCustomize this report to your requirements — connect with our consultant for personalized insights and options.
Anti-Caking Agent Market - Regional Analysis
Asia Pacific Market Insights
Asia-Pacific is anticipated to dominate the global anti-caking agent market with the largest revenue share of 43.3% by 2035, driven by its swift industrial development and the growth of its food processing sector. This notable market position is fueled by the rising demand in nations such as China and India, where the increasing consumption of packaged and processed foods is consistently enhancing the utilization of anti-caking agents across multiple sectors, including food, agriculture, and chemicals. In 2024, clean energy consumption in China increased to 28.6% of the total energy consumption, an increase of 2.2% points compared to the previous year, which shows the increasing pressure on regulations and changes in infrastructural patterns that favor sustainable chemical production. In the meantime, the sourcing of sulphuric acid (100%) in China rose by 6.9% in 2024 compared to 2023, indicating that the chemical raw materials industry is growing. These trends in both chemicals/raw materials and the usage of cleaner energy in APAC are the basis of expected demand in the case of the anti-caking agent because food, pharma, and industrial industries need better stability and adherence to environmental standards.
China anti-caking agent market is set to lead the region with the highest revenue share by 2035, driven by swift industrialization, stringent sustainability requirements, and government incentives that encourage green chemical technologies. The 2023 policy reforms from the Ministry of Ecology and Environment promote cleaner production practices, while ChemChina's investments in sustainable manufacturing increase capacity. Furthermore, China's extensive chemical manufacturing infrastructure facilitates economies of scale, thereby enhancing the demand for anti-caking agents in the food, pharmaceutical, and industrial sectors. Moreover, China has recorded objective progress in environmental control, as in 2024, the average amount of PM2.5 in 339 large cities was 29.3 micrograms per cubic meter, which is reduced by 2.7% each year, and it is below the interim level of 35 mcg/ cubic meter.
India’s anti-caking agent market is projected to grow substantially over the forecast period from 2026 to 2035, owing to the expanding food processing industry, which is a direct driver of demand for anti-caking agents in the powdered, granulated, and dry mix products. The food processing market is expected to increase its production to USD 535 billion in the FY 2025-26. The industry has a manufacturing contribution of approximately 7.7% and currently has a population of more than 7 million individuals in the value chain. Even the chemicals sector of India (anti-caking agents represent one of its subcategories) is worth approximately USD 220 billion, as of 2023, and declines to approximately USD 40 billion by 2026. Furthermore, the export of processed food in the Fiscal Year 2023-24 in India was estimated to be USD 10.88 billion, which makes up 23.4% of the total agri-food exports of an estimated USD 46.4 billion. It means that the processed food industry is developing tremendously, and its percentage of agri-food exports grew to 23.4% in FY 2023-24 compared to 13.7% in FY 2014-15. Therefore, the increase in food processing volumes, the development of the chemical industry, and the unambiguous regulation leave make the Indian anti-caking agent market grow steadily.
North America Market Insights
The North American market is projected to account for 23.7% of the global anti-caking agent market, propelled by a growing demand within the pharmaceuticals and food sectors. Significant trends encompass a heightened regulatory emphasis on sustainable chemical manufacturing and innovations that receive backing from federal funding. Government initiatives that advocate green chemistry and chemical safety contribute to the expansion of the market. Furthermore, the burgeoning clean energy chemical industry stimulates investments in advanced manufacturing processes and adherence to environmental regulations. Furthermore, in 2023, the U.S. Department of Energy allocated USD 78 million to the decarbonization of the chemicals manufacturing sector, including the development of process intensification and cleaner reactor technologies. Meanwhile, the DOE also announced an open funding of USD 150 million in 2022 to conduct research in order to reduce carbon emissions in manufacturing and energy technologies. Such investments lower the cost pressures and assist the manufacturers to meet the higher environmental regulations, which consequently favors the increased demand of anti-caking agents manufactured using cleaner and more sustainable practices in North America.
The anti-caking agent market in the U.S. is expected to lead the North American market with the largest revenue share over the projected years, driven by the increased demand for processed and packaged foods, which, in large part, are dependent on the use of additives to stabilize product flow. The growing use of ready-to-eat foods, powdered mixes, spices, and baking ingredients by consumers demands that manufacturers use anti-caking agents to keep the product free-flowing and lump-free during storage and transportation. Additionally, the U.S. Food and Drug Administration (FDA) has guaranteed regulatory clarity, which promotes market development. The official definition of the anti-caking agents is provided in the 21 CFR 170.3(1) and states that they are substances in which the clumping of finely powdered or crystalline food products is prevented. There is also the trend of consumer awareness on food safety and clean label, which contributes to the market by compelling food producers to work with well-regulated, approved additives.
Moreover, the U.S. Bureau of Labor Statistics (BLS) reported a total of 1,774.7 thousand as of June 2025 (seasonally adjusted) total employment in the food manufacturing sector (NAICS 311). This number indicates continuous demand and active production in the food industry of the U.S., which contributes to constant consumption of functional additives such as anti-caking agents. The production and nonsupervisory employees, in particular, amounted to 1,393.4 thousand in the same period. This increased the significance of the quality and stability of the product in extended distribution chains, and this further justifies the use of anti-caking agents in any industry.
Canada’s anti-caking agent market is likely to grow steadily over the forecast years by 2035, due to the growing food processing operations, new additive policy, and rising demand for quality powdered and granulated products. The chemical/ manufacturing industry in Canada demonstrates strong size as well as employment, which enhances the development of other related markets such as anti-caking agents. In 2022, the overall sales of the chemical industry in Canada amounted to CAD 72.7 billion, which represents an increase of approximately 30 percent as compared to 2019, when the country was not under COVID restrictions. The sales of industrial chemicals alone amounted to CAD $34.2 billion, which is only an increase of approximately 32% over 2019. In 2022, the sector itself provided 90,800 individuals with employment opportunities, and indirectly, another multiple of these via supply chain jobs and downstream customers. Additionally, the chemical manufacturing subsector contributes to the GDP of the province of Ontario, creating approximately $10 billion in 2023, and representing about 11.3% of the province, and employs approximately 56,300 people. These statistics suggest that there will be an increasing domestic demand for inputs like anti-caking agents (food, pharma, and industrial purposes) and production capacity.
Europe Market Insights
The European anti-caking agent market is likely to expand significantly over the projected years with a revenue share of 19.8%, owing to stringent regulations under strict food safety laws, primarily governed by the European Food Safety Authority (EFSA). Additives such as silicon dioxide (E551) and ferrocyanides (E535, E536) are re-evaluated by EFSA to ascertain that they are safe to consumers provided appropriate limits are met. These caking inhibitors eliminate caking in powdered products like salt, spices, and protein products, and ensure the flowability of the products. The regulations of the European Union, such as Commission Implementing Regulation (EU) 2025/708, categorize substances under a technological additives category, and thus, their safety and effectiveness in feed and food applications are certain. Silicon dioxide, which is a common anti-caking agent, is regarded as safe with no reported acceptable daily intake, as it is not toxic. New issues on nanomaterials in calcium silicate and other additives are being researched in order to contain the threats.
Moreover, in the UK, the Food Standards Agency (FSA) keeps a list of approved additives and E numbers, so anti-caking agents are controlled by this agency to provide safety and transparency to consumers. The July 2025 guidance by FSA outlines the allowed additives in processed foods under stringent circumstances, which stabilize the market and quality of products. The Federal Institute of Risk Assessment (BfR) of Germany regulates the safety of food additives such as anti-caking agents through scientific evaluations and regulatory recommendations. Germany has adhered to EU standards, but it participates in risk assessments to promote safe usage in food items, especially focusing on the health of the consumer and environmental effects.
Key Anti-Caking Agent Market Players:
- BASF SE
- Company Overview
- Business Strategy
- Key Product Offerings
- Financial Performance
- Key Performance Indicators
- Risk Analysis
- Recent Development
- Regional Presence
- SWOT Analysis
- Dow Inc.
- Clariant AG
- Nouryon (formerly AkzoNobel Specialty Chemicals)
- Evonik Industries AG
- Shin-Etsu Chemical Co., Ltd.
- Solvay S.A.
- The Chemours Company
- Arkema S.A.
- Wacker Chemie AG
- Mitsubishi Chemical Corporation
- Galaxy Surfactants Ltd.
- LKAB Minerals
- Songwon Industrial Co., Ltd.
- Synthomer plc
The anti-caking agent market is intensely competitive, primarily led by various chemical conglomerates that emphasize sustainability and innovation. Major companies allocate resources to research and development, the creation of environmentally friendly products, and strategic acquisitions to increase their market presence. Firms from Germany, the United States, and Japan are at the forefront, boasting robust global distribution networks and technology-oriented solutions, whereas new entrants from India and South Korea are swiftly growing by leveraging cost-efficient manufacturing and regional market access. The table below details a list of the top 15 global anti-caking agent market players by market share and country of origin, followed by a concise competitive landscape paragraph.
Top Global Anti-Caking Agent Market Manufacturers:
Recent Developments
- In March 2025, BASF released a series of biodegradable innovations in personal care, which are natural-based, and products aligned to the sustainability trend can also be applied in food and feed anti-caking agents. These novelties aim at improving the performance of ingredients and satisfying the need for additives that are environmentally friendly. Sustainability and innovation are the core elements that guide the expansion of BASF's portfolio in additives that assist in regulatory compliance and consumer choice of clean-label products. The formal press release emphasizes the approach of BASF to incorporate natural-origin ingredients, which can enhance the product efficacy as well as the environmental favorability.
- In October 2024, the European Food Safety Authority reassessed the safety of silica in the form used by Evonik as a food additive, which strengthened its extensive application as an anti-caking additive. The company also launched its own high-end silica-based anti-caking agents, which may allow improved flowability of food and pharmaceutical powders and decrease caking at the Institute of Food Technologists (IFT) in 2025. These types of inventions assist in stability, waste minimization, and compliance with high regulation standards, which make Evonik a market leader of effective and secure anti-caking solutions.
- Report ID: 2646
- Published Date: Sep 29, 2025
- Report Format: PDF, PPT
- Explore a preview of key market trends and insights
- Review sample data tables and segment breakdowns
- Experience the quality of our visual data representations
- Evaluate our report structure and research methodology
- Get a glimpse of competitive landscape analysis
- Understand how regional forecasts are presented
- Assess the depth of company profiling and benchmarking
- Preview how actionable insights can support your strategy
Explore real data and analysis
Frequently Asked Questions (FAQ)
About this Report
Connect with our Expert

Report, 2026-2035


Copyright @ 2026 Research Nester. All Rights Reserved.
