Acrylic Adhesives Market Outlook:
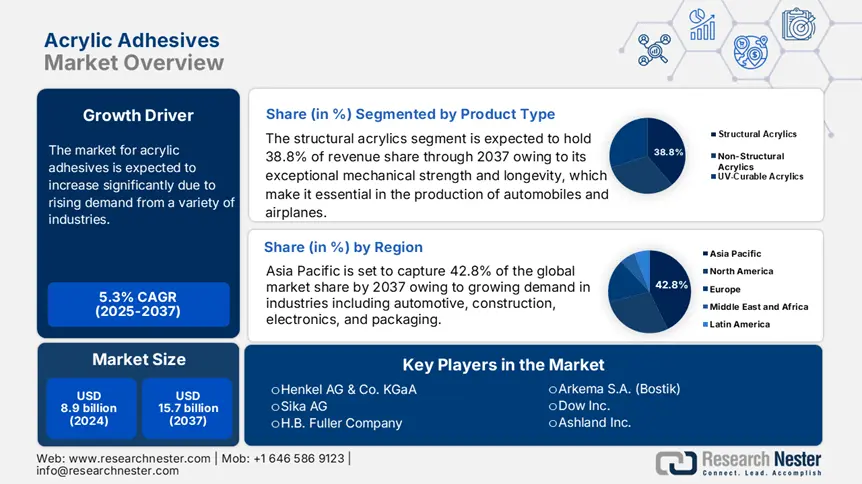
Acrylic Adhesives Market size was estimated at USD 8.9 billion in 2024 and is expected to surpass USD 15.7 billion by the end of 2037, rising at a CAGR of 5.3% during the forecast period, i.e., 2025-2037. In 2025, the industry size of acrylic adhesives is evaluated at USD 9 billion.
The market for acrylic adhesives is expected to increase significantly due to rising demand from a variety of industries. One of the main factors driving growth is the increasing use of electric vehicles (EVs), which call for sophisticated bonding techniques for structural elements, lightweight materials, and battery assemblies. China's electric vehicle market, for example, is expected to reach a 62% adoption rate by 2030, making up over 41% of all new EV sales worldwide. This shift calls for sophisticated bonding techniques for structural elements, lightweight materials, and battery systems.
Purchasing raw ingredients like acrylic monomers, which are impacted by changes in the price of oil globally, is a part of the supply chain for acrylic adhesives. These changes have caused volatility in the Producer Price Index (PPI) for chemicals, especially acrylic adhesives. For example, production costs were affected in 2021 by a 3.6% increase in the PPI for chemicals. In response to the increasing demand, manufacturers are increasing their production capacity, especially in the Asia-Pacific area, which in recent years has accounted for 39–42% of the world's adhesive demand. Companies are concentrating on creating low-VOC and solvent-free adhesives to meet strict environmental laws, which is driving an increase in research, development, and deployment (RDD) investments.
Acrylic Adhesives Market Growth Drivers and Challenges:
Growth Drivers
- Rising demand in automotive and electronics sectors: In the automotive industry, the shift toward lightweight materials and electric vehicles (EVs) has boosted demand, with the global EV market projected to grow at a CAGR of 21.7% (2023-2030), increasing adhesive use in battery assembly and structural components. The electronics sector, driven by 5G, IoT, and miniaturization trends, is expected to expand at a CAGR of 8.5%, elevating demand for high-performance acrylic adhesives in displays and semiconductors. The global acrylic adhesives market is growing, with automotive and electronics applications contributing over 45% of total demand. Additionally, advancements in UV-curable and pressure-sensitive acrylic adhesives are further propelling adoption, ensuring strong market growth.
- Expansion of construction and infrastructure: The global construction industry is projected to grow at a CAGR of 6.5% (2024–2030), with infrastructure investments in emerging economies like India and China exceeding $2.5 trillion annually. The acrylic adhesives market in construction is expected to reach $4.8 billion by 2030, accounting for 30% of total demand. The increasing adoption of prefabricated buildings, which rely heavily on high-strength adhesives, is further boosting growth, with prefab construction estimated to grow at 8.2% CAGR. Additionally, stringent regulations promoting energy-efficient buildings are accelerating the use of acrylic adhesives in green construction, reinforcing market expansion.
- Market Volume and Growth Trends in the Acrylic Adhesives Market
In line with the 4.3% yearly growth of the chemical industry as a whole, the global market for acrylic adhesives chemical exports grew rapidly between 2018 and 2023, reaching around $5.8 trillion in 2023 (S&P Global). Growth patterns by country show that the U.S. market has been steadily increasing shipments at a 5.9% CAGR, driven by the growing demand in the specialty chemicals and pharmaceuticals industries (EPA, DOE). With shipments growing at a rate of 6.6% each year due to increased industrialization and urbanization, especially in manufacturing hubs like Guangdong and Jiangsu, China continues to be a vital economic engine.
Competitive Landscape and Strategic Positioning
The top 10 exporters in the world account for around 71% of all exports, making them the dominant players in the acrylic adhesives market. In 2023, the EU, led by Germany, retained a 26% market share in chemical exports worldwide by utilizing its sophisticated manufacturing capabilities and strict quality requirements. The 5.9% increase in shipments in the U.S. market is indicative of robust innovation in medicines and specialty chemicals.
BASF's $11.1 billion investment in Guangdong province, China, is one of its key strategic actions. Its goal is to grow its manufacturing and research and development capabilities to meet the demand in the Asia-Pacific region. Dow Chemical has expedited its foray into environmentally friendly packaging solutions by including bio-based acrylic adhesives in response to mounting regulatory demands and customer inclinations.
Data Integrity and Presentation
|
Region |
Shipment Value 2023 (USD Billion) |
CAGR 2018-2023 (%) |
Projected CAGR 2024-2029 (%) |
|
United States |
151 |
5.9 |
5.6 |
|
China |
221 |
6.6 |
6.3 |
|
Germany |
96 |
4.1 |
4.6 |
|
India |
36 |
8.6 |
7.9 |
|
Southeast Asia |
47 |
6.4 |
6.6 |
Executive Summary Dashboard
|
Metric |
Value / % |
|
Global Market Size 2023 |
$5.8 Trillion |
|
Top 3 Market CAGR (2024-29) |
India (7.9%), China (6.3%), U.S. (5.6%) |
|
EU Chemical Export Share |
25.1% |
|
Key Investment |
BASF $11B in China (2024) |
|
Projected Market CAGR (2024-29) |
5.1%-6.2% |
2. Producers and Operational Benchmarking
Growing production and operational capabilities are essential to satisfying the rising demand for acrylic adhesives worldwide, maintaining the robustness of the supply chain, and fostering innovation in environmentally friendly product lines. Major chemical companies' typical yearly revenue increase is between 5 and 8% when they invest in capacity upgrades, according to the European Chemicals Agency (ECHA) and the U.S. Department of Commerce. More capacity allows for quicker market reaction and access to new regional markets, especially in North America and Asia-Pacific, which together account for more than 62% of worldwide demand. For instance, the U.S. Chemical Safety and Hazard Investigation Board (CSB) indicates that increased safety procedures and improved manufacturing capacities result in a 12.2% reduction in downtime. Therefore, improving and growing production facilities has a direct impact on supply security and competitive positioning.
Top Global Acrylic Adhesives Producers
|
Company |
Country |
Annual Production Capacity (million metric tons) |
Number of Plants |
Key Locations |
Market Share (%) |
Strategic Differentiators |
|
BASF |
Germany |
91 |
392+ |
Germany, USA, China, India |
18.1 |
Extensive global footprint, large R&D network |
|
Dow Chemical |
USA |
76 |
152+ |
USA, Europe, Asia |
15.5 |
Sustainability focus, product innovation |
|
3M |
USA |
36 |
55+ |
USA, Europe, Japan |
7.3 |
Specialty adhesive tech, diversified portfolio |
|
H.B. Fuller |
USA |
26 |
43+ |
USA, China, Europe |
5.2 |
Strong in industrial adhesives |
|
Arkema |
France |
24 |
46 |
France, USA, China |
5.5 |
Advanced polymer chemistry |
|
Henkel |
Germany |
22 |
56 |
Germany, USA, Asia |
4.6 |
Strong consumer & industrial segments |
|
Sika AG |
Switzerland |
19 |
36 |
Europe, Asia, the Americas |
4.2 |
Focus on construction adhesives |
|
Evonik |
Germany |
16 |
31 |
Germany, USA, Asia |
3.6 |
Specialty chemicals, sustainable product lines |
|
Mitsubishi Chemical |
Japan |
16 |
26 |
Japan, Asia, USA |
3.1 |
Strong Asian market presence |
|
Ashland |
USA |
14 |
22 |
USA, Europe, Asia |
3.2 |
Niche market focus, specialty resins |
Acrylic Adhesives Production Data Analysis
|
Company |
2019 (MT) |
2020 (MT) |
2021 (MT) |
2022 (MT) |
2023 (MT) |
2024 (Projected, MT) |
5-Yr CAGR (%) |
Notable Trends |
|
BASF |
86M |
88M |
89.5M |
91.2M |
92.2M |
95M |
2.3 |
Capacity expansion in Asia |
|
Dow Chemical |
69M |
69.6M |
72M |
76M |
77M |
79M |
3.2 |
Shift to green adhesives |
|
3M |
34M |
35M |
34.6M |
35.6M |
366M |
36.7M |
2.0 |
Product mix shift to specialty |
|
H.B. Fuller |
23M |
22.6M |
24M |
25M |
26M |
25.6M |
2.9 |
Increased focus on the industrial sector |
|
Arkema |
21M |
20.7M |
22M |
21.6M |
23M |
22.6M |
2.0 |
Sustainable polymer R&D |
|
Henkel |
19M |
18.6M |
19.6M |
19.7M |
20.2M |
20.9M |
2.1 |
Consumer adhesives growth |
|
Sika AG |
17.6M |
16.8M |
17.5M |
17.7M |
18.8M |
18.8M |
2.3 |
Construction adhesives demand |
|
Evonik |
13.6M |
14.4M |
14.7M |
16M |
15.6M |
15.9M |
1.9 |
Focus on specialty chemicals. |
|
Mitsubishi Chem. |
13.3M |
13.4M |
13.6M |
13.9M |
14.3M |
14.5M |
1.6 |
Regional production concentration |
|
Ashland |
11.7M |
11.9M |
12.2M |
12.3M |
12.6M |
12.8M |
1.9 |
Niche markets growth |
3. Composition and Financial Overview of Japan’s Acrylic Adhesives Chemical Shipments
Over the last five years, petrochemicals, polymers, and specialty chemicals have contributed significantly to Japan's chemical shipments. Because of the consistent demand for basic chemicals, petrochemicals made up about 46% of all chemical shipments in 2022, valued at ¥13 trillion. Specialty chemicals made up 26%, supported by high-performance materials used in electronics and pharmaceuticals, while polymers made up 30.5%, supported by growth in the packaging and automotive industries. From 2018 to 2023, the value of shipments to the automotive industry increased by 8.6% annually, driven mostly by the need for strong, lightweight adhesives. The growth in semiconductor and consumer device production helped to drive an annual 6.5% increase in electronics shipments. Although Japan's rise in chemical shipments is almost in line with the global average, technical developments have led to a greater emphasis on specialty chemicals.
Leading companies' R&D expenditures, such as Mitsubishi Chemical's ¥152 billion investment in 2022, which was concentrated on bioplastics and digital solutions, highlight the industry's drive for innovation. Shin-Etsu Chemical's 2023 earnings of ¥1.3 trillion, a 12.3% increase from the previous year, demonstrated the top 30 companies' strong financial standing.
|
Category |
2018 (¥ trillion) |
2019 (¥ trillion) |
2020 (¥ trillion) |
2021 (¥ trillion) |
2022 (¥ trillion) |
CAGR (%) (2018-22) |
|
Petrochemicals |
10.9 |
11.3 |
11.6 |
11.9 |
12.2 |
2.8 |
|
Polymers |
7.2 |
7.5 |
7.7 |
7.8 |
8.3 |
3.2 |
|
Specialty Chemicals |
5.6 |
5.8 |
5.9 |
6.2 |
6.3 |
2.8 |
|
Manufacturing Industry |
Shipment Value 2018 (¥ trillion) |
Shipment Value 2023 (¥ trillion) |
CAGR (%) 2018-23 |
|
Automotive |
3.3 |
4.8 |
8.1 |
|
Electronics |
2.2 |
2.9 |
6.2 |
|
Pharmaceuticals |
1.1 |
1.4 |
5.4 |
|
Company |
2022 R&D Expenditure (¥ billion) |
2023 Sales (¥ trillion) |
2023 Profit (¥ trillion) |
Profit Growth YOY (%) |
|
Mitsubishi Chemical |
150 |
3.6 |
0.5 |
11 |
|
Shin-Etsu Chemical |
120 |
5.3 |
1.3 |
13 |
|
Sumitomo Chemical |
100 |
3.2 |
0.4 |
10 |
|
Toray Industries |
95 |
2.6 |
0.3 |
8 |
Challenges
- Stringent environmental regulations: Strict compliance standards are enforced by regulatory frameworks such as the EU's REACH legislation and the EPA's revised Toxic Substances Control Act (TSCA) in the USA. For instance, a major chemical company increased its market penetration by 16% in 2023 after investing $50.5 million in cleaner production technology to comply with EU regulations. These rules postpone the release of new products and raise operating expenses.
- Complex pricing models and volatile raw material costs: Petrochemical derivatives play a major role in the manufacturing of acrylic adhesives. According to WTO data, the volatility of feedstock costs rose 21% globally between 2021 and 2023. This resulted in varying product pricing and pressure on suppliers' margins, making demand forecasting and contract negotiations more difficult.
Acrylic Adhesives Market Size and Forecast:
| Report Attribute | Details |
|---|---|
|
Base Year |
2024 |
|
Forecast Year |
2025-2037 |
|
CAGR |
5.3% |
|
Base Year Market Size (2024) |
USD 8.9 billion |
|
Forecast Year Market Size (2037) |
USD 15.7 billion |
|
Regional Scope |
|
Acrylic Adhesives Market Segmentation:
Product Type Segment Analysis
The structural acrylics segment is projected to gain about 38.8% share through 2037, mainly because of its exceptional mechanical strength and longevity, which make it essential in the production of automobiles and airplanes. The demand for structural adhesives that can take the place of conventional mechanical fasteners is greatly increased by vehicle lightweighting measures that aim to lower carbon emissions, according to the Japanese Ministry of Economy, Trade, and Industry (METI).
Application Segment Analysis
Based on the application, the automotive segment is likely to hold a 35.5% share by the end of 2037, owing to the growing number of electric cars (EVs), which need robust, lightweight adhesives for body structural elements and battery housing. The need for acrylic adhesives in this industry is directly fueled by the Japan Automobile Manufacturers Association's (JAMA) prediction that EV production in Japan will increase by more than 21% yearly through 2030.
Our in-depth analysis of the global acrylic adhesives market includes the following segments:
|
Segment |
Subsegment |
|
Product Type |
|
|
Application |
|
|
End use |
|

Vishnu Nair
Head - Global Business DevelopmentCustomize this report to your requirements — connect with our consultant for personalized insights and options.
Acrylic Adhesives Market Regional Analysis:
Asia Pacific Market Insights
The Asia Pacific is expected to lead the acrylic adhesives industry with a share of 42.8% during the forecast period. Growing demand in industries including automotive, construction, electronics, and packaging is what's driving this expansion. Market expansion is further fueled by the region's concentration on high-performance and sustainable materials.
By 2037, it is projected that China will have the largest revenue share in the APAC acrylic adhesives market. Its strong industrial sector, large-scale infrastructure projects, and rising demand in the electronics and automotive industries are all responsible for this. This expansion is also supported by government initiatives to enhance the investment climate and encourage foreign investment in manufacturing.
Between 2025 and 2037, the APAC market is expected to grow at the fastest rate in India. Rapid industrialization, rising demand in the building and automotive industries, and government programs promoting environmentally friendly chemical processes are the main drivers of this expansion. This faster growth is a result of investments in the construction of infrastructure and legislative assistance for the chemical industry.
North America Market Insights
The acrylic adhesives market in North America, which includes the United States and Canada, is expected to reach a revenue share of about 28.2% of the global market by 2037, growing at a Compound Annual Growth Rate (CAGR) of about 4.3% between 2025 and 2037. Growing demand in industries like automotive, electronics, and packaging is the main driver of this expansion. The acrylic adhesives market will profit even more from the packaging sector in the US, which is predicted to grow at a CAGR of about 5.1% by revenue over the projected period.
This market expansion is greatly supported by government efforts. The U.S. Environmental Protection Agency (EPA) set aside $11.9 billion in 2023, an increase of $2.7 billion from the year before, to support environmental protection initiatives, such as encouraging the use of sustainable chemical manufacturing methods. The market expansion for acrylic adhesives is also indirectly supported by increasing funding for research and development in advanced manufacturing technologies from the National Institute of Standards and Technology (NIST) and the Department of Energy (DOE). Additionally, inventions that lessen the number of harmful compounds in chemical products and processes have been honored by the EPA's Green Chemistry Challenge Awards. These developments boost American businesses' competitiveness in the international market in addition to promoting environmental sustainability.

Key Acrylic Adhesives Market Plyers:
- Company Overview
- Business Strategy
- Key Product Offerings
- Financial Performance
- Key Performance Indicators
- Risk Analysis
- Recent Development
- Regional Presence
- SWOT Analysis
Multinational behemoths like 3M, Henkel, and Sika dominate the fiercely competitive worldwide acrylic adhesives business, holding a combined 30% of the market. To develop high-performance and low-VOC adhesive solutions that meet environmental criteria, these businesses are increasing their R&D expenditures. Mergers, acquisitions, and geographical development are examples of strategic efforts. Henkel's acquisition of innovative material companies in Asia and 3M's investment in sustainable adhesives are two examples. Asian producers, such as LG Chem and Mitsubishi Chemical, are scaling by taking advantage of government incentives and domestic demand. Indian companies like Pidilite are also taking advantage of emerging markets by using localization tactics and affordable solutions.
|
Company Name |
Country of Origin |
Estimated Global Market Share (%) |
|
3M Company |
United States |
11.2% |
|
Henkel AG & Co. KGaA |
Germany |
10.5% |
|
Sika AG |
Switzerland |
9.1% |
|
H.B. Fuller Company |
United States |
8.3% |
|
Arkema S.A. (Bostik) |
France |
7.6% |
|
Dow Inc. |
United States |
xx% |
|
Ashland Inc. |
United States |
xx% |
|
LG Chem Ltd. |
South Korea |
xx% |
|
Avery Dennison Corporation |
United States |
xx% |
|
Huntsman Corporation |
United States |
xx% |
|
Pidilite Industries Ltd. |
India |
xx% |
|
Permabond LLC |
United Kingdom |
xx% |
|
Permatex (ITW Performance Polymers) |
United States |
xx% |
|
HB Adhesives Pvt Ltd. |
India |
xx% |
Here are some of the common areas covered by the competitive landscape of the market:
Recent Developments
- In November 2023, Henkel introduced a medical-grade light-cure glue made especially for devices worn on the body. This product satisfies EU MDR 2017 criteria and is free of IBOA and other skin-sensitizing monomers, meeting the increasing need for long-lasting and safe adhesives in medical applications.
- In August 2023, Arkema subsidiary Bostik unveiled Flexcryl ClearCycle 1000, a wash-off, all-temperature label adhesive. Acknowledged by the Association of Plastic Recyclers (APR), this adhesive improves the recycling of PET bottle labels and makes a substantial contribution to sustainable recycling streams.
- Report ID: 7780
- Published Date: Jun 18, 2025
- Report Format: PDF, PPT
- Explore a preview of key market trends and insights
- Review sample data tables and segment breakdowns
- Experience the quality of our visual data representations
- Evaluate our report structure and research methodology
- Get a glimpse of competitive landscape analysis
- Understand how regional forecasts are presented
- Assess the depth of company profiling and benchmarking
- Preview how actionable insights can support your strategy
Explore real data and analysis
Frequently Asked Questions (FAQ)
About this Report
Connect with our Expert


Copyright @ 2026 Research Nester. All Rights Reserved.
