Ready-to-Eat Food Market Outlook:
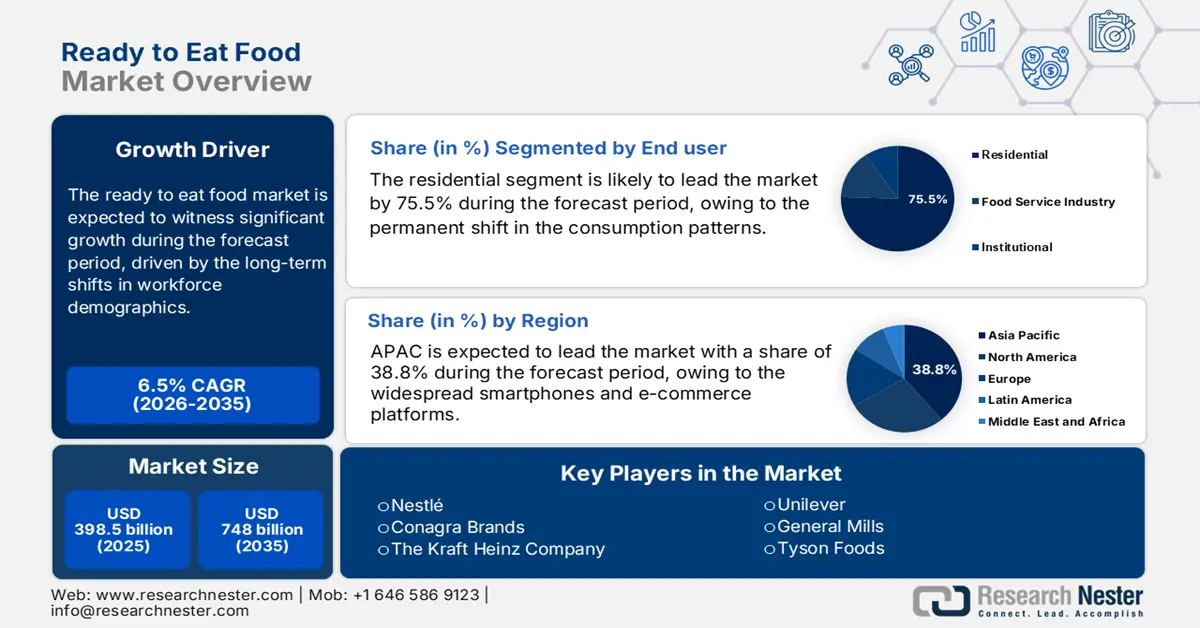
Ready-to-Eat Food Market size was valued at USD 398.5 billion in 2025 and is projected to reach USD 748 billion by the end of 2035, rising at a CAGR of 6.5% during the forecast period, i.e., 2026-2035. In 2026, the industry size of ready-to-eat food is evaluated at USD 424.4 billion.
The ready-to-eat food market continues to be shaped by measurable shifts in production volumes, import-export balances, and federal expenditure patterns reported across U.S. and international government platforms. This growth is largely driven by long-term shifts in workforce demographics and consumption patterns. The OEC data in 2023 depicts that the global trade of processed fruits and nuts reached USD 20.8 billion. This data highlights that they drive the demand as they require no further preparation and are consumed as finished packaged foods. On the other hand, according to the USDA Foreign Agricultural Service data, in 2024 depicts that the total export value of processed food products in the U.S. reached USD 39.4 billion. This export growth further increases the integration of U.S. manufacturers into global supply chains for value-added food products.
The operational environment for the ready to eat manufacturers is based on the robust regulatory ecosystem and dynamic supply chain pressures. Compliance with federal standards for food safety, nutritional content, and labeling is a foundational requirement. Agencies are updating their guidelines on aspects such as sodium reduction to meet the public health objectives. Internationally, FAO.org food balance sheets indicate that global per-capita availability of processed foods has increased steadily, with the relevant categories contributing to the growth in processed food consumption across OECD economies. These institutional data points reflect a market anchored by predictable foodservice contracts, heightened safety compliance expectations, and rising per-capita consumption in advanced economies.
Key Ready to Eat Food Market Insights Summary:
Regional Highlights:
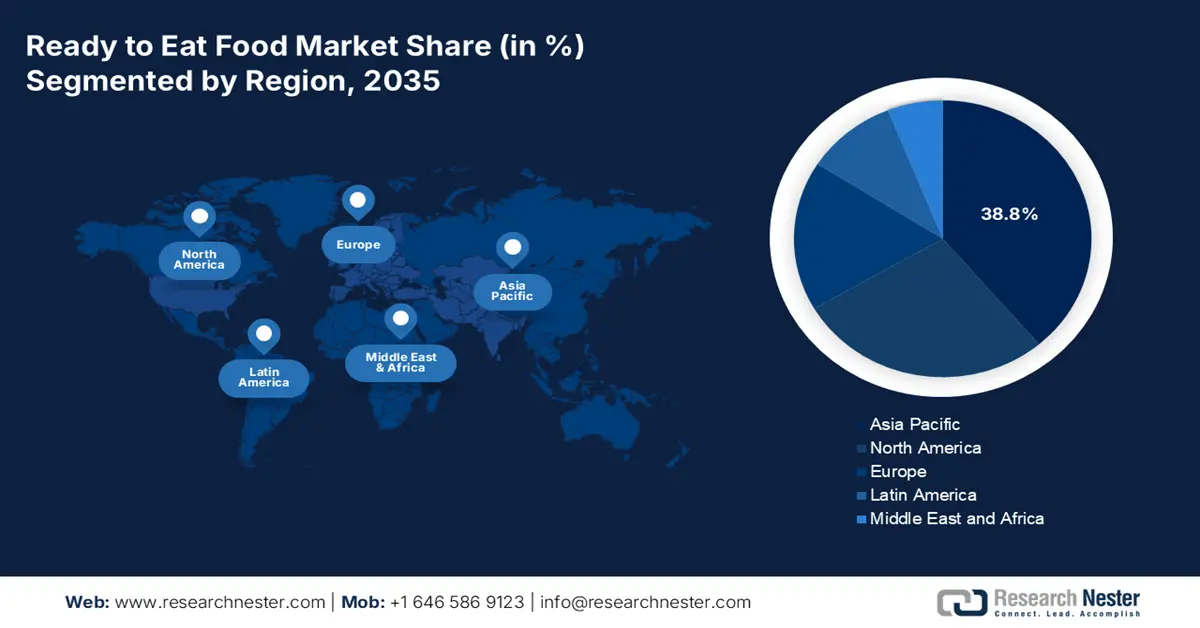
- By 2035, the Asia Pacific region is projected to secure a 38.8% share in the ready-to-eat food market, underpinned by shifting eating habits and rapid adoption of digital commerce platforms.
- North America is anticipated to expand robustly through 2035, supported by its advanced cold chain systems and growing preference for premium, health-focused meal solutions.
Segment Insights:
- The residential segment is expected to command a 75.5% share by 2035 in the ready-to-eat food market, bolstered by sustained at-home consumption patterns shaped by the long-term rise in remote work.
- By 2035, the international cuisine sub-segment is poised to capture the leading revenue share, propelled by consumers’ increasing inclination toward authentic global flavors and culinary exploration.
Key Growth Trends:
- Expansion of remote and hybrid work models
- Growth in e-commerce and direct to consumer channels
Major Challenges:
- Supply chain and ingredient sourcing volatility
- High research and development and production expenses
Key Players: Nestlé (Switzerland), Conagra Brands (USA), The Kraft Heinz Company (USA), Unilever (UK/Netherlands), General Mills (USA),Tyson Foods (USA), Kellogg's (USA), Campbell Soup Company (USA), Nissin Foods Holdings Co., Ltd. (Japan), Ajinomoto Co., Inc. (Japan), CJ CheilJedang (South Korea), MTR Foods (India), ITC Limited (India), Dr. Oetker (Germany), Nomad Foods (UK), Bakkavör Group (Iceland), McCain Foods (Canada), Brahim's Holdings Berhad (Malaysia)
Global Ready to Eat Food Market Forecast and Regional Outlook:
Market Size & Growth Projections:
- 2025 Market Size: USD 398.5 billion
- 2026 Market Size: USD 424.4 billion
- Projected Market Size: USD 748 billion by 2035
- Growth Forecasts: 6.5% CAGR (2026-2035)
Key Regional Dynamics:
- Largest Region: Asia Pacific (38.8% Share by 2035)
- Fastest Growing Region: North America
- Dominating Countries: United States, China, India, Japan, Germany
- Emerging Countries: Brazil, Indonesia, Vietnam, Mexico, South Korea
Last updated on : 25 November, 2025
Ready-to-Eat Food Market - Growth Drivers and Challenges
Growth Drivers
- Expansion of remote and hybrid work models: The structure of remote work has permanently shifted the meal consumption patterns, which increases the demand for convenient home-based lunch solutions. Recently, it is stated that nearly 33% of people are working remotely in 2022, based on the U.S. Bureau of Labor Statistics in October 2024. This trend reduces reliance on food service channels and shifts volume to grocery and e-commerce. On the other hand, for manufacturers, this necessitates packaging and portioning innovations tailored to individual, at-home consumption rather than family-sized meals. The demand is now a permanent feature of the market landscape, not a temporary anomaly. This has further led to a measurable expansion in the single-serve and lunch-centric ready to eat product category, with innovation mainly aimed at quality and freshness to replace restaurant takeout.
- Growth in e-commerce and direct to consumer channels: The USDA research has confirmed that a persistent consumer shift towards online grocery shopping, this habit has been solidified after the pandemic. This scenario makes the manufacturers develop a robust e-commerce logistics, including packaging that ensures product integrity during shipping. The direct-to-consumer model also provides invaluable first-party data on consumer preferences. Companies can use this data for targeted product development and marketing, hence creating a significant advantage over those who are solely reliant on traditional retail partnerships and mitigating risks associated with limited physical shelf space.
- Public health initiatives driving product reformulation: The government-led public health campaigns are the strong growth drivers of the ready-to-eat food market, pushing manufacturers to reformulate the products. The FDA’s voluntary sodium reduction targets are aimed at minimizing the average intake by 12% which is approximately 3,400 mg to 3,000 mg per day, based on the FDA data in October 2021. This data directly impacts the meal development in the market. Companies are heavily investing in salt alternatives and new preservation technologies to meet these guidelines without compromising the taste or shelf life. Further, the proactive formulations are not just a compliance measure but a vital competitive strategy to align with national health priorities and avoid being penalized in markets surging guided by public health policy.
Challenges
- Supply chain and ingredient sourcing volatility: The ready to eat manufacturers are vulnerable to disruptions in the supply of key ingredients, as seen during the pandemic and recent geopolitical conflicts. The price volatility for staples such as wheat and cooking oils directly has an impact on the margin profits. Companies such as Conagra Brands invest heavily in advanced supply chain analytics and expand their supplier base to reduce these risks. However, the new startups without such resources, a sudden price hike or shortage can make their product economically unviable, highlighting the critical need for flexible and resilient sourcing strategies.
- High research and development and production expenses: Making a ready to eat product requires a huge investment in food science just to get the taste, texture, and shelf-life right. This naturally means a very expensive R&D, pilot kitchens, and the need for a special production machine for processes like high-pressure processing (HPP) or modified atmosphere packaging. Plant-based meat company, such as Impossible Foods, takes almost a decade and millions of dollars just to perfect their flagship burger. For a newcomer, such a high upfront capital requirement is a major obstacle, as it has to be spent well before any revenue is generated, thus making the first phase financially unstable.
Ready-to-Eat Food Market Size and Forecast:
| Report Attribute | Details |
|---|---|
|
Base Year |
2025 |
|
Forecast Year |
2026-2035 |
|
CAGR |
6.5% |
|
Base Year Market Size (2025) |
USD 398.5 billion |
|
Forecast Year Market Size (2035) |
USD 748 billion |
|
Regional Scope |
|
Ready-to-Eat Food Market Segmentation:
End user Segment Analysis
The residential segment dominates and is expected to hold the share value of 75.5% in the ready-to-eat food market during the forecast period 2026 to 2035. The dominance of the segment is reinforced by the permanent shift in the consumption patterns that is established during the pandemic, with a significant portion of the population continuing to work from home. This has increased the demand for convenient, high-quality meal solutions for lunch and dinner. As per the Census.gov data in September 2022, the people working from home from 2019 to 2021 has tripled by 5.7% to 17.9%. This change in the working pattern, as reported in the data, directly fuels the consistent and high volume purchase of ready-to-eat foods by individuals and families for at-home consumption, securing its overwhelming revenue share.
Cuisine Type Segment Analysis
By 2035, the global international cuisine sub-segment is projected to hold the largest revenue share and is driven by demand for culinary exploration and authentic ethnic flavors by consumers at home. The growth is fueled by the rise in travel, adventure, and the influence of digital media, making consumers more adventurous. Justifying this, a recent report on food trends has highlighted the rising consumer interest in global flavors, noting that the sales of international food products have witnessed a reasonable growth in recent years. This expansion in their ethnic food aisles to meet this demand solidifies the position as the dominant cuisine type in the RTE market. Consequently, RTE manufacturers are prioritizing the development of authentic, chef-inspired global meal lines to capture this high-growth segment.
Product Type Segment Analysis
The frozen ready to eat meals hold the largest share in the segment and is expected to hold a considerable share value by 2035. The segment is driven by manufacturers reformulating products to be healthier. In line with consumer wellness trends, there is a notable change among consumers toward clean label ingredients with lower sodium and the addition of plant-based proteins. This move directly responds to the public health guidelines promoting the reduced consumption of processed foods, which have high amounts of salt, added sugars, and saturated fats. According to the USDA Food Safety and Inspection Service report in August 2024, the foods that are stored at 0°F remain safe indefinitely. Brands are positioning their frozen meals and are offering as nutritious and convenient are capturing the largest market share.
Our in-depth analysis of the market includes the following segments:
|
Segment |
Subsegments |
|
Product Type |
|
|
Distribution Channel |
|
|
End user |
|
|
Cuisine Type |
|

Vishnu Nair
Head - Global Business DevelopmentCustomize this report to your requirements — connect with our consultant for personalized insights and options.
Ready-to-Eat Food Market - Regional Analysis
APAC Market Insights
Asia Pacific market is poised to hold the largest share of 38.8% during the forecast period 2026 to 2035. The dominance is due to the widespread smartphones and e-commerce platforms. The key driver is the shift of the demographic opting for change in their eating habits and altering traditional cooking. Further rising women workers and online groceries also drives this market. Nowadays, consumers demand both western-style convenience meals and modern packaged versions of traditional local cuisines. However, the growth is tempered by the varied food regulations and persistent price sensitivity. Government initiatives, such as India's PLI scheme for food processing, aim to bolster domestic manufacturing and infrastructure, further supporting the market's expansion by improving supply chain efficiency and product quality.
In China, the ready to eat market is experiencing a rapid growth, mainly fueled by the rapid urbanization and the demanding lifestyles of its vast working-age population in megacities. A significant catalyst is the government's push to strengthen the domestic food processing industry to ensure the supply chain resilience and food security. Consumers in the country are actively seeking both health and convenience, which leads to the surge in the demand for high-quality, nutritious, ready-to-eat food options that align with the traditional Chinese dietary preferences. According to the People’s Republic of China data in January 2024, the national per capita disposable income of households was 39,218 yuan in 2023, maintaining a steady growth trajectory. This rising purchasing power directly makes consumers trade up to premium and diverse ready to eat products, moving beyond basic instant noodles to advanced meal-ready offerings.
India market is fueled by the rising young population, increasing penetration of the internet, and growing dual-income urban households. The market is defined by the strong demand for modern, convenient, and hygienic formats of traditional Indian cuisines such as ready to eat curries and dal. The growth of the market is driven by the proactive government support for the food processing sector. The Ministry of Food Processing Industries report in February 2025 depicts that India’s Production Linked Incentive Scheme for Food Processing (PLISFPI) directly supports the ready-to-eat food market by boosting investments in large-scale processed food manufacturing, including packaged meals, snacks, and shelf-stable RTE categories via its ₹10,900 crore incentive program aimed at building globally competitive food brands.
North America Market Insights
North America is predicted to be the fastest growing market and grows at a CAGR of 4.5% by 2035. The market is driven by the established cold chain infrastructure and pervasive dual income households. The primary trend is a consumer shift towards premium and health conscious options. The demand is surging mainly for the clean label, plant based and nutritionally fortified meals that is moving beyond the traditional frozen dinners. E-commerce penetration is a vital distribution channel, with supply chain investments focused on last-mile delivery for chilled goods. Various regulatory policies mainly focus on sodium reduction and transparent labeling to shape product development, ensuring alignment with public health objectives. In order to stay relevant in the market, legacy brands are being forced by this transition to actively innovate and acquire niche players.
The U.S. ready-to-eat food market is defined by the strong demand for healthier and convenient formulations of foods. The main trend is the industry response to public health initiatives such as the FDA’s voluntary reduction of sodium targets, which is pushing manufacturers to reformulate their products as per the guidelines. On the other hand, the trending remote work opportunities are demanding for single-serve and lunch-oriented solutions. Further, the rising expansion of companies in various emerging economies is leading the demand. For example, in July 2024, Mars Food & Nutrition launched Ben’s Original Street Food, Lunch Bowls, and Favorites represent a direct expansion into the ready-to-eat food category, as these products are pre-prepared, packaged meals designed for immediate consumption without additional cooking. Supply chain modernization, incentivized by government programs for climate-smart agriculture, aims to bolster the resilience of ingredient sourcing for domestic RTE production, ensuring market stability and growth aligned with national health and economic priorities.
Canada’s ready-to-eat food market growth is influenced by the strong health and labeling regulations, as well as its multicultural demographics. Health Canada's Healthy Eating Strategy, including front-of-package (FOP) labeling for saturated fat, sugars, and sodium, directly impacts product formulation and marketability. This regulatory push is the main driver for innovating products with reduced sodium and healthier ready-to-eat food options. Moreover, Canada’s immigration population growth fuels the demand for diverse authentic international cuisines in ready to eat formats. Further, new launches and the company’s expansion drive the market expansion. For example, in February 2022, Cook it announced a new ready-to-eat meal offering via a partnership with Sodexo Canada. Further, the government support for agricultural innovation, via programs such as the Canadian Agricultural Partnership, aids in securing sustainable domestic ingredient sourcing for manufacturers catering to these evolving consumer preferences.
Europe Market Insights
The ready-to-eat food market in Europe is mature and has a strong consumer base towards health and sustainability. The major trend of the market is the demand for premium, clean-label products with natural and organic ingredients, moving beyond the traditional frozen meals. Strong EU-wide regulations on food safety, environmental claims, and nutritional labeling are outlined by the European Food Safety Authority, which highly influences the product development. Further, sustainability is the key driver demanding eco-friendly packaging and ethical sourcing. Price sensitivity is stable, innovation in fresh, plant-based based and chilled ready to eat meals is creating a significant value growth. For example, the EU's Farm to Fork Strategy incentivizes healthier and more sustainable food systems, indirectly shaping RTE product formulations.
UK market is expected to hold the largest share in Europe by 2035 and is propelled by the high urban density and deeply entrenched convenience culture. The key factor is the high percentage of dual-income households and long working hours that fuel the demand for time-saving meal solutions. Further, the market is trending towards premiumization and health, with a strong demand for ready to eat meals that are free from allergens, rich in protein, and low in calories. The UK’s Food Standards Agency continues to prioritize sodium reduction, forcing the manufacturers to innovate. Supporting this, the Office for National Statistics data in November 2024, depicts that during the month of October 2024, nearly 13% of the adults in the country worked from home, sustaining the need for home-centric lunch option and driving the growth in the frozen sub-segment.
Germany is expected to lead Europe’s ready-to-eat food market and is driven by the strong economic base and the major trend towards health and sustainability. German consumers exhibit high trust in quality seals such as Bio, and this extends directly to the ready to eat sector, where organic and clean-label products are non-negotiable for growth. The market is also shaped by the rising aging population, creating a sustained demand for easy-to-prepare, nutritionally balanced meals for seniors. Further, the government bodies such as the Federal Ministry for the Environment advise on reduced packaging waste, driving innovations in recyclable and reusable packaging. The report from the German Federal Statistics Office indicated that the rising number of single-person households is driving the demand for single-serve portions in the ready to eat and supporting market expansion.
Key Ready-to-Eat Food Market Players:
- Nestlé (Switzerland)
- Company Overview
- Business Strategy
- Key Product Offerings
- Financial Performance
- Key Performance Indicators
- Risk Analysis
- Recent Development
- Regional Presence
- SWOT Analysis
- Conagra Brands (USA)
- The Kraft Heinz Company (USA)
- Unilever (UK/Netherlands)
- General Mills (USA)
- Tyson Foods (USA)
- Kellogg's (USA)
- Campbell Soup Company (USA)
- Nissin Foods Holdings Co., Ltd. (Japan)
- Ajinomoto Co., Inc. (Japan)
- CJ CheilJedang (South Korea)
- MTR Foods (India)
- ITC Limited (India)
- Dr. Oetker (Germany)
- Nomad Foods (UK)
- Bakkavör Group (Iceland)
- McCain Foods (Canada)
- Brahim's Holdings Berhad (Malaysia)
- Nestle is pioneering in the ready-to-eat food market and is advancing its position by aggressively expanding its portfolio of health-oriented and premium offerings. This strategy involves reformulating products to minimize the sodium, sugar, and artificial ingredients that directly respond to consumer demand for a cleaner label. The total number of sales registered in 2024 is 91,354 million CHF.
- Conagra Brands has made significant advancements in the ready-to-eat food market by revitalizing its iconic frozen and shelf-stable brands. With its data-driven consumer insights, the company actively focuses on improving the taste, quality, and convenience in its product line, such as Health Choice and Marie Callender's Investments in marketing and packaging. The net sales of the company in 2025 are USD 4,899.3 billion in Grocery and Snacks and USD 4,662.3 billion in refrigerated and frozen.
- The Kraft Heinz Company is leading its position in the ready-to-eat food market via its dual strategy of brand renovation and partnerships. With a shifting consumer base, the company is innovating within the core portfolio by launching new products with clean labels and improved nutritional profiles. A key initiative is using its extensive retail relationships to secure prime space while also forming alliances with emerging brands and food service channels to drive the growth.
- Unilever has carved a distinct niche in the market by incorporating its Unilever Compass strategy, which prioritizes sustainable and purpose-driven brands such as Knorr and Hellmann’s. Further, the company has made significant advancements by committing to plastic reduction and enhancing the nutritional values of its products by expanding plant-based meal options.
- General Mills ensures its leadership in the market by using consumer insights to drive innovation across its diverse brand portfolio, which includes Progresso, Old El Paso, and Annie’s. Key strategic initiatives include targeted acquisitions of niche, natural, and organic brands to tap into new consumer trends.
Here is a list of key players operating in the global market:
Companies in the ready-to-eat food market are intensely fragmented and are dominated by the multinational giants and agile regional players. The key competitors, such as Nestle and Conagra, use an extensive distribution network and brand equity. The strategic initiatives are centered on capturing health-conscious consumers via clean-label, organic, and nutritionally fortified product lines. Partnerships and acquisitions are common tactics for organization and portfolio expansion. For example, in October 2025, LT Foods acquired Hungary-based Global Green Europe Kft. for €25 million and forays into the canned food business. Similarly, heavy investments in R&D focus on improving taste, texture, and shelf life without compromising on the quality builds brand loyalty in a highly competitive and price-sensitive environment.
Corporate Landscape of the ready-to-eat food Market:
Recent Developments
- In November 2025, Aligarh-based Shivashrit Foods has announced its strategic foray into India’s traditional organized snacks market with the launch of its new product line, Shree Aahar – Namkeens.
- In July 2025, Tyson Foods proudly unveiled its newest innovation, Tyson Simple Ingredient Nuggets. The nuggets come as fully cooked and are ready to eat just after six minutes in the air fryer. They can also be heated in the oven or microwave.
- In February 2025, Bonduelle launched a new ready-to-eat lunch bowls, enhancing the meal time for college students, young professionals, and on-the-go eaters everywhere. The bowl has 100% plant-powered ingredients and is packed with 10g+ of protein to keep hungry, active people energized all day long.
- Report ID: 1291
- Published Date: Nov 25, 2025
- Report Format: PDF, PPT
- Explore a preview of key market trends and insights
- Review sample data tables and segment breakdowns
- Experience the quality of our visual data representations
- Evaluate our report structure and research methodology
- Get a glimpse of competitive landscape analysis
- Understand how regional forecasts are presented
- Assess the depth of company profiling and benchmarking
- Preview how actionable insights can support your strategy
Explore real data and analysis
Frequently Asked Questions (FAQ)
About this Report
Connect with our Expert

Report, 2026-2035


Copyright @ 2026 Research Nester. All Rights Reserved.
