1. Introduction
1.1. Market Definition
1.2. Product Overview
1.3. Market Segmentation
2. Assumptions and Abbreviations
3. Research Methodology
4. Executive Summary - Global Wearable Medical Devices Market
5. Manufacturing Standards & Compliances
6. Industry Analysis
6.1. Porter’s Five Forces Model
7. Consumer Behavior Analysis
8. Market Dynamics
8.1. Drivers
8.2. Restraints
8.3. Trends
8.4. Opportunities
9. Wearable Medical Devices Market - Risk Analysis
9.1. Demand Risk Analysis
9.2. Supply Risk Analysis
10. Global Wearable Medical Devices Market Outlook
10.1.Market Size and Forecast, 2018-2027F
10.1.1. By Value (USD Million)
10.2.Market Share and Forecast, 2018-2027F
10.2.1. By Product
10.2.1.1. Wearable Medical Devices Market Share (%), By Product (2018-2027F)
10.2.1.1.1. Therapeutic Devices, 2018-2027F (USD Million)
10.2.1.1.1.1. Insulin Device, 2018-2027F (USD Million)
10.2.1.1.1.2. Pain Management Devices, 2018-2027F (USD Million)
10.2.1.1.1.3. Rehabilitation Device, 2018-2027F (USD Million)
10.2.1.1.1.3.1. Virtual Reality (VR) /Augmented Reality (AR), 2018-2027F (USD Million)
10.2.1.1.1.3.2. Functional Electrical Stimulation (FES), 2018-2027F (USD Million)
10.2.1.1.1.4. Respiratory Therapy Devices, 2018-2027F (USD Million)
10.2.1.1.2. Diagnostic & Monitoring Devices, 2018-2027F (USD Million)
10.2.1.1.2.1. Vital Sign Monitoring Devices, 2018-2027F (USD Million)
10.2.1.1.2.1.1. Activity Monitors, 2018-2027F (USD Million)
10.2.1.1.2.1.2. Temperature Monitors, 2018-2027F (USD Million)
10.2.1.1.2.1.3. Electrocardiographs, 2018-2027F (USD Million)
10.2.1.1.2.1.4. Pulse Oximeters, 2018-2027F (USD Million)
10.2.1.1.2.1.5. Spirometer, 2018-2027F (USD Million)
10.2.1.1.2.1.6. Blood Pressure Monitors, 2018-2027F (USD Million)
10.2.1.1.2.1.7. Others, 2018-2027F (USD Million)
10.2.1.1.2.2. Sleep Monitoring Devices, 2018-2027F (USD Million)
10.2.1.1.2.2.1. Sleep Trackers, 2018-2027F (USD Million)
10.2.1.1.2.2.2. Wrist Actigraphs, 2018-2027F (USD Million)
10.2.1.1.2.2.3. Others, 2018-2027F (USD Million)
10.2.1.1.2.3. Neuromonitoring Devices, 2018-2027F (USD Million)
10.2.1.1.2.4. Fetal Monitoring & Obstetric Devices, 2018-2027F (USD Million)
10.2.2. By Device
10.2.2.1. Wearable Medical Devices Market Share (%), By Device (2018-2027F)
10.2.2.1.1. Wristband, 2018-2027F (USD Million)
10.2.2.1.2. Earwear, 2018-2027F (USD Million)
10.2.2.1.3. Clothing, 2018-2027F (USD Million)
10.2.2.1.4. Patch, 2018-2027F (USD Million)
10.2.2.1.4.1. Single-use, 2018-2027F (USD Million)
10.2.2.1.4.2. Reusable, 2018-2027F (USD Million)
10.2.2.1.5. Others, 2018-2027F (USD Million)
10.2.3. By Application
10.2.3.1. Wearable Medical Devices Market Share (%), By Application (2018-2027F)
10.2.3.1.1. Home Healthcare, 2018-2027F (USD Million)
10.2.3.1.2. Remote Patient Monitoring, 2018-2027F (USD Million)
10.2.3.1.3. Sports & Fitness, 2018-2027F (USD Million)
10.2.4. By Distribution Channel
10.2.4.1. Wearable Medical Devices Market Share (%), By Distribution Channel (2018-2027F)
10.2.4.1.1. Online Channel, 2018-2027F (USD Million)
10.2.4.1.2. Offline Channel, 2018-2027F (USD Million)
10.2.5. By Region
10.2.5.1. Wearable Medical Devices Market Share (%), By Region (2018,2027F)
10.2.5.1.1. North America
10.2.5.1.2. Europe
10.2.5.1.3. Asia Pacific
10.2.5.1.4. Latin America
10.2.5.1.5. Middle East and Africa
11.North America Wearable Medical Devices Market Outlook
11.1.Macro-Economic Indicators impacting the North America Wearable Medical Devices Market
11.2.Market Size and Forecast, 2018-2027F
11.2.1. By Value (USD Million)
11.3.Market Share and Forecast, 2018-2027F
11.3.1. By Product
11.3.1.1. Wearable Medical Devices Market Share (%), By Product (2018-2027F)
11.3.1.1.1. Therapeutic Devices, 2018-2027F (USD Million)
11.3.1.1.1.1. Insulin Device, 2018-2027F (USD Million)
11.3.1.1.1.2. Pain Management Devices, 2018-2027F (USD Million)
11.3.1.1.1.3. Rehabilitation Device, 2018-2027F (USD Million)
11.3.1.1.1.3.1. Virtual Reality (VR) /Augmented Reality (AR), 2018-2027F (USD Million)
11.3.1.1.1.3.2. Functional Electrical Stimulation (FES), 2018-2027F (USD Million)
11.3.1.1.1.4. Respiratory Therapy Devices, 2018-2027F (USD Million)
11.3.1.1.2. Diagnostic & Monitoring Devices, 2018-2027F (USD Million)
11.3.1.1.2.1. Vital Sign Monitoring Devices, 2018-2027F (USD Million)
11.3.1.1.2.1.1. Activity Monitors, 2018-2027F (USD Million)
11.3.1.1.2.1.2. Temperature Monitors, 2018-2027F (USD Million)
11.3.1.1.2.1.3. Electrocardiographs, 2018-2027F (USD Million)
11.3.1.1.2.1.4. Pulse Oximeters, 2018-2027F (USD Million)
11.3.1.1.2.1.5. Spirometer, 2018-2027F (USD Million)
11.3.1.1.2.1.6. Blood Pressure Monitors, 2018-2027F (USD Million)
11.3.1.1.2.1.7. Others, 2018-2027F (USD Million)
11.3.1.1.2.2. Sleep Monitoring Devices, 2018-2027F (USD Million)
11.3.1.1.2.2.1. Sleep Trackers, 2018-2027F (USD Million)
11.3.1.1.2.2.2. Wrist Actigraphs, 2018-2027F (USD Million)
11.3.1.1.2.2.3. Others, 2018-2027F (USD Million)
11.3.1.1.2.3. Neuromonitoring Devices, 2018-2027F (USD Million)
11.3.1.1.2.4. Fetal Monitoring & Obstetric Devices, 2018-2027F (USD Million)
11.3.2. By Device
11.3.2.1. Wearable Medical Devices Market Share (%), By Device (2018-2027F)
11.3.2.1.1. Wristband, 2018-2027F (USD Million)
11.3.2.1.2. Earwear, 2018-2027F (USD Million)
11.3.2.1.3. Clothing, 2018-2027F (USD Million)
11.3.2.1.4. Patch, 2018-2027F (USD Million)
11.3.2.1.4.1. Single-use, 2018-2027F (USD Million)
11.3.2.1.4.2. Reusable, 2018-2027F (USD Million)
11.3.2.1.5. Others, 2018-2027F (USD Million)
11.3.3. By Application
11.3.3.1. Wearable Medical Devices Market Share (%), By Application (2018-2027F)
11.3.3.1.1. Home Healthcare, 2018-2027F (USD Million)
11.3.3.1.2. Remote Patient Monitoring, 2018-2027F (USD Million)
11.3.3.1.3. Sports & Fitness, 2018-2027F (USD Million)
11.3.4. By Distribution Channel
11.3.4.1. Wearable Medical Devices Market Share (%), By Distribution Channel (2018-2027F)
11.3.4.1.1. Online Channel, 2018-2027F (USD Million)
11.3.4.1.2. Offline Channel, 2018-2027F (USD Million)
11.3.5. By Country
11.3.5.1. Wearable Medical Devices Market Share (%), By Country (2018,2027F)
11.3.5.1.1. United States, 2018-2027F (USD Million)
11.3.5.1.2. Canada, 2018-2027F (USD Million)
12.Europe Wearable Medical Devices Market Outlook
12.1.Macro-Economic Indicators impacting the Europe Wearable Medical Devices Market
12.2.Market Size and Forecast, 2018-2027F
12.2.1. By Value (USD Million)
12.3.Market Share and Forecast, 2018-2027F
12.3.1. By Product
12.3.1.1. Wearable Medical Devices Market Share (%), By Product (2018-2027F)
12.3.1.1.1. Therapeutic Devices, 2018-2027F (USD Million)
12.3.1.1.1.1. Insulin Device, 2018-2027F (USD Million)
12.3.1.1.1.2. Pain Management Devices, 2018-2027F (USD Million)
12.3.1.1.1.3. Rehabilitation Device, 2018-2027F (USD Million)
12.3.1.1.1.3.1. Virtual Reality (VR) /Augmented Reality (AR), 2018-2027F (USD Million)
12.3.1.1.1.3.2. Functional Electrical Stimulation (FES), 2018-2027F (USD Million)
12.3.1.1.1.4. Respiratory Therapy Devices, 2018-2027F (USD Million)
12.3.1.1.2. Diagnostic & Monitoring Devices, 2018-2027F (USD Million)
12.3.1.1.2.1. Vital Sign Monitoring Devices, 2018-2027F (USD Million)
12.3.1.1.2.1.1. Activity Monitors, 2018-2027F (USD Million)
12.3.1.1.2.1.2. Temperature Monitors, 2018-2027F (USD Million)
12.3.1.1.2.1.3. Electrocardiographs, 2018-2027F (USD Million)
12.3.1.1.2.1.4. Pulse Oximeters, 2018-2027F (USD Million)
12.3.1.1.2.1.5. Spirometer, 2018-2027F (USD Million)
12.3.1.1.2.1.6. Blood Pressure Monitors, 2018-2027F (USD Million)
12.3.1.1.2.1.7. Others, 2018-2027F (USD Million)
12.3.1.1.2.2. Sleep Monitoring Devices, 2018-2027F (USD Million)
12.3.1.1.2.2.1. Sleep Trackers, 2018-2027F (USD Million)
12.3.1.1.2.2.2. Wrist Actigraphs, 2018-2027F (USD Million)
12.3.1.1.2.2.3. Others, 2018-2027F (USD Million)
12.3.1.1.2.3. Neuromonitoring Devices, 2018-2027F (USD Million)
12.3.1.1.2.4. Fetal Monitoring & Obstetric Devices, 2018-2027F (USD Million)
12.3.2. By Device
12.3.2.1. Wearable Medical Devices Market Share (%), By Device (2018-2027F)
12.3.2.1.1. Wristband, 2018-2027F (USD Million)
12.3.2.1.2. Earwear, 2018-2027F (USD Million)
12.3.2.1.3. Clothing, 2018-2027F (USD Million)
12.3.2.1.4. Patch, 2018-2027F (USD Million)
12.3.2.1.4.1. Single-use, 2018-2027F (USD Million)
12.3.2.1.4.2. Reusable, 2018-2027F (USD Million)
12.3.2.1.5. Others, 2018-2027F (USD Million)
12.3.3. By Application
12.3.3.1. Wearable Medical Devices Market Share (%), By Application (2018-2027F)
12.3.3.1.1. Home Healthcare, 2018-2027F (USD Million)
12.3.3.1.2. Remote Patient Monitoring, 2018-2027F (USD Million)
12.3.3.1.3. Sports & Fitness, 2018-2027F (USD Million)
12.3.4. By Distribution Channel
12.3.4.1. Wearable Medical Devices Market Share (%), By Distribution Channel (2018-2027F)
12.3.4.1.1. Online Channel, 2018-2027F (USD Million)
12.3.4.1.2. Offline Channel, 2018-2027F (USD Million)
12.3.5. By Country
12.3.5.1. Wearable Medical Devices Market Share (%), By Country (2018,2027F)
12.3.5.1.1. UK, 2018-2027F (USD Million)
12.3.5.1.2. Germany, 2018-2027F (USD Million)
12.3.5.1.3. Italy, 2018-2027F (USD Million)
12.3.5.1.4. France, 2018-2027F (USD Million)
12.3.5.1.5. Spain, 2018-2027F (USD Million)
12.3.5.1.6. Turkey, 2018-2027F (USD Million)
12.3.5.1.7. Russia, 2018-2027F (USD Million)
12.3.5.1.8. Rest of Europe, 2018-2027F (USD Million)
13.Asia Pacific Wearable Medical Devices Market Outlook
13.1.Macro-Economic Indicators impacting the Asia Pacific Wearable Medical Devices Market
13.2.Market Size and Forecast, 2018-2027F
13.2.1. By Value (USD Million)
13.3.Market Share and Forecast, 2018-2027F
13.3.1. By Product
13.3.1.1. Wearable Medical Devices Market Share (%), By Product (2018-2027F)
13.3.1.1.1. Therapeutic Devices, 2018-2027F (USD Million)
13.3.1.1.1.1. Insulin Device, 2018-2027F (USD Million)
13.3.1.1.1.2. Pain Management Devices, 2018-2027F (USD Million)
13.3.1.1.1.3. Rehabilitation Device, 2018-2027F (USD Million)
13.3.1.1.1.3.1. Virtual Reality (VR) /Augmented Reality (AR), 2018-2027F (USD Million)
13.3.1.1.1.3.2. Functional Electrical Stimulation (FES), 2018-2027F (USD Million)
13.3.1.1.1.4. Respiratory Therapy Devices, 2018-2027F (USD Million)
13.3.1.1.2. Diagnostic & Monitoring Devices, 2018-2027F (USD Million)
13.3.1.1.2.1. Vital Sign Monitoring Devices, 2018-2027F (USD Million)
13.3.1.1.2.1.1. Activity Monitors, 2018-2027F (USD Million)
13.3.1.1.2.1.2. Temperature Monitors, 2018-2027F (USD Million)
13.3.1.1.2.1.3. Electrocardiographs, 2018-2027F (USD Million)
13.3.1.1.2.1.4. Pulse Oximeters, 2018-2027F (USD Million)
13.3.1.1.2.1.5. Spirometer, 2018-2027F (USD Million)
13.3.1.1.2.1.6. Blood Pressure Monitors, 2018-2027F (USD Million)
13.3.1.1.2.1.7. Others, 2018-2027F (USD Million)
13.3.1.1.2.2. Sleep Monitoring Devices, 2018-2027F (USD Million)
13.3.1.1.2.2.1. Sleep Trackers, 2018-2027F (USD Million)
13.3.1.1.2.2.2. Wrist Actigraphs, 2018-2027F (USD Million)
13.3.1.1.2.2.3. Others, 2018-2027F (USD Million)
13.3.1.1.2.3. Neuromonitoring Devices, 2018-2027F (USD Million)
13.3.1.1.2.4. Fetal Monitoring & Obstetric Devices, 2018-2027F (USD Million)
13.3.2. By Device
13.3.2.1. Wearable Medical Devices Market Share (%), By Device (2018-2027F)
13.3.2.1.1. Wristband, 2018-2027F (USD Million)
13.3.2.1.2. Earwear, 2018-2027F (USD Million)
13.3.2.1.3. Clothing, 2018-2027F (USD Million)
13.3.2.1.4. Patch, 2018-2027F (USD Million)
13.3.2.1.4.1. Single-use, 2018-2027F (USD Million)
13.3.2.1.4.2. Reusable, 2018-2027F (USD Million)
13.3.2.1.5. Others, 2018-2027F (USD Million)
13.3.3. By Application
13.3.3.1. Wearable Medical Devices Market Share (%), By Application (2018-2027F)
13.3.3.1.1. Home Healthcare, 2018-2027F (USD Million)
13.3.3.1.2. Remote Patient Monitoring, 2018-2027F (USD Million)
13.3.3.1.3. Sports & Fitness, 2018-2027F (USD Million)
13.3.4. By Distribution Channel
13.3.4.1. Wearable Medical Devices Market Share (%), By Distribution Channel (2018-2027F)
13.3.4.1.1. Online Channel, 2018-2027F (USD Million)
13.3.4.1.2. Offline Channel, 2018-2027F (USD Million)
13.3.5. By Country
13.3.5.1. Wearable Medical Devices Market Share (%), By Country (2018,2027F)
13.3.5.1.1. China, 2018-2027F (USD Million)
13.3.5.1.1.1. By Product
13.3.5.1.1.1.1. Wearable Medical Devices Market Share (%), By Product (2018-2027F)
13.3.5.1.1.1.1.1. Therapeutic Devices, 2018-2027F (USD Million)
13.3.5.1.1.1.1.1.1.Insulin Device, 2018-2027F (USD Million)
13.3.5.1.1.1.1.1.2.Pain Management Devices, 2018-2027F (USD Million)
13.3.5.1.1.1.1.1.3.Rehabilitation Device, 2018-2027F (USD Million)
· Virtual Reality (VR) /Augmented Reality (AR), 2018-2027F (USD Million)
· Functional Electrical Stimulation (FES), 2018-2027F (USD Million)
13.3.5.1.1.1.1.1.4.Respiratory Therapy Devices, 2018-2027F (USD Million)
13.3.5.1.1.1.1.2. Diagnostic & Monitoring Devices, 2018-2027F (USD Million)
13.3.5.1.1.1.1.2.1.Vital Sign Monitoring Devices, 2018-2027F (USD Million)
· Activity Monitors, 2018-2027F (USD Million)
· Temperature Monitors, 2018-2027F (USD Million)
· Electrocardiographs, 2018-2027F (USD Million)
· Pulse Oximeters, 2018-2027F (USD Million)
· Spirometer, 2018-2027F (USD Million)
· Blood Pressure Monitors, 2018-2027F (USD Million)
· Others, 2018-2027F (USD Million)
13.3.5.1.1.1.1.2.2.Sleep Monitoring Devices, 2018-2027F (USD Million)
· Sleep Trackers, 2018-2027F (USD Million)
· Wrist Actigraphs, 2018-2027F (USD Million)
· Others, 2018-2027F (USD Million)
13.3.5.1.1.1.1.2.3.Neuromonitoring Devices, 2018-2027F (USD Million)
13.3.5.1.1.1.1.2.4.Fetal Monitoring & Obstetric Devices, 2018-2027F (USD Million)
13.3.5.1.1.2. By Device
13.3.5.1.1.2.1. Wearable Medical Devices Market Share (%), By Device (2018-2027F)
13.3.5.1.1.2.1.1. Wristband, 2018-2027F (USD Million)
13.3.5.1.1.2.1.2. Earwear, 2018-2027F (USD Million)
13.3.5.1.1.2.1.3. Clothing, 2018-2027F (USD Million)
13.3.5.1.1.2.1.4. Patch, 2018-2027F (USD Million)
13.3.5.1.1.2.1.4.1.Single-use, 2018-2027F (USD Million)
13.3.5.1.1.2.1.4.2.Reusable, 2018-2027F (USD Million)
13.3.5.1.1.2.1.5. Others, 2018-2027F (USD Million)
13.3.5.1.1.3. By Application
13.3.5.1.1.3.1. Wearable Medical Devices Market Share (%), By Application (2018-2027F)
13.3.5.1.1.3.1.1. Home Healthcare, 2018-2027F (USD Million)
13.3.5.1.1.3.1.2. Remote Patient Monitoring, 2018-2027F (USD Million)
13.3.5.1.1.3.1.3. Sports & Fitness, 2018-2027F (USD Million)
13.3.5.1.1.4.By Distribution Channel
13.3.5.1.1.4.1. Wearable Medical Devices Market Share (%), By Distribution Channel (2018-2027F)
13.3.5.1.1.4.1.1. Online Channel, 2018-2027F (USD Million)
13.3.5.1.1.4.1.2. Offline Channel, 2018-2027F (USD Million)
13.3.5.1.2.India, 2018-2027F (USD Million)
13.3.5.1.2.1.By Product
13.3.5.1.2.1.1. Wearable Medical Devices Market Share (%), By Product (2018-2027F)
13.3.5.1.2.1.1.1. Therapeutic Devices, 2018-2027F (USD Million)
13.3.5.1.2.1.1.1.1.Insulin Device, 2018-2027F (USD Million)
13.3.5.1.2.1.1.1.2.Pain Management Devices, 2018-2027F (USD Million)
13.3.5.1.2.1.1.1.3.Rehabilitation Device, 2018-2027F (USD Million)
·Virtual Reality (VR) /Augmented Reality (AR), 2018-2027F (USD Million)
·Functional Electrical Stimulation (FES), 2018-2027F (USD Million)
13.3.5.1.2.1.1.1.4.Respiratory Therapy Devices, 2018-2027F (USD Million)
13.3.5.1.2.1.1.2. Diagnostic & MonitoringDevices, 2018-2027F (USD Million)
13.3.5.1.2.1.1.2.1.Vital Sign Monitoring Devices, 2018-2027F (USD Million)
·Activity Monitors, 2018-2027F (USD Million)
· Temperature Monitors, 2018-2027F (USD Million)
· Electrocardiographs, 2018-2027F (USD Million)
· Pulse Oximeters, 2018-2027F (USD Million)
· Spirometer, 2018-2027F (USD Million)
· Blood Pressure Monitors, 2018-2027F (USD Million)
· Others, 2018-2027F (USD Million)
13.3.5.1.2.1.1.2.2.Sleep Monitoring Devices, 2018-2027F (USD Million)
· Sleep Trackers, 2018-2027F (USD Million)
· Wrist Actigraphs, 2018-2027F (USD Million)
· Others, 2018-2027F (USD Million)
13.3.5.1.2.1.1.2.3.Neuromonitoring Devices, 2018-2027F (USD Million)
13.3.5.1.2.1.1.2.4.Fetal Monitoring & Obstetric Devices, 2018-2027F (USD Million)
13.3.5.1.2.2. By Device
13.3.5.1.2.2.1. Wearable Medical Devices Market Share (%), By Device (2018-2027F)
13.3.5.1.2.2.1.1. Wristband, 2018-2027F (USD Million)
13.3.5.1.2.2.1.2. Earwear, 2018-2027F (USD Million)
13.3.5.1.2.2.1.3. Clothing, 2018-2027F (USD Million)
13.3.5.1.2.2.1.4. Patch, 2018-2027F (USD Million)
13.3.5.1.2.2.1.4.1.Single-use, 2018-2027F (USD Million)
13.3.5.1.2.2.1.4.2.Reusable, 2018-2027F (USD Million)
13.3.5.1.2.2.1.5. Others, 2018-2027F (USD Million)
13.3.5.1.2.3. By Application
13.3.5.1.2.3.1. Wearable Medical Devices Market Share (%), By Application (2018-2027F)
13.3.5.1.2.3.1.1. Home Healthcare, 2018-2027F (USD Million)
13.3.5.1.2.3.1.2. Remote Patient Monitoring, 2018-2027F (USD Million)
13.3.5.1.2.3.1.3. Sports & Fitness, 2018-2027F (USD Million)
13.3.5.1.2.4. By Distribution Channel
13.3.5.1.2.4.1. Wearable Medical Devices Market Share (%), By Distribution Channel (2018-2027F)
13.3.5.1.2.4.1.1. Online Channel, 2018-2027F (USD Million)
13.3.5.1.2.4.1.2. Offline Channel, 2018-2027F (USD Million)
13.3.5.1.3. Japan, 2018-2027F (USD Million)
13.3.5.1.4. South Korea, 2018-2027F (USD Million)
13.3.5.1.5. Indonesia, 2018-2027F (USD Million)
13.3.5.1.6. Australia, 2018-2027F (USD Million)
13.3.5.1.7. Rest of Asia Pacific, 2018-2027F (USD Million)
14.Latin America Wearable Medical Devices Market Outlook
14.1.Macro-Economic Indicators impacting the Latin America Wearable Medical Devices Market
14.2.Market Size and Forecast, 2018-2027F
14.2.1. By Value (USD Million)
14.3.Market Share and Forecast, 2018-2027F
14.3.1. By Product
14.3.1.1. Wearable Medical Devices Market Share (%), By Product (2018-2027F)
14.3.1.1.1. Therapeutic Devices, 2018-2027F (USD Million)
14.3.1.1.1.1. Insulin Device, 2018-2027F (USD Million)
14.3.1.1.1.2. Pain Management Devices, 2018-2027F (USD Million)
14.3.1.1.1.3. Rehabilitation Device, 2018-2027F (USD Million)
14.3.1.1.1.3.1. Virtual Reality (VR) /Augmented Reality (AR), 2018-2027F (USD Million)
14.3.1.1.1.3.2. Functional Electrical Stimulation (FES), 2018-2027F (USD Million)
14.3.1.1.1.4. Respiratory Therapy Devices, 2018-2027F (USD Million)
14.3.1.1.2. Diagnostic & Monitoring Devices, 2018-2027F (USD Million)
14.3.1.1.2.1. Vital Sign Monitoring Devices, 2018-2027F (USD Million)
14.3.1.1.2.1.1. Activity Monitors, 2018-2027F (USD Million)
14.3.1.1.2.1.2. Temperature Monitors, 2018-2027F (USD Million)
14.3.1.1.2.1.3. Electrocardiographs, 2018-2027F (USD Million)
14.3.1.1.2.1.4. Pulse Oximeters, 2018-2027F (USD Million)
14.3.1.1.2.1.5. Spirometer, 2018-2027F (USD Million)
14.3.1.1.2.1.6. Blood Pressure Monitors, 2018-2027F (USD Million)
14.3.1.1.2.1.7. Others, 2018-2027F (USD Million)
14.3.1.1.2.2. Sleep Monitoring Devices, 2018-2027F (USD Million)
14.3.1.1.2.2.1. Sleep Trackers, 2018-2027F (USD Million)
14.3.1.1.2.2.2. Wrist Actigraphs, 2018-2027F (USD Million)
14.3.1.1.2.2.3. Others, 2018-2027F (USD Million)
14.3.1.1.2.3. Neuromonitoring Devices, 2018-2027F (USD Million)
14.3.1.1.2.4. Fetal Monitoring & Obstetric Devices, 2018-2027F (USD Million)
14.3.2. By Device
14.3.2.1. Wearable Medical Devices Market Share (%), By Device (2018-2027F)
14.3.2.1.1. Wristband, 2018-2027F (USD Million)
14.3.2.1.2. Earwear, 2018-2027F (USD Million)
14.3.2.1.3. Clothing, 2018-2027F (USD Million)
14.3.2.1.4. Patch, 2018-2027F (USD Million)
14.3.2.1.4.1. Single-use, 2018-2027F (USD Million)
14.3.2.1.4.2. Reusable, 2018-2027F (USD Million)
14.3.2.1.5. Others, 2018-2027F (USD Million)
14.3.3. By Application
14.3.3.1. Wearable Medical Devices Market Share (%), By Application (2018-2027F)
14.3.3.1.1. Home Healthcare, 2018-2027F (USD Million)
14.3.3.1.2. Remote Patient Monitoring, 2018-2027F (USD Million)
14.3.3.1.3. Sports & Fitness, 2018-2027F (USD Million)
14.3.4. By Distribution Channel
14.3.4.1. Wearable Medical Devices Market Share (%), By Distribution Channel (2018-2027F)
14.3.4.1.1. Online Channel, 2018-2027F (USD Million)
14.3.4.1.2. Offline Channel, 2018-2027F (USD Million)
14.3.5. By Country
14.3.5.1. Wearable Medical Devices Market Share (%), By Country (2018,2027F)
14.3.5.1.1. Brazil, 2018-2027F (USD Million)
14.3.5.1.2. Mexico, 2018-2027F (USD Million)
14.3.5.1.3. Rest of Latin America, 2018-2027F (USD Million)
15.Middle East and Africa Wearable Medical Devices Market Outlook
15.1.Macro-Economic Indicators impacting the Middle East and Africa Wearable Medical Devices Market
15.2.Market Size and Forecast, 2018-2027F
15.2.1. By Value (USD Million)
15.3.Market Share and Forecast, 2018-2027F
15.3.1. By Product
15.3.1.1. Wearable Medical Devices Market Share (%), By Product (2018-2027F)
15.3.1.1.1. Therapeutic Devices, 2018-2027F (USD Million)
15.3.1.1.1.1. Insulin Device, 2018-2027F (USD Million)
15.3.1.1.1.2. Pain Management Devices, 2018-2027F (USD Million)
15.3.1.1.1.3. Rehabilitation Device, 2018-2027F (USD Million)
15.3.1.1.1.3.1. Virtual Reality (VR) /Augmented Reality (AR), 2018-2027F (USD Million)
15.3.1.1.1.3.2. Functional Electrical Stimulation (FES), 2018-2027F (USD Million)
15.3.1.1.1.4. Respiratory Therapy Devices, 2018-2027F (USD Million)
15.3.1.1.2. Diagnostic & Monitoring Devices, 2018-2027F (USD Million)
15.3.1.1.2.1. Vital Sign Monitoring Devices, 2018-2027F (USD Million)
15.3.1.1.2.1.1. Activity Monitors, 2018-2027F (USD Million)
15.3.1.1.2.1.2. Temperature Monitors, 2018-2027F (USD Million)
15.3.1.1.2.1.3. Electrocardiographs, 2018-2027F (USD Million)
15.3.1.1.2.1.4. Pulse Oximeters, 2018-2027F (USD Million)
15.3.1.1.2.1.5. Spirometer, 2018-2027F (USD Million)
15.3.1.1.2.1.6. Blood Pressure Monitors, 2018-2027F (USD Million)
15.3.1.1.2.1.7. Others, 2018-2027F (USD Million)
15.3.1.1.2.2. Sleep Monitoring Devices, 2018-2027F (USD Million)
15.3.1.1.2.2.1. Sleep Trackers, 2018-2027F (USD Million)
15.3.1.1.2.2.2. Wrist Actigraphs, 2018-2027F (USD Million)
15.3.1.1.2.2.3. Others, 2018-2027F (USD Million)
15.3.1.1.2.3. Neuromonitoring Devices, 2018-2027F (USD Million)
15.3.1.1.2.4. Fetal Monitoring & Obstetric Devices, 2018-2027F (USD Million)
15.3.2. By Device
15.3.2.1. Wearable Medical Devices Market Share (%), By Device (2018-2027F)
15.3.2.1.1. Wristband, 2018-2027F (USD Million)
15.3.2.1.2. Earwear, 2018-2027F (USD Million)
15.3.2.1.3. Clothing, 2018-2027F (USD Million)
15.3.2.1.4. Patch, 2018-2027F (USD Million)
15.3.2.1.4.1. Single-use, 2018-2027F (USD Million)
15.3.2.1.4.2. Reusable, 2018-2027F (USD Million)
15.3.2.1.5. Others, 2018-2027F (USD Million)
15.3.3. By Application
15.3.3.1. Wearable Medical Devices Market Share (%), By Application (2018-2027F)
15.3.3.1.1. Home Healthcare, 2018-2027F (USD Million)
15.3.3.1.2. Remote Patient Monitoring, 2018-2027F (USD Million)
15.3.3.1.3. Sports & Fitness, 2018-2027F (USD Million)
15.3.4. By Distribution Channel
15.3.4.1. Wearable Medical Devices Market Share (%), By Distribution Channel (2018-2027F)
15.3.4.1.1. Online Channel, 2018-2027F (USD Million)
15.3.4.1.2. Offline Channel, 2018-2027F (USD Million)
15.3.5. By Country
15.3.5.1. Wearable Medical Devices Market Share (%), By Country (2018,2027F)
15.3.5.1.1. Israel, 2018-2027F (USD Million)
15.3.5.1.2. UAE, 2018-2027F (USD Million)
15.3.5.1.3. Saudi Arabia, 2018-2027F (USD Million)
15.3.5.1.4. South Africa, 2018-2027F (USD Million)
15.3.5.1.5. Rest of Middle East & Africa, 2018-2027F (USD Million)
16.Company Profiles
16.1. Fitbit, Inc.
16.2. Omron Healthcare, Inc
16.3. Apple, Inc.
16.4. Garmin Ltd.
16.5. Koninklijke Philips N.V.
16.6. SAMSUNG
16.7. Motorola Mobility LLC.
16.8. BioTelemetry, Inc.
16.9. Medtronic
16.10. Withings
17. Analyst’s Review
Wearable Medical Devices Market Outlook:
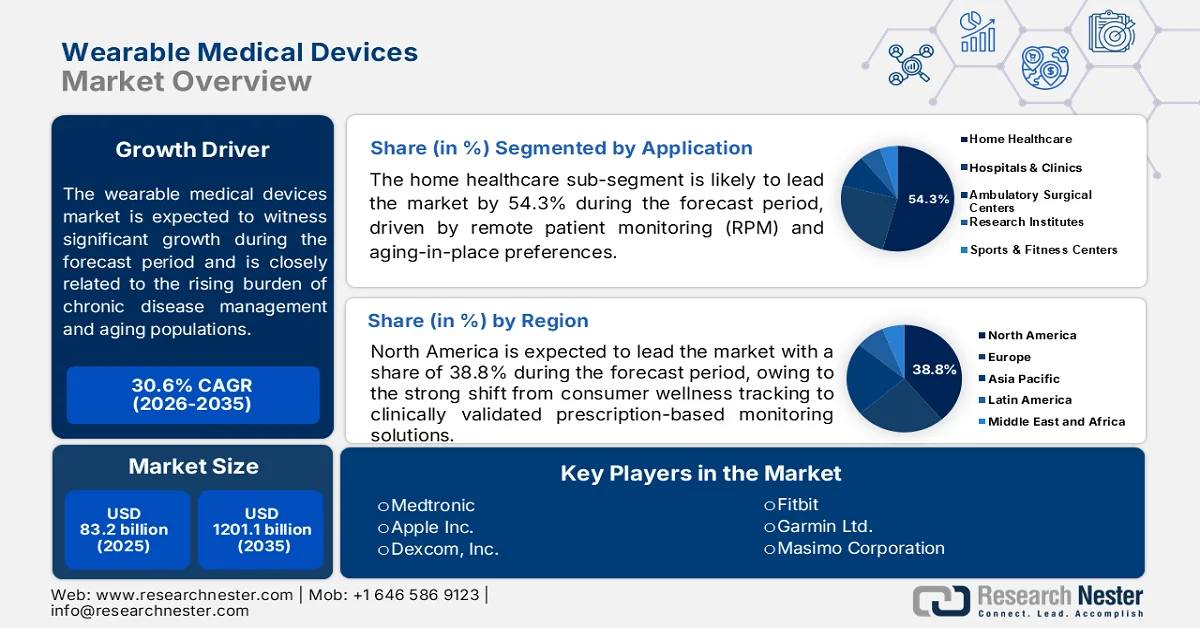
Wearable Medical Devices Market size was valued at USD 83.2 billion in 2025 and is projected to exceed USD 1201.1 billion by the end of 2035, expanding at over 30.6% CAGR during the forecast period i.e., between 2026-2035. In 2026, the industry size of wearable medical devices is assessed at USD 108.6 billion.
Wearable medical devices are seeing sustained demand growth due to the rising burden of chronic disease management, aging populations, and the expansion of remote patient monitoring programs supported by public healthcare systems. According to the World Health Organization (WHO), in November 2023, noncommunicable diseases account for approximately 41 million deaths annually, representing 74% of global deaths, with cardiovascular diseases alone causing nearly 17.9 million deaths each year. This clinical burden is increasing healthcare system interest in continuous patient monitoring outside hospital settings. In the United States, the Centers for Disease Control and Prevention (CDC), as of February 2024, estimated that 129 million Americans are living with at least one major chronic disease, including hypertension, diabetes, or heart disease, creating long-term demand for wearable cardiac monitoring, glucose monitoring, and respiratory tracking solutions.
Moreover, the U.S. Food and Drug Administration has expanded clearances for wearable-enabled digital health systems, including AI-supported cardiac rhythm monitoring and wearable ECG technologies, improving commercialization pathways for manufacturers and hospital procurement networks. Healthcare workforce pressures and hospital capacity optimization are further strengthening institutional adoption of wearable monitoring systems. The WHO October 2025 data projects that the global population aged 60 years and older will increase to 2.1 billion by 2050, increasing the need for long-duration patient surveillance and home-based care delivery. Public health systems are increasingly prioritizing decentralized care models to reduce avoidable hospital admissions and emergency utilization. Further, there is also an increased support for digital health and biosensor research through programs focused on precision medicine, cardiovascular monitoring, and remote care integration. Demand is also being supported by rising adoption of wearable-enabled clinical trials and post-acute monitoring programs, particularly for cardiovascular disease, diabetes, neurological disorders, and sleep-related conditions.
Key Wearable Medical Devices Market Insights Summary:
Regional Highlights:
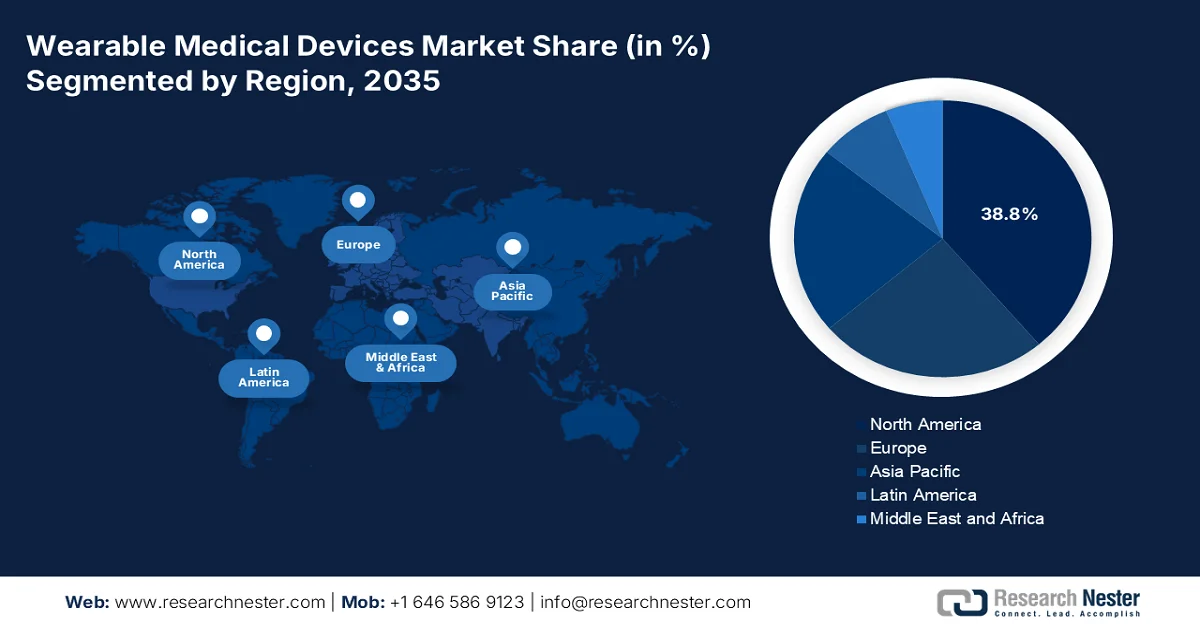
- North America wearable medical devices market is anticipated to secure 38.8% of regional revenue share by 2035, bolstered by the growing adoption of clinically validated prescription-based monitoring solutions integrated with electronic health records and telehealth platforms
- Asia Pacific is set to witness rapid expansion throughout 2026-2035, catalyzed by rapidly aging populations, expanding middle-class healthcare access, and government-led digital health infrastructure initiatives
Segment Insights:
- The home healthcare sub-segment of the wearable medical devices market is projected to account for 54.3% of the market share by 2035, supported by the increasing shift toward remote patient monitoring (RPM) and aging-in-place preferences
- Bluetooth/cloud-connected devices are expected to maintain their leadership position in the connectivity segment through 2035, stimulated by the accelerating expansion of the healthcare Internet of Things (IoT) ecosystem
Key Growth Trends:
- Rising government spending on chronic disease management
- Increasing cardiovascular disease burden
Major Challenges:
- Product reliability and safety risks
- Regulatory classification uncertainty
Key Players: Medtronic (U.S.),Apple Inc. (U.S.),Dexcom, Inc. (U.S.),Fitbit (Google) (U.S.),Garmin Ltd. (U.S.),Masimo Corporation (U.S.),Abbott Laboratories (U.S.),Omron Healthcare (Japan),ROHTO Pharmaceutical Co., Ltd (Japan),Corsano Health (Netherlands),Philips Healthcare (Netherlands),Withings (France),Bosch Healthcare (Germany),Sensium Healthcare (UK),Samsung Electronics (South Korea),ResMed (Australia),Vitalist (U.S.),Saluja Healthcare (India),Agaid Technology (Malaysia),Preventive Solutions (U.S.).
Global Wearable Medical Devices Market Forecast and Regional Outlook:
Market Size & Growth Projections:
- 2025 Market Size: USD 83.2 billion
- 2026 Market Size: USD 108.6 billion
- Projected Market Size: USD 1201.1 billion by 2035
- Growth Forecasts: 30.6% CAGR (2026-2035)
Key Regional Dynamics:
- Largest Region: North America (38.8% Share by 2035)
- Fastest Growing Region: Asia Pacific
- Dominating Countries: United States, Germany, Japan, China, United Kingdom
- Emerging Countries: India, South Korea, Australia, Singapore, Malaysia
Last updated on : 11 June, 2026
Wearable Medical Devices Market - Growth Drivers and Challenges
Growth Drivers
- Rising government spending on chronic disease management: The increasing prevalence of chronic diseases is driving the healthcare authorities to invest in continuous monitoring technologies supported by wearable devices. According to the U.S. Centers for Disease Control and Prevention, in April 2026, data showed that 3 in 4 U.S. people live with at least one chronic disease. Governments are therefore prioritizing early intervention and continuous monitoring to lower the hospitalization costs. Wearable cardiac monitors, glucose sensors, and respiratory trackers are increasingly incorporated into public disease management programs. In the UK, the National Health Service expanded digital health and virtual ward programs to support remote monitoring of high-risk patients. These investments are increasing procurement opportunities for wearable device manufacturers supplying clinically validated monitoring platforms.
- Increasing cardiovascular disease burden: The high prevalence of cardiovascular disease is driving the demand for the wearable medical device market. According to the WHO July 2025 data, cardiovascular diseases cause approximately 19.8 million deaths annually, representing the leading global cause of mortality. Governments are increasing the funding for the preventive cardiac care and early detection programs to reduce emergency admissions and long-term treatment costs. In the U.S., the CDC October 2024 estimates that one person dies every 34 seconds from cardiovascular disease, increasing pressure on healthcare systems to implement continuous ambulatory monitoring solutions. Wearable cardiac monitors are increasingly used in atrial fibrillation detection, post-operative monitoring, and outpatient cardiac rehabilitation programs. Public health authorities are supporting technologies capable of reducing readmissions and enabling earlier intervention.
- Growth of home healthcare and virtual care programs: Healthcare systems are expanding home healthcare capacity to reduce hospital congestion and optimize resource utilization, increasing reliance on wearable monitoring devices. The hospital-at-home and virtual care models that rely on connected patient monitoring technologies are further driving the market demand. NHS England also expanded virtual ward programs that use wearable-enabled remote monitoring to supervise patients recovering at home. These models reduce inpatient costs while improving patient throughput and chronic disease surveillance. Government healthcare agencies increasingly view wearable monitoring systems as essential infrastructure for decentralized healthcare delivery. Manufacturers capable of integrating wearable platforms with clinical workflows and electronic health record systems are expected to benefit from this transition.
Challenges
- Product reliability and safety risks: Manufacturers face existential threats from the product failures that can lead to severe injuries or deaths. Even established leaders have encountered such issues, demonstrating that the scale does not immunize against quality control challenges. The consequences of inaccurate readings extend beyond reputational damage to potential liability and forced recalls. Manufacturers must therefore invest in redundant fail-safe mechanisms, real-time anomaly detection algorithms, and rigorous post-market surveillance to mitigate these existential risks before they escalate into public health emergencies.
- Regulatory classification uncertainty: The most immediate challenge for market entrants is the ambiguous line between wellness devices and regulated medical devices. The FDA's wellness guidance attempts to clarify that blood pressure measurements via optical sensing remain in the wellness category only if companies make no claims about medical-grade data or insights. However, the guidance leaves gray areas around user interface elements like color-coded alerts, creating significant legal risk for manufacturers.
Wearable Medical Devices Market Size and Forecast:
| Report Attribute | Details |
|---|---|
|
Base Year |
2025 |
|
Forecast Year |
2026-2035 |
|
CAGR |
30.6% |
|
Base Year Market Size (2025) |
USD 83.2 billion |
|
Forecast Year Market Size (2035) |
USD 1201.1 billion |
|
Regional Scope |
|
Wearable Medical Devices Market Segmentation:
Application Segment Analysis
Under the application segment, the home healthcare sub-segment is dominating and is poised to hold the share value of 54.3% by 2035. The dominance is from the shift toward remote patient monitoring (RPM) and aging in place preferences. Wearable devices such as continuous glucose monitors, cardiac patches, and pulse oximeters enable clinical-grade data collection outside hospitals, reducing readmissions and healthcare costs. Furthermore, the integration of artificial intelligence for predictive analytics and the growing acceptance of telehealth consultations are accelerating the adoption of home-based wearable solutions, empowering patients to take proactive ownership of their chronic condition management while reducing the burden on overextended hospital systems.
Connectivity Segment Analysis
The connectivity segment of the wearable medical devices market is dominated by Bluetooth/cloud‑connected devices. This leadership is fueled by the broader Internet of Things (IoT) expansion in healthcare. According to the NLM October 2022 study, the global healthcare IoT device market grew from USD 20 billion to USD 70 billion in 2025, reflecting a 250% increase over the decade. Critically, 30.3% of all IoT devices in use are now deployed in the health sector, spanning remote patient monitors, continuous glucose sensors, and cardiac patches. These Bluetooth‑enabled wearables transmit real‑time data to cloud platforms, enabling clinicians to intervene proactively. The combination of low‑energy wireless protocols and secure cloud storage reduces hospital readmissions and supports chronic disease management. As IoT infrastructure matures, the reliance on Bluetooth/Cloud connectivity will only intensify, cementing its position as the largest sub‑segment in the market.
Distribution Channel Segment Analysis
The distribution channel segment of the wearable medical devices market is increasingly dominated by the direct‑to‑consumer sub-segment. This shift is driven by the explosive global adoption of wearables. As per the NLM June 2025 study, worldwide shipments of wearables, including smartwatches, fitness trackers, and hearables, surpassed 543 million units, a 6.1% increase from the previous year. As hundreds of millions of consumers purchase these devices directly from brand websites or e‑commerce platforms, traditional pharmacy and clinic channels are being bypassed. Manufacturers leverage DTC online models to offer subscription‑based monitoring services alongside hardware. The sheer volume of consumer demand, validated by these shipments and user forecasts, cements online direct sales as the fastest‑growing and largest distribution sub‑segment in the market.
Our in-depth analysis of the wearable medical devices market includes the following segments:
|
Segment |
Subsegments |
|
Device Type |
|
|
Application |
|
|
Technology |
|
|
Connectivity |
|
|
Distribution Channel |
|
|
Pricing Model |
|

Vishnu Nair
Head - Global Business DevelopmentCustomize this report to your requirements — connect with our consultant for personalized insights and options.
Wearable Medical Devices Market - Regional Analysis
North America Market Insights
The North America wearable medical devices market is dominating and is expected to hold the regional revenue share of 38.8% by 2035. The market is characterized by a strong shift from consumer wellness tracking to clinically validated prescription-based monitoring solutions. Manufacturers are focusing on the devices that integrate seamlessly with the electronic health records and telehealth platforms driven by the provider demand for actionable patient-generated data. Regulatory pathways have become more predictable, promoting both the established medical device companies and the consumer technology firms to enter the space. Reimbursement frameworks across the region increasingly favor remote patient monitoring, reducing hospital readmission rates and supporting value-based care models. The aging population and high prevalence of chronic conditions such as diabetes and cardiac arrhythmias continue to sustain demand. Competitive dynamics include partnerships between the device makers and health systems, as well as acquisitions of smaller sensor technology firms by the larger healthcare players.
The increasing chronic disease prevalence and the broader digital healthcare adoption across the provider networks are driving the wearable medical devices market in the U.S. The CDC reported in May 2022 that approximately 11.3% of the U.S. population had diagnosed diabetes, creating a sustained demand for the wearable continuous glucose monitoring systems and the connected biosensors used in long-term disease management. Market expansion is further supported by the healthcare digitization initiatives. According to the Office of the National Coordinator, March 2022 data for the Health Information Technology (ONC), 78% of office-based physicians and 96% of non-federal acute care hospitals exchanged electronic patient health data in 2023, improving the integration of wearable-generated clinical information into the treatment workflows. Additionally, the ACSH May 2026 data indicated that the U.S. Department of Veterans Affairs stated in 2024 that over 2.4 million veterans utilized telehealth services, accelerating the adoption of the remote wearable monitoring platforms.
Estimated Prevalence of Diabetes in the U.S., 2024
|
Characteristic |
Diagnosed diabetes Percentage |
Undiagnosed diabetes Percentage |
Total diabetes Percentage |
|
Men |
12.6 (11.1–14.3) |
2.8 (2.0–3.9) |
15.4 (13.5–17.5) |
|
Women |
10.2 (8.8–11.7) |
3.9 (2.7–5.5) |
14.1 (11.8–16.7) |
Source: CDC May 2024
The expanding federal healthcare investment and rising demand for home-based patient monitoring are driving the wearable medical devices market in Canada. According to the Government of Canada, February 2026 data, the federal government transferred over USD 52.1 billion to provinces and territories through the Canada Health Transfer, supporting modernization of publicly funded healthcare systems and digital care infrastructure. Budget 2025 also reaffirmed USD 8.1 billion in funding for home and community care and long-term care services, strengthening demand for wearable monitoring devices used in chronic disease management and elderly care. The Government of Canada's November 2024 data reported that adults aged 65 and older accounted for 19% of the national population in 2021, increasing the requirements for continuous health monitoring, telehealth integration, and remote patient management technologies across Canada.
APAC Market Insights
Asia Pacific is projected to expand rapidly during the assessed period, 2026 to 2035. The market is driven by rapidly aging populations, expanding middle-class healthcare access, and government-led digital health infrastructure initiatives. Manufacturers are customizing the products for price-sensitive markets through simplified single-function devices such as basic ECG patches and blood pressure monitors alongside premium multi-sensor wearables for the developed economies such as Japan, South Korea, and Australia. Distribution channels vary, with the hospital procurement dominating in India and Indonesia, while direct-to-consumer online sales lead in China and Malaysia. Local manufacturing partnerships are growing as multinational firms seek cost advantages and regulatory navigation support. Interoperability with national health ID systems is becoming a competitive differentiator, mainly in India’s Ayushman Bharat Digital Mission and Malaysia’s MySejahtera platform. Chronic disease prevalence, especially diabetes and hypertension, remains the primary demand anchor across the region.
The rapid expansion of telemedicine services and increased government healthcare investment is driving the market in India. According to the NLM October 2025 data, India’s eSanjeevani platform, recognized as the world’s largest government-led telemedicine initiative, recorded over 163 million consultations across all 28 states and 8 union territories between 2019 and September 2023, with more than 93% of usage driven through the Ayushman Bharat Health and Wellness Center model. The platform was widely used for chronic disease consultations, mainly diabetes and hypertension, supporting demand for wearable monitoring devices integrated with the remote care systems. Additionally, the IBEF November 2025 data indicates that the Government of India allocated USD 11.5 billion to the healthcare sector in the Union Budget, reflecting a 9.78% increase and strengthening the digital healthcare infrastructure development.
The Japan wearable medical devices market is expanding and is poised to grow at a CAGR of 34.5% during the forecast period. The nation is driven by rapid population aging, rising digital healthcare adoption, and increasing government support for remote care technologies. According to the World Economic Forum's September 2025 report, individuals aged 65 years and older accounted for nearly 29.3% of the total population, creating strong demand for wearable monitoring devices used in elderly care and chronic disease management. The Ministry of Health, Labour and Welfare also continued promoting digital transformation in healthcare through telemedicine and home care initiatives to address workforce shortages and rising healthcare expenditures. In addition to investments in connected monitoring systems, digital diagnostics, and long-term patient management technologies across hospitals and home healthcare settings.
Europe Market Insights
Fragmented regulatory landscapes with manufacturers navigating both the EU Medical Device Regulation (MDR) and country-specific reimbursement frameworks are shaping the wearable medical devices market in Europe. Suppliers are increasingly developing devices that meet Class IIa or IIb MDR requirements while simultaneously pursuing national digital health application (DiGA) listings in Germany, France, and Italy, which enable prescription-based reimbursement. Distribution relies heavily on public health system tenders and partnerships with national insurance funds, particularly for cardiac monitoring and continuous glucose sensors. The market sees strong demand for interoperable devices that integrate with national electronic health record systems, a requirement increasingly enforced by government procurement contracts. Aging populations and the prevalence of chronic conditions such as heart failure and diabetes drive sustained adoption.
The increasing elderly care demand and strong investment in digital healthcare infrastructure are driving the wearable medical devices market in Germany. According to the NLM May 2023 data, Germany projects a 22% increase in the population aged 67 and older driving demand for wearable monitoring technologies used in chronic disease management, mobility support, and home healthcare. The ITA August 2025 data indicates that the country’s medical technology sector remains a major global industry, generating USD 63.8 billion in revenue with more than 13,500 manufacturers and over 265,000 employees. Digital healthcare adoption is also accelerating under Germany’s Digital Care Act, which approved 56 reimbursable digital health applications (DiGAs) by 2023, generating nearly USD 86 million in revenue and strengthening the integration of wearable-enabled monitoring within healthcare delivery systems.
The German Medical Equipment Market, 2022-2025
|
in billion USD Estimates = (e) |
2022 |
2023 |
2024 |
2025 estimated |
|
Total Exports |
27.1 |
30.0 |
31.0 |
36.43 |
|
Total Imports |
24.0 |
25.3 (e) |
26.0 |
27.5 (e) |
|
Imports from the U.S. |
5.2 |
5.6 (e) |
6.0 |
6.4 (e) |
|
Trade Surplus/Deficit |
-2.24 |
-0.73 |
-6.0 (e) |
-6.0 (e) |
|
Exchange Rates |
1.053 |
1.0813 |
1.0824 |
1.075 |
Source: ITA August 2025
The increasing NHS digital transformation initiatives, rising chronic disease burden, and expansion of remote patient monitoring programs are driving the market in the UK. According to the NLM August 2022 study, more than 340,000 patients were supported through virtual ward services, increasing demand for wearable monitoring technologies used in home-based care and post-acute recovery management. The UK government also committed a billion for NHS digital transformation and healthcare technology modernization programs, including connected care infrastructure and patient data integration systems. In addition, the Center for Aging Better 2026 data reported that 19% of the UK population was aged 65 years and older, strengthening long-term demand for the wearable cardiac monitoring fall detection system and remote chronic disease management devices across the healthcare sector.
Key Wearable Medical Devices Market Players:
- Medtronic (U.S.)
- Apple Inc. (U.S.)
- Dexcom, Inc. (U.S.)
- Fitbit (Google) (U.S.)
- Garmin Ltd. (U.S.)
- Masimo Corporation (U.S.)
- Abbott Laboratories (U.S.)
- Omron Healthcare (Japan)
- ROHTO Pharmaceutical Co., Ltd (Japan)
- Corsano Health (Netherlands)
- Philips Healthcare (Netherlands)
- Withings (France)
- Bosch Healthcare (Germany)
- Sensium Healthcare (UK)
- Samsung Electronics (South Korea)
- ResMed (Australia)
- Vitalist (U.S.)
- Saluja Healthcare (India)
- Agaid Technology (Malaysia)
- Preventive Solutions (U.S.)
- Company Overview
- Business Strategy
- Key Product Offerings
- Financial Performance
- Key Performance Indicators
- Risk Analysis
- Recent Development
- Regional Presence
- SWOT Analysis
- Medtronic has significantly advanced the market by integrating continuous glucose monitors such as the Guardian Connect system with insulin pump automation, creating hybrid closed-loop solutions for diabetes management. Medtronic’s strategic focus on combining implantable devices with non-invasive wearables enables seamless data transmission to clinicians, improving chronic disease outcomes.
- Apple Inc. has transformed the market by embedding FDA-cleared ECG, blood oxygen monitoring, and irregular rhythm notification features into the Apple Watch. The company’s strategic emphasis on consumer accessibility and continuous software updates has pushed regulatory-grade health monitoring into mainstream adoption.
- Dexcom, Inc. is a specialized leader in the market, focusing exclusively on continuous glucose monitoring (CGM) systems like the G7 series. The company has pioneered real-time glucose data streaming directly to smartphones and smartwatches, eliminating the need for fingerstick calibration. In 2024, the company has made a revenue of USD 4,033 million.
- Fitbit, now part of Google, has redefined the wearable medical devices market by transitioning from activity tracking to chronic disease prevention and detection. Devices like the Fitbit Sense feature ECG, electrodermal activity response for stress management, and skin temperature sensors. Fitbit’s strategic initiatives include the Fitbit Labs research program and large-scale studies, which validated its passive atrial fibrillation detection algorithm.
- Garmin Ltd. has carved a distinct niche in the wearable medical devices market by combining rugged hardware with advanced physiological monitoring for fitness-oriented and clinical populations. Its Elevate optical heart rate technology, Pulse Ox sensors for blood oxygen saturation, and respiration rate tracking are integrated into watches like the Venu and Fenix series. In 2024, the company has made a cash flow of USD 1,239 million.
Here is a list of key players operating in the global wearable medical devices market:
The wearable medical devices market is highly competitive, driven by technological convergence and preventative healthcare trends. Key players from the U.S. and Europe lead in advanced analytics and clinical-grade devices, and on the other hand, Japan and South Korea focus on miniaturization and consumer electronics integration. Strategic initiatives include AI integration for real-time diagnostics, mergers to expand remote patient monitoring portfolios, and partnerships with telehealth platforms. For example, in March 2026, Vitalist announced the acquisition of Somatix to expand its wearable portfolio. Companies are also targeting chronic disease management through non-invasive sensors. Emerging players from India and Malaysia are gaining traction via cost-effective manufacturing and localized solutions.
Corporate Landscape of the Market:
Recent Developments
- In March 2026, ROHTO Pharmaceutical Co., Ltd. entered the China market with the launch of a wearable medical device for managing overactive bladder symptoms. This marks the first step in the global expansion of its medical business. This product uses neuromodulation technology to aid the normalization of bladder function and is a medical device that is attached to the body for use at home.
- In November 2025, Corsano Health, which is a leading MedTech company specializing in medical-grade continuous patient monitoring, announced a strategic partnership with Netcare Limited to launch the wearable monitoring devices for all patients in general wards across the country.
- In May 2025, Medtronic announced the partnership with Corsano Health B.V., which is a MedTech company specializing in high-tech real-time remote patient monitoring solutions. Medtronic will distribute Corsano Health’s advanced solution for hospital and hospital-at-home use, transforming patient care and remote monitoring capabilities across healthcare settings.
- Report ID: 2220
- Published Date: Jun 11, 2026
- Report Format: PDF, PPT
- Explore a preview of key market trends and insights
- Review sample data tables and segment breakdowns
- Experience the quality of our visual data representations
- Evaluate our report structure and research methodology
- Get a glimpse of competitive landscape analysis
- Understand how regional forecasts are presented
- Assess the depth of company profiling and benchmarking
- Preview how actionable insights can support your strategy
Explore real data and analysis
Frequently Asked Questions (FAQ)
Wearable Medical Devices Market Report Scope
Free Sample includes current and historical market size, growth trends, regional charts & tables, company profiles, segment-wise forecasts, and more.
Connect with our Expert


Copyright @ 2026 Research Nester. All Rights Reserved.
