Global Speciality Chemicals Market
- An Outline of the Global Speciality Chemicals Market
- Market Definition and Segmentation
- Study Assumptions and Abbreviations
- Research Methodology & Approach
- Primary Research
- Secondary Research
- Data Triangulation
- SPSS Methodology
- Executive Summary
- Growth Drivers
- Major Roadblocks
- Opportunities
- Prevalent Trends
- Government Regulation
- Growth Outlook
- Competitive White Space Analysis – Identifying Untapped Market Gaps
- Risk Overview
- SWOT
- Technological Advancement
- Technology Maturity Matrix for Speciality Chemical
- Recent News
- Regional Demand
- Global Speciality Chemicals by Geography – Strategic Comparative Analysis
- Strategic Segment Analysis: Speciality Chemicals Demand Landscape
- Global Speciality Chemicals Demand Trends Driven by Maintenance of vehicles, Sustainability and Stringent Regulations (2026-2036)
- Root Cause Analysis (RCA) for discovering problems of the Speciality Chemicals Porter Five Forces
- PESTLE
- Comparative Positioning
- Automotive Aftermarket Fuel Additive– Key Player Analysis (2036)
- Competitive Landscape: Key Suppliers/Players
- Competitive Model: A Detailed Inside View for Investors
- Company Market Share, 2036 (%)
- Business Profile of Key Enterprise
- Albemarle Corporation
- BASF SE
- CHT Germany GmbH
- Clariant
- Croda International Plc
- Evonik
- Huntsman Corporation
- LANXESS
- Nouryon
- StarChem
- SMC Global
- Sterling Specialty Chemicals
- Solvay
- Business Profile of Key Enterprise
- Global Speciality Chemicals Market Outlook
- Market Overview
- Market Revenue by Value (USD Million), Volume (Million Tons), and Compound Annual Growth Rate (CAGR)
- Global Segmentation Speciality Chemicals Analysis (2026-2036)
- By End User Application
- Semiconductor Fabrication, Market Value (USD Million), and CAGR, 2026-2036F
- Photolithography
- Etching
- Others
- Display Manufacturing, Market Value (USD Million), and CAGR, 2026-2036F
- OLED materials
- Semiconductor Fabrication, Market Value (USD Million), and CAGR, 2026-2036F
- By End User Application
- Market Overview
27.2.1.2.2 Speciality Coatings
27.2.1.2.3 Others
- Battery Manufacturing, Market Value (USD Million), and CAGR, 2026-2036F
- Cathode materials
- Anode materials
- Others
- Hydrogen Production & Storage, Market Value (USD Million), and CAGR, 2026-2036F
- Membranes
- Catalyst
- Absorbents
- Telecommunication Infrastucture, Market Value (USD Million), and CAGR, 2026-2036F
- Optical fiber coatings
- High-frequency polymers
- Others
- Advanced Mobility, Market Value (USD Million), and CAGR, 2026-2036F
- EV materials
- Lightweight composites
- Thermal management chemicals
- Others
- Aerospace and Defence, Market Value (USD Million), and CAGR, 2026-2036F
- Adhesives
- Propellants
- Others
- Others Industrial and Chemical Application, Market Value (USD Million), and CAGR, 2026-2036F
- Regional Synopsis, Value (USD Million), 2026-2036
- North America Market Value (USD Million) and CAGR & Y-o-Y Growth Trend, 2026-2036F
- Europe Market Value (USD Million) and CAGR & Y-o-Y Growth Trend, 2026-2036F
- Asia Pacific Market Value (USD Million) and CAGR & Y-o-Y Growth Trend, 2026-2036F
- Latin America Market Value (USD Million) and CAGR & Y-o-Y Growth Trend, 2026-2036F
- Middle East and Africa Market Value (USD Million) and CAGR & Y-o-Y Growth Trend, 2026-2036F
- North America Market
- Overview
- Market Value (USD Million), Current and Future Projections, 2026-2036
- Increment $ Opportunity Assessment, 2026-2036
- Segmentation (USD Million), 2026-2036, By
- By End User Application
- Semiconductor Fabrication, Market Value (USD Million), and CAGR, 2026-2036F
- Photolithography
- Etching
- Others
- Display Manufacturing, Market Value (USD Million), and CAGR, 2026-2036F
- OLED materials
- Semiconductor Fabrication, Market Value (USD Million), and CAGR, 2026-2036F
- By End User Application
- Overview
27.2.1.2.2 Speciality Coatings
27.2.1.2.3 Others
- Battery Manufacturing, Market Value (USD Million), and CAGR, 2026-2036F
- Cathode materials
- Anode materials
- Others
- Hydrogen Production & Storage, Market Value (USD Million), and CAGR, 2026-2036F
- Membranes
- Catalyst
- Absorbents
- Telecommunication Infrastucture, Market Value (USD Million), and CAGR, 2026-2036F
- Optical fiber coatings
- High-frequency polymers
- Others
- Advanced Mobility, Market Value (USD Million), and CAGR, 2026-2036F
- EV materials
- Lightweight composites
- Thermal management chemicals
- Others
- Aerospace and Defence, Market Value (USD Million), and CAGR, 2026-2036F
- Adhesives
- Propellants
- Others
- Others Industrial and Chemical Application, Market Value (USD Million), and CAGR, 2026-2036F
- Country Level Analysis, Value (USD Million)
- U.S. Market Value (USD Million) and CAGR & Y-o-Y Growth Trend, 2026-2036F
- Canada Market Value (USD Million) and CAGR & Y-o-Y Growth Trend, 2026-2036F
- Europe Market
- Overview
- Market Value (USD Million), Current and Future Projections, 2026-2036
- Increment $ Opportunity Assessment, 2026-2036
- Segmentation (USD Million), 2026-2036, By
- By End User Application
- Semiconductor Fabrication, Market Value (USD Million), and CAGR, 2026-2036F
- Photolithography
- Etching
- Others
- Display Manufacturing, Market Value (USD Million), and CAGR, 2026-2036F
- OLED materials
- Semiconductor Fabrication, Market Value (USD Million), and CAGR, 2026-2036F
- By End User Application
- Overview
27.2.1.2.2 Speciality Coatings
27.2.1.2.3 Others
- Battery Manufacturing, Market Value (USD Million), and CAGR, 2026-2036F
- Cathode materials
- Anode materials
- Others
- Hydrogen Production & Storage, Market Value (USD Million), and CAGR, 2026-2036F
- Membranes
- Catalyst
- Absorbents
- Telecommunication Infrastucture, Market Value (USD Million), and CAGR, 2026-2036F
- Optical fiber coatings
- High-frequency polymers
- Others
- Advanced Mobility, Market Value (USD Million), and CAGR, 2026-2036F
- EV materials
- Lightweight composites
- Thermal management chemicals
- Others
- Aerospace and Defence, Market Value (USD Million), and CAGR, 2026-2036F
- Adhesives
- Propellants
- Others
- Others Industrial and Chemical Application, Market Value (USD Million) and CAGR, 2026-2036F
- Country Level Analysis, Value (USD Million)
- UK Market Value (USD Million) and CAGR & Y-o-Y Growth Trend, 2026-2036F
- Germany Market Value (USD Million) and CAGR & Y-o-Y Growth Trend, 2026-2036F
- France Market Value (USD Million) and CAGR & Y-o-Y Growth Trend, 2026-2036F
- Italy Market Value (USD Million) and CAGR & Y-o-Y Growth Trend, 2026-2036F
- Spain Market Value (USD Million) and CAGR & Y-o-Y Growth Trend, 2026-2036F
- Netherlands Market Value (USD Million) and CAGR & Y-o-Y Growth Trend, 2026-2036F
- Russia Market Value (USD Million) and CAGR & Y-o-Y Growth Trend, 2026-2036F
- Switzerland Market Value (USD Million) and CAGR & Y-o-Y Growth Trend, 2026-2036F
- Poland Market Value (USD Million) and CAGR & Y-o-Y Growth Trend, 2026-2036F
- Belgium Market Value (USD Million) and CAGR & Y-o-Y Growth Trend, 2026-2036F
- Rest of Europe Market Value (USD Million) and CAGR & Y-o-Y Growth Trend, 2026-2036F
- Asia Pacific Market
- Overview
- Market Value (USD Million), Current and Future Projections, 2026-2036
- Increment $ Opportunity Assessment, 2026-2036
- Segmentation (USD Million), 2026-2036, By
- By End User Application
- Semiconductor Fabrication, Market Value (USD Million), and CAGR, 2026-2036F
- Photolithography
- Etching
- Others
- Display Manufacturing, Market Value (USD Million), and CAGR, 2026-2036F
- OLED materials
- Semiconductor Fabrication, Market Value (USD Million), and CAGR, 2026-2036F
- By End User Application
- Overview
27.2.1.2.2 Speciality Coatings
27.2.1.2.3 Others
- Battery Manufacturing, Market Value (USD Million), and CAGR, 2026-2036F
- Cathode materials
- Anode materials
- Others
- Hydrogen Production & Storage, Market Value (USD Million), and CAGR, 2026-2036F
- Membranes
- Catalyst
- Absorbents
- Telecommunication Infrastucture, Market Value (USD Million), and CAGR, 2026-2036F
- Optical fiber coatings
- High-frequency polymers
- Others
- Advanced Mobility, Market Value (USD Million), and CAGR, 2026-2036F
- EV materials
- Lightweight composites
- Thermal management chemicals
- Others
- Aerospace and Defence, Market Value (USD Million), and CAGR, 2026-2036F
- Adhesives
- Propellants
- Others
- Others Industrial and Chemical Application, Market Value (USD Million) and CAGR, 2026-2036F
- Country Level Analysis, Value (USD Million)
- China Market Value (USD Million) and CAGR & Y-o-Y Growth Trend, 2026-2036F
- India Market Value (USD Million) and CAGR & Y-o-Y Growth Trend, 2026-2036F
- South Korea Market Value (USD Million) and CAGR & Y-o-Y Growth Trend, 2026-2036F
- Australia Market Value (USD Million) and CAGR & Y-o-Y Growth Trend, 2026-2036F
- Indonesia Market Value (USD Million) and CAGR & Y-o-Y Growth Trend, 2026-2036F
- Malaysia Market Value (USD Million) and CAGR & Y-o-Y Growth Trend, 2026-2036F
- Vietnam Market Value (USD Million) and CAGR & Y-o-Y Growth Trend, 2026-2036F
- Thailand Market Value (USD Million) and CAGR & Y-o-Y Growth Trend, 2026-2036F
- Singapore Market Value (USD Million) and CAGR & Y-o-Y Growth Trend, 2026-2036F
- New Zeeland Market Value (USD Million) and CAGR & Y-o-Y Growth Trend, 2026-2036F
- Rest of Asia Pacific Excluding Japan Market Value (USD Million) and CAGR & Y-o-Y Growth Trend, 2026-2036F
- Latin America Market
- Overview
- Market Value (USD Million), Current and Future Projections, 2026-2036
- Increment $ Opportunity Assessment, 2026-2036
- Year-on-Year Growth Forecast (%)
- Segmentation (USD Million), 2026-2036, By
- By End User Application
- Semiconductor Fabrication, Market Value (USD Million), and CAGR, 2026-2036F
- Photolithography
- Etching
- Others
- Display Manufacturing, Market Value (USD Million), and CAGR, 2026-2036F
- OLED materials
- Semiconductor Fabrication, Market Value (USD Million), and CAGR, 2026-2036F
- By End User Application
- Overview
27.2.1.2.2 Speciality Coatings
27.2.1.2.3 Others
- Battery Manufacturing, Market Value (USD Million), and CAGR, 2026-2036F
- Cathode materials
- Anode materials
- Others
- Hydrogen Production & Storage, Market Value (USD Million), and CAGR, 2026-2036F
- Membranes
- Catalyst
- Absorbents
- Telecommunication Infrastucture, Market Value (USD Million), and CAGR, 2026-2036F
- Optical fiber coatings
- High-frequency polymers
- Others
- Advanced Mobility, Market Value (USD Million), and CAGR, 2026-2036F
- EV materials
- Lightweight composites
- Thermal management chemicals
- Others
- Aerospace and Defence, Market Value (USD Million), and CAGR, 2026-2036F
- Adhesives
- Propellants
- Others
- Others Industrial and Chemical Application, Market Value (USD Million) and CAGR, 2026-2036F
- Country Level Analysis, Value (USD Million)
- Brazil Market Value (USD Million) and CAGR & Y-o-Y Growth Trend, 2026-2036F
- Argentina Market Value (USD Million) and CAGR & Y-o-Y Growth Trend, 2026-2036F
- Mexico Market Value (USD Million) and CAGR & Y-o-Y Growth Trend, 2026-2036F
- Rest of Latin America Market Value (USD Million) and CAGR & Y-o-Y Growth Trend, 2026-2036F
- Middle East & Africa Market
- Overview
- Market Value (USD Million), Current and Future Projections, 2026-2036
- Increment $ Opportunity Assessment, 2026-2036
- Year-on-Year Growth Forecast (%)
- Segmentation (USD Million), 2026-2036, By
- By End User Application
- Semiconductor Fabrication, Market Value (USD Million), and CAGR, 2026-2036F
- Photolithography
- Etching
- Others
- Display Manufacturing, Market Value (USD Million), and CAGR, 2026-2036F
- OLED materials
- Semiconductor Fabrication, Market Value (USD Million), and CAGR, 2026-2036F
- By End User Application
- Overview
27.2.1.2.2 Speciality Coatings
27.2.1.2.3 Others
- Battery Manufacturing, Market Value (USD Million), and CAGR, 2026-2036F
- Cathode materials
- Anode materials
- Others
- Hydrogen Production & Storage, Market Value (USD Million), and CAGR, 2026-2036F
- Membranes
- Catalyst
- Absorbents
- Telecommunication Infrastucture, Market Value (USD Million), and CAGR, 2026-2036F
- Optical fiber coatings
- High-frequency polymers
- Others
- Advanced Mobility, Market Value (USD Million), and CAGR, 2026-2036F
- EV materials
- Lightweight composites
- Thermal management chemicals
- Others
- Aerospace and Defence, Market Value (USD Million), and CAGR, 2026-2036F
- Adhesives
- Propellants
- Others
- Others Industrial and Chemical Application, Market Value (USD Million) and CAGR, 2026-2036F
- Country Level Analysis, Value (USD Million)
- Saudi Arabia Market Value (USD Million) and CAGR & Y-o-Y Growth Trend, 2026-2036F
- UAE Market Value (USD Million) and CAGR & Y-o-Y Growth Trend, 2026-2036F
- Israel Market Value (USD Million) and CAGR & Y-o-Y Growth Trend, 2026-2036F
- Qatar Market Value (USD Million) and CAGR & Y-o-Y Growth Trend, 2026-2036F
- Kuwait Market Value (USD Million) and CAGR & Y-o-Y Growth Trend, 2026-2036F
- Oman Market Value (USD Million) and CAGR & Y-o-Y Growth Trend, 2026-2036F
- South Africa Market Value (USD Million) and CAGR & Y-o-Y Growth Trend, 2026-2036F
- Rest of Middle East & Africa Market Value (USD Million) and CAGR & Y-o-Y Growth Trend, 2026-2036F
- Global Economic Scenario
- World Economic Outlook
- About Research Nester
- Our Global Clientele
- We Serve Clients Across World
Specialty Chemicals Market Outlook:
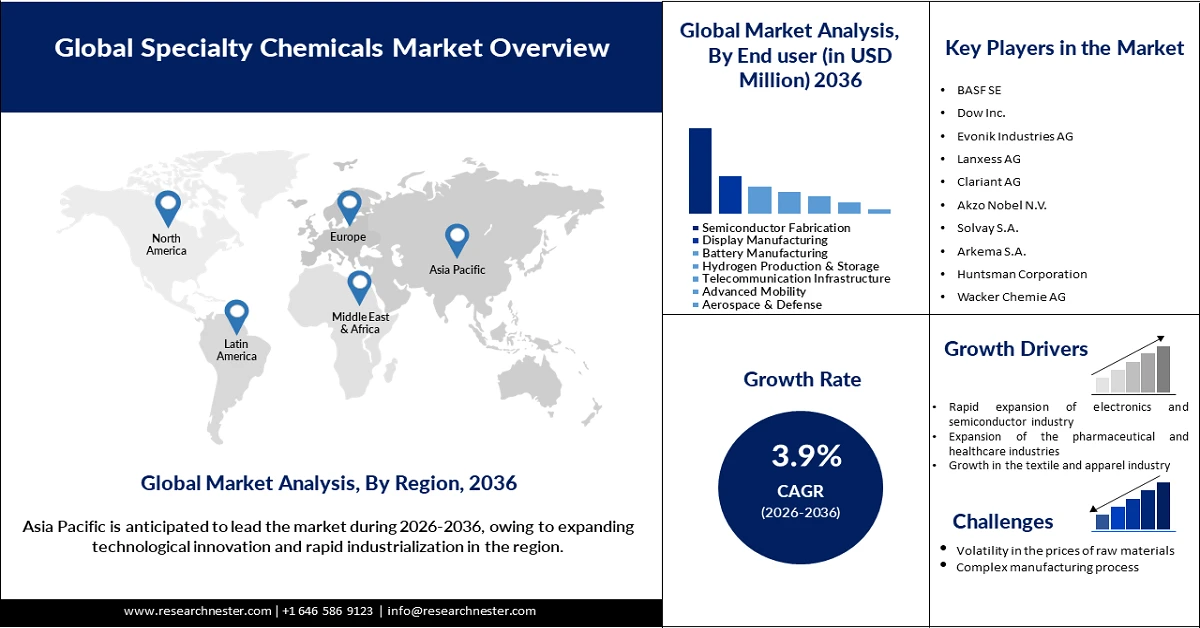
Specialty Chemicals Market size was valued at USD 940.72 billion in 2025 and is projected to reach USD 1.43 trillion by the end of 2036, rising at a CAGR of approximately 3.9% during the forecast period (2026–2036). In 2026, the industry size of the specialty chemicals is estimated at USD 978.79 billion.
The surge in the adoption of specialty chemicals in the construction sector is prominently fostering the market expansion by increasing the operational lifespan of buildings and structures. There has been increased investment in mass-scale infrastructure projects, amalgamated with the increased demand for energy-efficient and high-performance buildings. This has intensified the usage of repair chemicals and modern concrete admixtures during the operations. Furthermore, specialty chemicals are significantly strengthening weight-bearing capacity and resistance to corrosion, making them pivotal for modern infrastructure. According to the World Economic Forum, construction-related spending accounted for approximately 13% of global GDP in 2025, highlighting the sector’s pivotal role in sustaining long-term demand for specialty chemicals worldwide. Furthermore, the U.S. International Trade Commission stated that the chemical imports were USD 420 billion in 2023, representing 13.6% of the import share in the U.S. The high trade for chemicals represents lucrative earning opportunities for specialty chemical manufacturers. This highlights that strategic sourcing and pricing strategies aid in maintaining high profit margins. Overall, the positive foreign direct investments and public spending are estimated to propel the total trade of specialty chemicals during the foreseeable period.
Other than this, the surge in production of automotive products is propelling the growth of the specialty chemicals market. The industry is highly reliant on application-specific and high-performance chemical solutions. Modern vehicles need a myriad of specialty chemicals, such as lubricants, advanced polymers, adhesives, etc., to enhance the durability, aesthetics, and performance. With the rising demand for lightweight materials and high-strength composites, there has been an increased demand for specialty chemicals. Moreover, the transition towards electric vehicles is further increasing the demand for specialty chemicals in thermal fluid management. Subsequently, the expansion of automotive manufacturing volumes and the increasing complexity of vehicle design are fostering the robust growth in the specialty chemicals market.
Global All-Vehicle Sales by Region (Year-to-Date, Q1–Q3, in Units)
|
Units |
YTD 2019 (Q1–Q3) |
YTD 2021 (Q1–Q3) |
YTD 2022 (Q1–Q3) |
YTD 2023 (Q1–Q3) |
YTD 2024 (Q1–Q3) |
YTD 2025 (Q1–Q3) |
|
Developed Countries/Region |
33,012,224 |
25,291,787 |
26,376,009 |
30,112,073 |
28,874,456 |
28,549,120 |
|
Emerging Countries/Regions |
34,235,664 |
31,830,473 |
34,523,711 |
36,939,025 |
37,364,940 |
40,206,004 |
|
Total |
67,247,888 |
57,122,260 |
60,899,720 |
67,051,098 |
66,239,396 |
68,755,124 |
Source: OICA
Further, in 2020, the average U.S. consumer’s expenditure on soaps and detergents was USD 75.53, and the overall shipments distributed were worth USD 90.9 billion, whereas the segment’s value stood at USD 635 billion. U.S. specialty chemicals were estimated at USD 77.2 billion in shipment value by CISA. The coatings, paints, and adhesive specialty chemical production employed 64,423 individuals in the U.S. Moreover, flavors and fragrances held USD 40 billion in yearly sales, whereas 4.5 billion tons of explosives were used in the U.S. Moreover, the government is keen on strengthening the overall supply chain of critical chemicals and initiated two tabletop exercises in 2025. The government’s efforts to build a robust domestic manufacturing scenario have impacted the producer pricing and GDP contribution of chemicals.
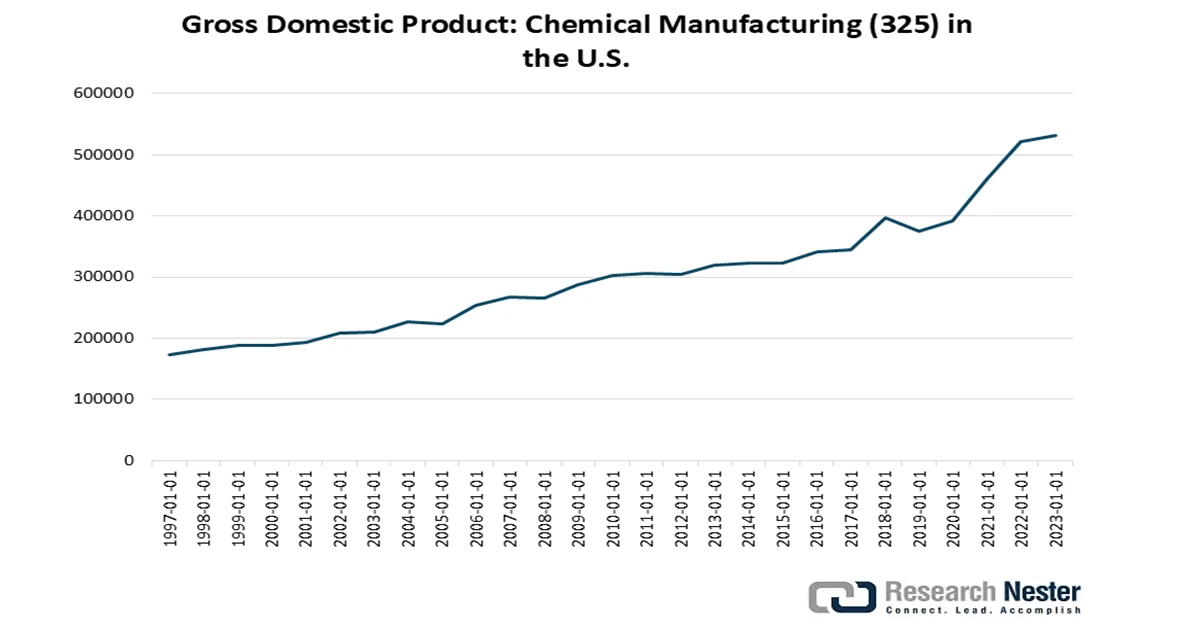
Source: FRED
China is the largest market in terms of chemical sales and accounts for a significant share globally. The U.S. is still strong with companies such as DuPont and Dow Chemical. However, China-based companies are striving to invest heavily in R&D and gain a competitive edge in the fine chemicals segment. The worldwide chemicals sales were USD 4.7 trillion in 2022, says the Information Technology & Innovation Foundation (ITIF). Despite an array of products, the chemicals industry can be categorized into specialty chemicals, basic chemicals, and consumer products.
Global value-added chemical output by the top 10 producers and the rest of world in 2020
|
Producer |
Value-added Chemical Output |
|
China |
USD 334 billion |
|
The U.S. |
USD 210 billion |
|
Japan |
USD 64 billion |
|
Germany |
USD 57 billion |
|
India |
USD 38 billion |
|
France |
USD 26 billion |
|
Saudi Arabia |
USD 24 billion |
|
South Korea |
USD 36 billion |
|
Brazil |
USD 20 billion |
|
Italy |
USD 17 billion |
|
Rest of the World |
USD 320 billion |
Source: ITIF
China witnessed the highest growth between 1995 and 2020 (up by 25.3%) and accounts for roughly 55% of the total acetic acid capacity, carbon black about 50% capacity, and 45% of titanium dioxide. For many commodity chemicals, China began as a net importer, then transitioned to a leading exporter by building up its in-house capacity. The country’s R&D (by both (by domestic and foreign players) grew from 22% to 34% between 2012 and 2022. During the same period, a comparative analysis by ITIF shows that China’s R&D rose from 8% higher than the U.S. to 72%. Additionally, U.S. firm patents share granted in chemistry under the U.S. Patent Office (USPTO) declined to 45% in 2022 from 54% in 2000, whereas China’s patents rate surged by 7% over this timeline.
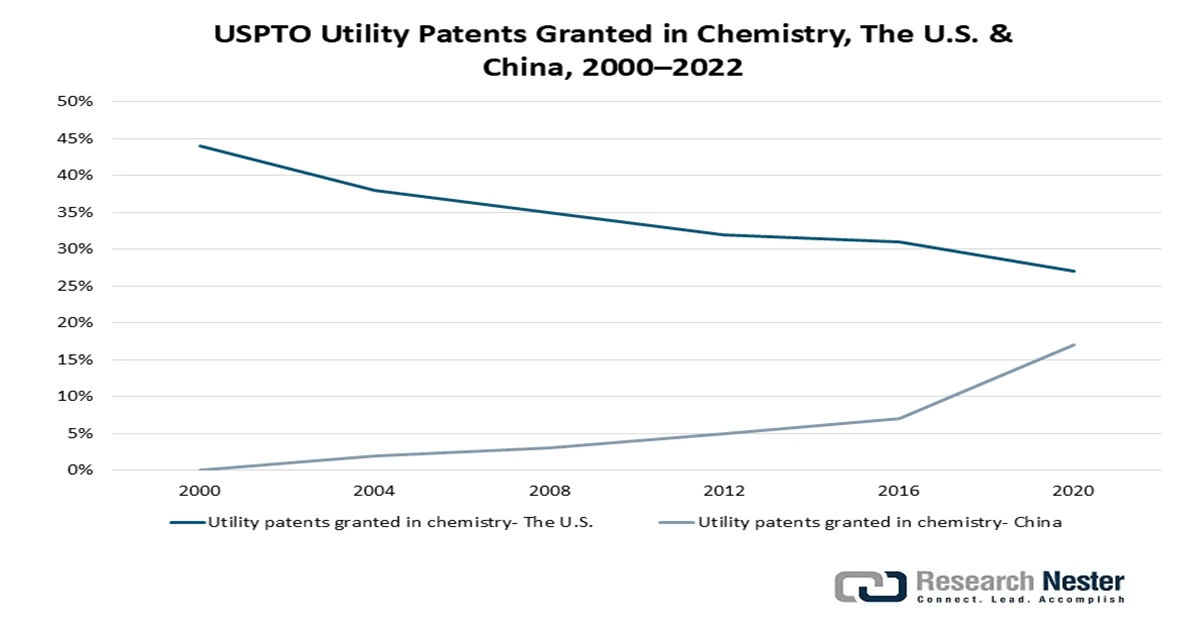
Source: ITIF
Disinfectant and sanitizer product segment is set to garner a prominent share in the market during the forthcoming years. The global disinfectant trade stood at USD 3.4 billion in 2023 and grew at an annual rate of 7.2%. In 2023, China (USD 275 million), Belgium (USD 219 million), and the United Kingdom (USD 171 million) are Japan (-USD 78.5 million), Australia (-USD 70.6 million), and France (-USD 66.6 million) the countries with the largest trade surpluses.
World Disinfectant Trade, Packaged for Retail Sales (2023)
|
Country |
Exporters |
Country |
Imports |
|
Germany |
USD 397 million |
Germany |
USD 281 million |
|
China |
USD 389 million |
The U.S. |
USD 248 million |
|
The U.S. |
USD 382 million |
France |
USD 226 million |
Source: OEC
Key Specialty Chemicals Market Insights Summary:
Regional Insights:
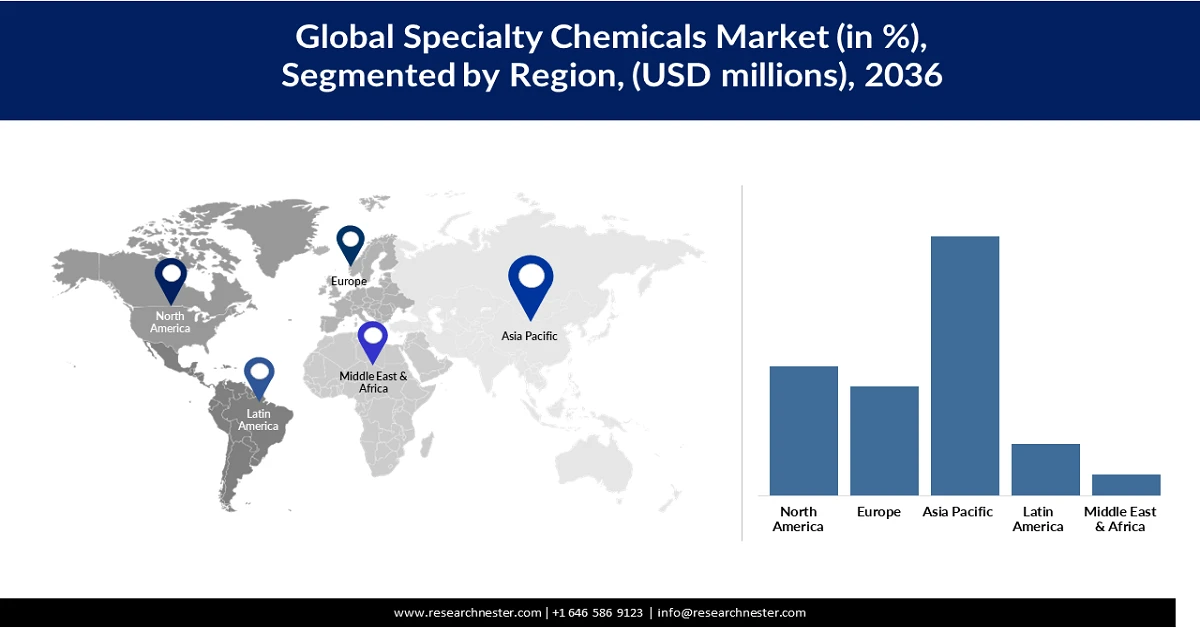
- Asia Pacific in the specialty chemicals market is forecast to capture around 50% share by 2036, underpinned by rapid industrialization, technological innovation, and rising adoption of customized and sustainable chemical solutions.
- North America is emerging as a high-growth region through 2036, supported by strong R&D infrastructure and accelerated uptake of low-VOC, bio-based, and application-specific specialty chemical formulations.
Segment Insights:
- The semiconductor fabrication segment in the specialty chemicals market is projected to account for nearly 40% share by 2036, reinforced by increasing reliance on high-purity and customized chemical inputs across advanced chip manufacturing processes.
Key Growth Trends:
- Rapid expansion of electronics and semiconductor industry
- Expansion of the pharmaceutical and healthcare industries
Major Challenges:
- Volatility in the prices of raw materials
- Complex manufacturing process
Key Players: BASF SE, Dow Inc., Evonik Industries AG, Lanxess AG, Clariant AG, Akzo Nobel N.V., Solvay S.A., Arkema S.A., Huntsman Corporation, Wacker Chemie AG, Croda International Plc, Nouryon, Albemarle Corporation, Eastman Chemical Company, Arkema S.A.
Global Specialty Chemicals Market Forecast and Regional Outlook:
Market Size & Growth Projections:
- 2025 Market Size: USD 940.72 billion
- 2026 Market Size: USD 978.79 billion
- Projected Market Size: USD 1.43 trillion by 2036
- Growth Forecasts: 3.9% CAGR (2026-2036)
Key Regional Dynamics:
- Largest Region: Asia Pacific (50% Share by 2036)
- Fastest Growing Region: Asia Pacific
- Dominating Countries: United States, China, Germany, Japan, South Korea
- Emerging Countries: India, Vietnam, Brazil, Mexico, Indonesia
Last updated on : 3 February, 2026
Specialty Chemicals Market - Growth Drivers and Challenges
Growth Drivers
- Rapid expansion of electronics and semiconductor industry: The growth of the specialty chemicals market is propelled by the increasing trade, as well as the expansion of the semiconductor and electronics industry. The sector is significantly dependent on the performance-critical and highly purified chemical formulations. The production of semiconductors needs a wide range of specialty chemicals, including wet process chemicals, electronic gases, etc., all of which are crucial for cleaning and wafer fabrication. With the surge in demand for modern chips used in data centers and 5G infrastructure, chipmakers are raising their fabrication capacity, further propelling the market growth.
Semiconductor Devices Trade Overview – 2023
|
Category |
Country |
Trade Value (USD Billion) |
|
Leading Exporters |
China |
61.5 |
|
|
Malaysia |
11.1 |
|
|
Germany |
9.23 |
|
Top Importers |
United States |
25.1 |
|
|
Hong Kong |
16.2 |
|
|
China |
11.6 |
Source: OEC
Also, the favorable government funding is also contributing to the increasing sales of specialty chemicals. The Semiconductor Industry Association (SIA) July 2025 data shows that USD 630 billion have been invested since 2022 across 130 projects, creating 500,000 jobs in the U.S.
Top Semiconductor Supply Chain Investment Announcements (2020-2025)
|
Company |
City |
State |
Project Type |
Category |
Technology |
Project Size |
Total Jobs Expected |
Facility Jobs |
Construction Jobs |
Grants |
Loans |
CHIPS Incentives Status |
|---|---|---|---|---|---|---|---|---|---|---|---|---|
|
Air Liquide |
Phoenix |
AZ |
New Facility |
Materials |
Not Available |
- |
- |
- |
- |
- |
- |
- |
|
Air Liquide |
Boise |
ID |
New Facility |
Materials |
Not Available |
$250 million |
- |
- |
- |
- |
- |
- |
|
Air Liquide |
Southeast (TBA) |
US |
New Facility |
Materials |
ultra-pure nitrogen and oxygen |
$50 million |
- |
- |
- |
- |
- |
- |
|
Akash Systems |
West Oakland |
CA |
New Facility |
Semiconductors |
Diamond cooling substrates, devices, and systems |
$121 million |
400 |
- |
- |
$18.2 million |
N/A |
PMT (Nov. 13) |
|
Amorphyx |
Corvallis |
OR |
Expansion |
Semiconductors |
- |
- |
- |
- |
- |
- |
- |
- |
|
Analog Devices |
Chelmsford |
MA |
Expansion/Modernization |
Semiconductors |
RF microwave systems; packaging and test |
- |
- |
500 across 3 locations |
Not Available |
$105 million across 3 locations |
N/A |
PMT (Jan. 16, 2025) |
|
Analog Devices |
Beaverton |
OR |
Expansion/Modernization |
Semiconductors |
180nm and 350nm analog |
$1 billion |
- |
500 across 3 locations |
Not Available |
$105 million across 3 locations |
N/A |
PMT (Jan. 16, 2025) |
|
Analog Devices |
Camas |
WA |
Expansion/Modernization |
Semiconductors |
180nm and 350nm analog |
- |
- |
500 across 3 locations |
- |
$105 million across 3 locations |
N/A |
PMT (Jan. 16, 2025) |
|
ASML |
Chandler |
AZ |
Expansion |
Equipment |
Not Available |
- |
- |
100 |
- |
- |
- |
- |
|
BAE Systems |
Nashua |
NH |
Modernization |
Semiconductors |
Monolithic microwave integrated circuit (MMIC chips) |
$105 million |
- |
24 |
- |
$35.5 million |
N/A |
Final Award (Nov. 25, 2024) |
|
Bosch |
Roseville |
CA |
Expansion/Modernization |
Semiconductors |
200mm silicon carbide |
$1.9 billion |
1700 |
700 |
1000 |
$225 million |
$350 million |
PMT (Dec. 13) |
|
Broadcom |
Fort Collins |
CO |
Expansion |
Semiconductors |
Not Available |
- |
- |
- |
- |
- |
- |
- |
|
Coherent |
Sherman |
TX |
Expansion/Modernization |
Semiconductors |
150mm Indium Phosphide Optoelectronics |
- |
70 |
- |
- |
$33 million |
N/A |
PMT (Dec. 6) |
|
Dongjin Semichem |
Killeen |
TX |
Expansion |
Materials |
electronic-level sulfuric acid (ELSA) |
$176 million |
40 |
- |
- |
- |
- |
- |
|
DuPont |
Glasgow |
DE |
New Facility |
Materials |
- |
$50 million |
10 |
10 |
- |
- |
- |
- |
|
Edwards Vacuum |
Chandler |
AZ |
New Facility |
Equipment |
- |
- |
200 |
200 |
- |
- |
- |
- |
|
Edwards Vacuum |
Basom |
NY |
New Facility |
Equipment |
Semiconductor-grade dry vacuum pumps |
$319 million |
600 |
- |
- |
$18 million |
N/A |
Final Award (Jan. 17, 2025) |
|
EMP Shield |
Burlington |
KS |
New Facility |
Semiconductors |
- |
$1.9 billion |
1200 |
1200 |
- |
- |
- |
- |
Source: SIA
- Expansion of the pharmaceutical and healthcare industries: The growth of the market is significantly propelled by the rising expansion of the pharmaceutical and healthcare industries. The sector is highly reliant on purpose-tailored chemical formulations with high purity. Specialty chemicals are utilized in the synthesis of the active pharmaceutical ingredient, solvents, reagents, etc. According to data published by the International Federation of Pharmaceutical Manufacturers & Associations, in 2022, the pharmaceutical industry contributed more than USD 2,295 billion to the worldwide GDP. The statistics illustrate a significant financial footprint and the pivotal role in upholding prolonged demand for specialty chemicals across the world.
- Growth in the textile and apparel industry: According to the World Economic Forum in 2023, consuming and producing garments sustainably could propel the global economy by more than USD 200 billion by the year 2030. The statistics reflect the scaling of the ongoing transformation in the textile manufacturing. This transition is fostering a significant demand for specialty chemicals such as textile auxiliaries and eco-friendly dyes. There has been a surge in focus on recyclability and durability of textiles, which is speeding the usage of specialty coatings and further reinforcing sustained demand and contributing to the robust growth of the specialty chemicals market.
- Rise in EV battery manufacturing: The boom in EV adoption across the world is accelerating the demand for high-performance chemicals and materials. The continuous technological innovations in EV battery production are likely to accelerate the consumption of specialty chemicals in the coming years. The global demand for EV battery chemicals is set to grow manifold by 2030. The need for advanced energy storage solutions is set to increase the sales of high-performance mobility materials and chemicals in the coming years. According to the Environmental Defense Fund January 2025 announcement, USD 200 billion was EV manufacturing in the U.S, which supports over 50,000 jobs. 84% of this investment was directed to the following top states.
Accounted Investments in 10 States
|
State |
Investment |
New Jobs |
|
Georgia |
USD 31.2 billion |
38,700 |
|
Michigan |
USD 20.4 billion |
18,200 |
|
North Carolina |
USD 19.2 billion |
14,100 |
|
Tennessee |
USD 17.5 billion |
20,200 |
|
Nevada |
USD 15.4 billion |
12,400 |
|
Kentucky |
USD 13.7 billion |
14,000 |
|
South Carolina |
USD 13.6 billion |
18,500 |
|
Ohio |
USD 10.1 billion |
6,400 |
|
Illinois |
USD 8.1 billion |
10,700 |
Source: EDF
Challenges
- Volatility in the prices of raw materials: The market is significantly susceptible to the fluctuations of the prices of the raw materials, mainly in the rare minerals and petrochemical feedstocks. The volatility of the prices is driven by the instability of crude oil and geopolitical tensions, which are prominently impacting the production costs and profit margins. In contrast to the commodity chemicals, specialty chemicals usually depend on customized inputs, which are difficult to replace, further limiting the ability of the manufacturers to hedge the costs. The price volatility complicates the long-term pricing strategy and creates uncertainty for end users and producers.
- Complex manufacturing process: The production of the specialty chemicals includes precision control and sophisticated processes. Any type of deviation can result in the inconsistency of performance and non-compliance with the regulatory norms. Consistently maintaining operational efficiency while ensuring consistent quality raises the costs of production. Additionally, scaling up the production to commercial levels is technically challenging and usually needs specialized expertise and customized equipment, which raises the overall costs of the operation.
Specialty Chemicals Market Size and Forecast:
| Report Attribute | Details |
|---|---|
|
Base Year |
2025 |
|
Forecast Year |
2026-2036 |
|
CAGR |
3.9% |
|
Base Year Market Size (2025) |
USD 940.72 billion |
|
Forecast Year Market Size (2036) |
USD 1.43 trillion |
|
Regional Scope |
|
Specialty Chemicals Market Segmentation:
End-user Segment Analysis
The semiconductor fabrication segment is predicted to acquire the largest share on the back of significantly high reliance on high-purity and application-specific chemical formulations across every stage of chip manufacturing. The production of semiconductors is a significantly complex and chemically intensive process, needing specialty chemicals for etching, cleaning, etc. As the chip architecture is advancing in the direction of higher transistor densities and smaller technology nodes, the demand for modern photoresists and wet chemicals is increasing in both volume and value.
The preeminence is also strengthened by the worldwide expansion of the semiconductor manufacturing capacity, bolstered by the rising demand for chips from consumer electronics and industrial automation. Various governments across regions are actively aiding domestic semiconductor ecosystems through subsidies and supply-chain localization initiatives. Additionally, the semiconductor industry’s emphasis on defect reduction and process reliability, and continuous use of customized and high-margin specialty chemicals, makes this segment structurally more lucrative than other end-use industries.
Our in-depth analysis of the specialty chemicals market includes the following segments:
|
Segment |
Subsegment |
|
End-user Application |
|

Vishnu Nair
Head - Global Business DevelopmentCustomize this report to your requirements — connect with our consultant for personalized insights and options.
Specialty Chemicals Market - Regional Analysis
Asia Pacific Market Insights
The Asia Pacific specialty chemicals market is predicted to garner 50% of the market share by 2036. The growth of the market can be attributed to the expanding technological innovation and rapid industrialization in the region. There is strong demand from prominent industries such as electronics, automotive, and agrochemicals is fostering the adoption of the sociality chemicals, which offer customization and sustainability. Moreover, the strong focus on eco-friendly chemical solutions and increasing disposable incomes is propelling the consumption of advanced materials. Also, the region is going through a green chemistry revolution, which is unlocking new opportunities.
The specialty chemicals market in China is propelled by the presence of strong manufacturing bases and the rapid growth of the end-use industries in the country. The growth of the market can also be attributed to the rising urbanization in the country. For instance, according to data published by the World Health Organization, by 2030, it is projected that about 70% of the people in China will live in cities. This illustrates that there will be a rising need for transportation networks and housing in the country, further augmenting the market growth. Furthermore, government-led industrial advancements initiatives, which are focusing on eco-friendly chemical solutions, are encouraging innovation and capacity expansion.
The market in India is witnessing staggering growth owing to the rising export opportunities and increasing shift toward value-added chemicals. There is a surge in acceptance of the country’s specialty chemicals in the regulated market is strengthening export revenues. The country’s strong API and formulation industry is raising demand for specialty intermediates and performance chemicals. Also, there is a surge in environmental regulations and customer preference for eco-friendly products, which is speeding the adoption of low-toxicity specialty chemicals. There has been a surge in improved crop protection needs, and export-oriented formulations are boosting specialty agrochemical consumption. Foreign Direct Investments (FDI) inflows in the chemicals sector (excluding fertilizers) in FY 2025 were USD 23.2 billion. Moreover, the IBEF estimated that the chemicals and allied product exports reached USD 108.59 in FY 2025. The India chemical market is presently stands at USD 220 billion and is projected to value at USD 300 billion by 2030 and USD 1 trillion by 2040.
Top 5 Countries in Agrochemical Exports from India in 2022
|
Country |
Export Value (USD Billion) |
|
China |
11.1 |
|
India |
5.5 |
|
United States |
5.4 |
|
France |
4.1 |
|
Germany |
3.9 |
Source: CCFI
North America Market Insights
In North America, the growth of the market is augmented by the sustainability priorities and supportive infrastructure. There is a rapid expansion in the construction and electronics is propelling the requirement for application-specific chemical solutions. The robust research and development capabilities and manufacturing infrastructure, boosting the development of varied products, with low-VOC and bio-based formulations, are speeding the innovation toward sustainable specialty chemicals. Cumulatively, these factors are placing the region as a dynamic market with robust growth momentum for specialty chemicals.
The U.S. specialty chemicals market growth is propelled by the growth in electric vehicles and lightweight materials. Also, there is a resurgence of semiconductor manufacturing in the U.S., mainly owing to support from the CHIPS Act, which has reignited the demand for ultra-high-purity specialty chemicals used in photolithography. Moreover, market forces are propelling the shift towards bio-based specialty chemicals. Producers in the country are increasingly manufacturing low-VOC formulations and eco-friendly materials in response to environmental mandates. The quantifiable outcomes of these green chemistry initiatives are demonstrable as by the year 2022, more than 133 winning green chemistry technologies in the U.S. have eradicated 830 million pounds of hazardous chemicals and solvents annually. This illustrates the industry’s transition to environmentally compliant and sustainable production pathways. Such progress reinforces sustainability as a key structural growth driver for the U.S. specialty chemicals market. According to the analysis by the American Chemistry Council (ACC), the U.S. chemical demand is expected to increase at a growth rate of 15.5% by 2033. This highlights that investing in the U.S. is likely to double the revenues of specialty chemical producers. The green chemistry trends are also expected to drive the overall market growth in the coming years.
The specialty chemicals market in Canada is set to witness significant growth on the back of the country’s strategy for critical minerals and modern material ecosystem, mainly nickel and rare earth processing. These procedures need specialized reagents and high-purity processing additives. The country is pioneering in low-carbon industrial processes, which is stimulating demand for specialty chemicals that foster emissions reduction. Additionally, the expansion of precision farming across prominent provinces such as Manitoba and Saskatchewan is augmenting the consumption of specialty agrochemicals, micronutrients, and formulation additives tailored to local crop conditions.
Europe Market Insights
In Europe, a strict regulatory framework such as the EU Green Deal and REACH is speeding up the demand for eco-friendly specialty chemicals. The region has an impeccable base for aerospace, automotive, and industrial manufacturing sectors, which is continuing to generate steady demand for performance chemicals. Other than this, the rapid transition to renewable energy and battery manufacturing is propelling the consumption of specialty chemicals used in energy storage and electronic components. Robust R&D intensity and collaboration between chemical producers further support innovation and act as a catalyst for market growth.
The market in Germany is propelled by the presence of industrial specialization, which generates a highly localized demand for modern chemical solutions. For instance, Ludwigshafen is home to the world’s largest integrated chemical complexes, fostering the demand for specialty intermediates with the help of a vertically integrated manufacturing ecosystem. Moreover, the country has leadership in the Energiewende (energy transition), which is speeding the demand for specialty chemicals utilized in wind turbines and hydrogen technologies.
Annually Licensed Onshore Wind Power Capacity in Germany
|
Year |
Newly Licensed Onshore Wind Capacity (MW) |
|
2015 |
3,722 |
|
2016 |
9,411 |
|
2017 |
1,387 |
|
2018 |
1,580 |
|
2019 |
1,964 |
|
2020 |
2,959 |
|
2021 |
4,136 |
|
2022 |
4,246 |
|
2023 |
7,574 |
|
2024 |
14,056 |
Source: Fachagentur Wind und Solar, 2024
The UK specialty chemicals market growth is driven by the country’s leadership in modern materials and high-value manufacturing. Additionally, post-Brexit environmental regulations are accelerating innovation in green chemistry and the development of sustainable specialty chemicals. Similarly, the expansion of the fragrance industry in the country is leading to an increased demand for specialty ingredients. Fragrance formulations need a wide range of specialty aroma chemicals, solvents, stabilizers, etc., that are produced through advanced chemical synthesis, further propelling the market growth.
Top Export Destinations from the UK in 2024 (USD)
|
Country |
Value (USD) |
|
Ireland |
USD 126.3 million |
|
Belgium |
USD 77.0 million |
|
Netherlands |
USD 76.6 million |
|
United States |
USD 75.0 million |
|
United Arab Emirates |
USD 37.1 million |
Source: OEC
Key Specialty Chemicals Market Players:
- BASF SE
- Dow Inc.
- Evonik Industries AG
- Lanxess AG
- Clariant AG
- Akzo Nobel N.V.
- Solvay S.A.
- Arkema S.A.
- Huntsman Corporation
- Wacker Chemie AG
- Croda International Plc
- Nouryon
- Albemarle Corporation
- Eastman Chemical Company
- Arkema S.A
- Company Overview
- Business Strategy
- Key Product Offerings
- Financial Performance
- Key Performance Indicators
- Risk Analysis
- Recent Development
- Regional Presence
- SWOT Analysis
- BASF SE (Germany) is one of the world’s leading players in the specialty chemicals market, with a strong focus on delivering high-value, application-specific chemical solutions. The company’s specialty chemicals portfolio includes performance materials, industrial solutions, catalysts, coatings, construction chemicals, and agricultural solutions, catering to key end-use industries such as automotive, construction, electronics, packaging, energy, and consumer goods.
- Dow Inc. (U.S.) is a major global player in the specialty chemicals market, recognized for its strong focus on material science–driven, high-performance chemical solutions. Dow’s specialty chemicals portfolio spans performance plastics, specialty polymers, coatings, adhesives, sealants, elastomers, and advanced silicone-based materials, serving critical end-use industries such as packaging, construction, automotive, electronics, infrastructure, and consumer care.
- Evonik Industries AG (Germany) is a leading global specialty chemicals company with a strong emphasis on innovation-driven, high-margin products. Evonik’s specialty chemicals portfolio spans specialty additives, high-performance polymers, smart materials, silica, surfactants, and nutrition & care solutions, catering to diverse end-use industries including automotive, construction, electronics, healthcare, personal care, agriculture, and animal nutrition.
- Lanxess AG (Germany) is a prominent global player in the specialty chemicals market, known for its strong focus on high-value, application-oriented chemical solutions. Lanxess’s specialty chemicals portfolio includes specialty additives, high-performance plastics intermediates, advanced rubber chemicals, flame retardants, water treatment chemicals, and engineering materials, serving key end-use industries such as automotive, construction, electronics, consumer goods, agriculture, and water management.
Below is the list of the key players operating in the global specialty chemicals:
Here are a few areas of focus covered in the competitive landscape of the market:
The specialty chemicals market is distinguished by a highly innovation-driven landscape, and the trailblazing players are continuously reinforcing their technological capabilities to maintain differentiation. Companies are emphasizing application-specific formulations, focusing on sustainability to meet evolving end-use requirements. Also, the market participants are investing significantly in green chemistry and bio-based alternatives, positioning specialty chemicals as value-adding and regulation-compliant solutions rather than commoditized inputs.
Corporate Landscape of the Specialty Chemicals Market:
Recent Developments
- In June 2025, Arkema S.A. highlighted its advanced product portfolio at Chemspec Europe 2025, one of the premier events for fine and specialty chemicals, reinforcing its innovation and application-oriented strategy for diversified industrial markets. Arkema’s Thiochemicals Business Unit showcased a comprehensive range of high-performance intermediates, additives, and specialty chemistries that support critical industrial applications spanning agrochemicals, pharmaceuticals, electronics, etc.
- Report ID: 5175
- Published Date: Feb 03, 2026
- Report Format: PDF, PPT
- Explore a preview of key market trends and insights
- Review sample data tables and segment breakdowns
- Experience the quality of our visual data representations
- Evaluate our report structure and research methodology
- Get a glimpse of competitive landscape analysis
- Understand how regional forecasts are presented
- Assess the depth of company profiling and benchmarking
- Preview how actionable insights can support your strategy
Explore real data and analysis
Frequently Asked Questions (FAQ)
About this Report
Connect with our Expert


Copyright @ 2026 Research Nester. All Rights Reserved.
