Technical Foam Market Outlook:
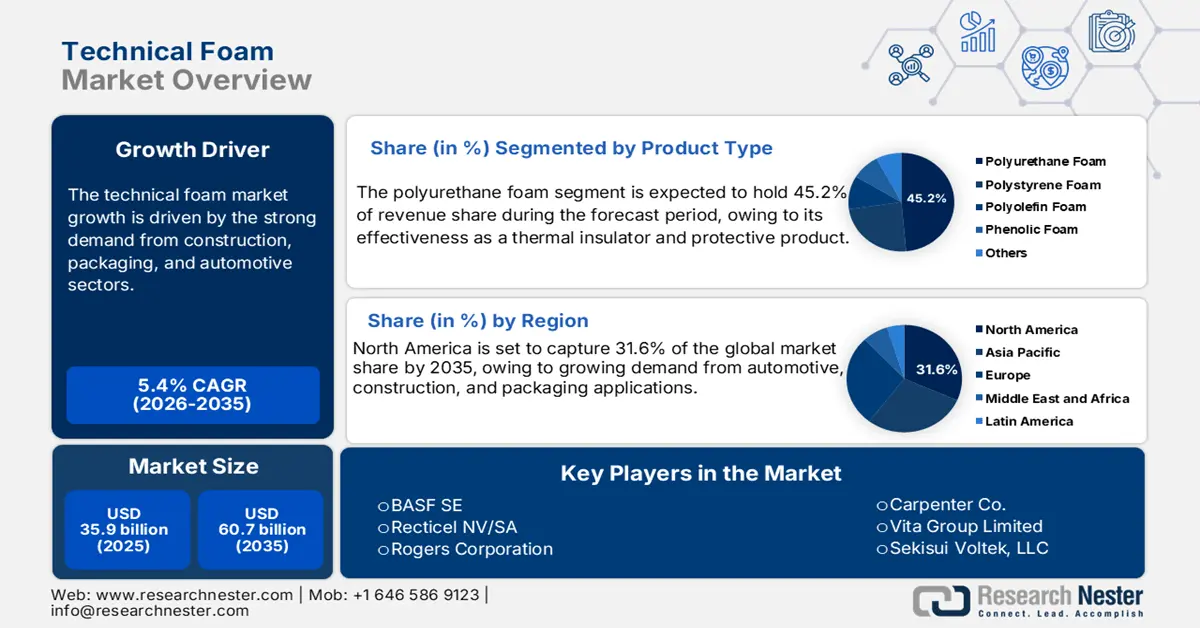
Technical Foam Market size was valued at USD 35.9 billion in 2025 and is expected to surpass USD 60.7 billion by the end of 2035, rising at a CAGR of 5.4% during the forecast period, i.e., 2026-2035. In 2026, the industry size of technical foam is evaluated at USD 37.8 billion.
The booming e-commerce activities across the world are directly propelling the consumption of technical foam. The U.S. Census Bureau reported that online retail sales for April to June 2025 reached USD 304.2 billion. This is a 1.4% increase (±0.9%) compared to the first three months of 2025, after adjusting for seasonal changes but not for price changes. The need for protective packaging, owing to robust online retail trade, is poised to fuel the sales of technical foams. The World Packaging Organization estimates that the e-commerce packaging market is estimated to increase from USD 69.3 billion in 2023 to USD 111.9 billion by 2028. The polyethylene and polyurethane foams are being widely used for cushioning, impact resistance, and vibration damping. Furthermore, in North America and Europe, stricter sustainability policies are pushing packaging suppliers to shift toward eco-friendly foams, while Asia Pacific leads in volume demand due to its booming e-commerce hubs, including China and India.
Key Technical Foam Market Insights Summary:
Regional Highlights:
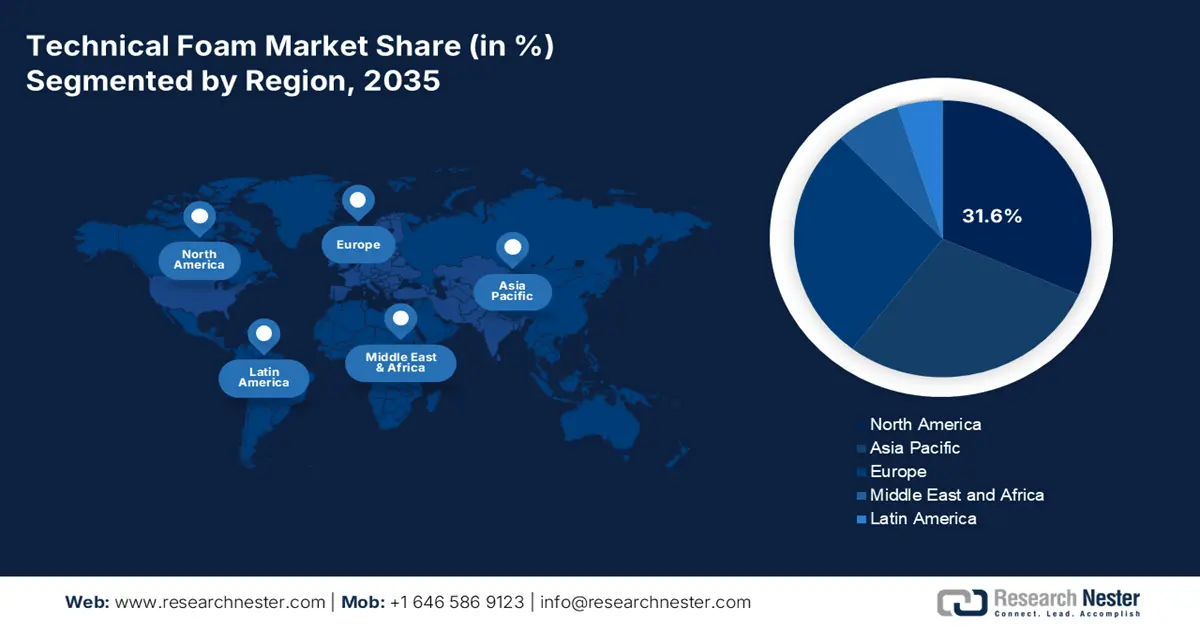
- The North America technical foam market is expected to command 31.6% of the global share through 2035, stemming from escalating adoption across automotive, construction, and packaging applications.
- Asia Pacific is projected to secure 28.8% of the global share by 2035 in the Technical Foam Market, attributed to rapid industrialization and expanding automotive, construction, and electronics sectors.
Segment Insights:
- The polyurethane foam segment is anticipated to capture a 45.2% share by 2035 in the technical foam market, propelled by its widespread use in construction and automotive applications due to its lightweight and thermal insulation advantages.
- The automotive segment is forecasted to attain a 38.2% share by 2035, influenced by rising adoption of lightweight NVH-control foams and tightening CO₂ emission norms.
Key Growth Trends:
- Growth in automotive lightweighting initiatives
- Rising construction and infrastructure investments
Major Challenges:
- Raw material price volatility
- Recycling & disposal challenges
Key Players: BASF SE, Recticel NV/SA, Armacell International S.A., Rogers Corporation, FoamPartner Group (part of Recticel), UFP Technologies, Inc., Carpenter Co., Vita Group Limited, Sekisui Voltek, LLC, Foamex International Inc., Foamtech Ltd., Fagerdala Group, Foamco Industries, Inoac Polymer Korea Inc., Heveafoam Sdn Bhd
Global Technical Foam Market Forecast and Regional Outlook:
Market Size & Growth Projections:
- 2025 Market Size: USD 35.9 billion
- 2026 Market Size: USD 37.8 billion
- Projected Market Size: USD 60.7 billion by 2035
- Growth Forecasts: 5.4% CAGR (2026-2035)
Key Regional Dynamics:
- Largest Region: North America (31.6% Share by 2035)
- Fastest Growing Region: Europe
- Dominating Countries: United States, China, Germany, Japan, United Kingdom
- Emerging Countries: India, South Korea, Brazil, Mexico, Indonesia
Last updated on : 28 August, 2025
Technical Foam Market - Growth Drivers and Challenges
Growth Drivers
- Growth in automotive lightweighting initiatives: The main driver of the technical foam sales is the growing demand for lightweight materials used in building consumer vehicles to improve fuel efficiency and lower emissions. The U.S. Department of Energy (DOE) recently estimated that for every 10% weight reduction in a vehicle, fuel economy improves by 6-8%. One of the primary elements contributing to the demand for technical foams, such as polyurethane and polyolefin foams, is the usage of foams in seat cushioning, headliners, and NVH (noise, vibration, and harshness) products. The growing global trend toward electric vehicles is estimated to fuel the consumption of technical foams, mainly due to the thermal insulation, acoustic management, and battery housing requirements in EVs.
- Rising construction and infrastructure investments: Technical foams are also commonly used in insulation panels, sealants, and structural foam components. In April 2025, total construction spending, according to the U.S. Census Bureau, was recorded at USD 2.1 trillion. This marks a substantial increase from the previous year on a year-over-year basis, mainly driven by the residential and commercial projects. Closed-cell expanded polystyrene (EPS) and polyurethane foams are the two main types of technical foams in the construction sector and are an important part of the energy efficiency equation for these energy-efficient buildings due to their thermal insulation properties. As these provide a way to meet green building requirements are likely to gain momentum around the globe. Demand is strongest in Asia Pacific, specifically China and India, where urbanization and major investments in infrastructure as part of their national development plans are gaining traction.
- Increasing adoption in healthcare sector: Technical foams are being widely used in the healthcare sector, particularly in prosthetics and equipment. The aging global population and rising healthcare expenditure are the main growth drivers for technical foams. Technical foams such as polyurethane and silicone are widely used from wound care to prosthetics. A high demand for technical foam is also registered from the hospital bedding, cushions, and surgical pad manufacturers. In February 2024, Pregis introduced a new foam technology made with recycled polyethylene resins through its collaboration with ExxonMobil. Such developments are expected to enable end users, including healthcare companies, to achieve their circular economy goals by using recycling plastics.
Challenges
- Raw material price volatility: Volatile prices of petrochemicals, feedstock impact the production cost of technical foams. For instance, despite halting production due to the COVID-19 pandemic in 2020, global ethylene prices increased substantially in 2021. Further, in 2022, the Hanjin Shipping Company crisis also hiked the polyurethane (PU) feedstock prices. Volatile prices impact the foam manufacturer's profitability and restrict OEMs from entering into long-term contracts, particularly in industries such as automotive and packaging. This directly limits market growth and creates financial uncertainty for small to mid-sized foam manufacturers in many regions across the world.
- Recycling & disposal challenges: Technical foams, especially cross-linked polyethylene (XLPE) foams and PU foams, have limited options for recycling at the end-of-life. Worldwide, there is not yet a cost-efficient set of technologies in place or recycling infrastructure to manage these materials, and their accumulation in landfills has attracted scrutiny from environmental companies and curtailed use in sustainable construction, automotive, and packaging sectors, which espouse a circular economy.
Technical Foam Market Size and Forecast:
| Report Attribute | Details |
|---|---|
|
Base Year |
2025 |
|
Forecast Year |
2026-2035 |
|
CAGR |
5.4% |
|
Base Year Market Size (2025) |
USD 35.9 billion |
|
Forecast Year Market Size (2035) |
USD 60.7 billion |
|
Regional Scope |
|
Technical Foam Market Segmentation:
Product Type Segment Analysis
The polyurethane foam segment is anticipated to account for 45.2% of the global technical foam market share during the projected period, due to its effectiveness as a thermal insulator and protective product. Polyurethane foam is suitable for many uses, especially in the construction and automotive fields, owing to its lightweight, pliable, and breathable features. Reports from the U.S. Department of Energy (DOE) indicate that thermal insulation and insulation for polyurethane foam promote energy efficiencies in buildings, from 10% to 20% energy savings in buildings, and the implementations are extensive. Also, the U.S. Environmental Protection Agency (EPA) and DOE projects that many low-emission polyurethane foams, such as low-emission foam in furniture, for example, have been verified to meet and comply with green building criteria by the ENERGY STAR program. Such observations are directly accelerating the demand for polyurethane foams
Application Segment Analysis
The automotive segment is expected to constitute the most significant growth by 2035, with 38.2% technical foam market share, mainly due to the increasing demand for noise, vibration, and harshness (NVH) control foams for electric vehicles and fuel efficiency requirements. Concerning automotive weight reduction, technical foams have the potential to make autos lighter and contribute to sustainability and fuel efficiency. Several environmental protection agencies also observe that stringent CO₂ emission requirements for vehicles emphasize the use of foams for weight reduction and fuel economy. Overall, the modern design and regulatory requirements are likely to promote the application of lightweight materials, including technical foams.
Form Segment Analysis
The flexible segment is poised to account for 56.5% of the global technical foam market share, owing to its volume, versatility, and evolving sustainability. The food packaging sector dominates the consumption of flexible technical foams. The stretch/shrink wrap, hygiene liners, agricultural mulch, e-commerce mailers, pouches, silage, protective films, and medical disposables are some of the prime application areas of the flexible polyethylene foams. For instance, the WPO’s data reveals that the fresh food packaging market crossed USD 95.2 billion by the end of 2025. The swift rise in food demand is directly set to propel the use of polyethylene foams.
Our in-depth analysis of the technical foam market includes the following segments:
|
Segment |
Subsegment |
|
Product Type |
|
|
Application |
|
|
End use |
|
|
Form |
|

Vishnu Nair
Head - Global Business DevelopmentCustomize this report to your requirements — connect with our consultant for personalized insights and options.
Technical Foam Market - Regional Analysis
North America Market Insights
The North America technical foam market is expected to hold 31.6% of the global revenue share through 2035, driven by high demand from automotive, construction, and packaging applications. The region’s strong industrial base and adoption of high-performance materials are creating a profitable environment for technical foam manufacturers. The insulation foams in residential and commercial projects are gaining traction, owing to their lightweight and versatility. The shift toward bio-based and recyclable foams is expected to drive innovations in the technical foam market in the years ahead.
The U.S. leads the sales of technical foams, due to its diversified industrial ecosystem and advanced R&D capabilities. Construction is a core driver for the technical foam market in the country. The push for green buildings is fueling a high demand for polyurethane and polystyrene foams in insulation and soundproofing. The report from the Census Bureau states that construction spending during June 2025 stood at USD 2136.3 billion. The rising construction activities are anticipated to double the revenues of technical foam companies. The healthcare sector is also contributing to the high sales of technical foams, owing to their high use in bedding, wound care, and prosthetics.
Asia Pacific Market Insights
The Asia Pacific technical foam market is anticipated to account for 28.8% of the global revenue share, due to rapid industrialization and urbanization activities. The strong demand for technical foams is also registered from the automotive, construction, and electronics industries. China dominates the market due to its scale in automotive, electronics, and construction. The know-how tactics and innovation leadership are boosting investments in Japan and South Korea. Further, India is emerging as a hotspot owing to swift infrastructure expansion and a rapidly expanding healthcare sector.
The India technical foam market is estimated to increase at the fastest CAGR from 2026 to 2035, due to massive construction activities and rising automotive production. The Ministry of Information and Broadcasting reveals that the infrastructure investment is registering a boom, owing to aggressive public-private partnerships. The total infrastructure spending grew by around USD 120.4 billion in FY 2023-24. The expanding healthcare demand and innovations, coupled with increasing early adoption rates, are poised to fuel the consumption of technical foams.
Europe Market Insights
The Europe technical foam market is foreseen to expand at a high pace between 2026 and 2035, owing to the advanced manufacturing practices and stringent regulatory standards. The polyurethane, polyethylene, and polystyrene foam grades are widely consumed across automotive, construction, aerospace, healthcare, and packaging sectors. The EU directives on energy efficiency and building performance mandates are boosting the demand for insulation and acoustic foams. Furthermore, the EV trends in the U.K., France, Germany, and Spain are opening high-earning opportunities for technical foam producers.
The technical foam sales in Germany are set to be driven by the strong automotive and advanced manufacturing base. The county’s large OEM network, including Volkswagen, BMW, and Mercedes-Benz, is propelling the technical foam consumption. These automakers are heavily dependent on lightweight foams for NVH control, thermal management, and safety components. The data from the European Commission highlights that the battery electric vehicle registrations increased by 54% in April 2025. Investing in Germany is likely to double the returns.
|
Strong Growth in Electric and Plug-in Hybrid Segments |
|||
|
Segment |
Registrations (Units) |
YoY Growth |
Market Share |
|
BEV (Battery Electric Vehicles) |
45,535 |
+53.5% |
18.8% (up from 13.3% in Apr 2024) |
|
PHEV (Plug-in Hybrid Electric Vehicles) |
24,317 |
+60.7% |
10% |
Source: European Commission
Key Technical Foam Market Players:
- BASF SE
- Company Overview
- Business Strategy
- Key Product Offerings
- Financial Performance
- Key Performance Indicators
- Risk Analysis
- Recent Development
- Regional Presence
- SWOT Analysis
- Recticel NV/SA
- Armacell International S.A.
- Rogers Corporation
- FoamPartner Group (part of Recticel)
- UFP Technologies, Inc.
- Carpenter Co.
- Vita Group Limited
- Sekisui Voltek, LLC
- Foamex International Inc.
- Foamtech Ltd.
- Fagerdala Group
- Foamco Industries
- Inoac Polymer Korea Inc.
- Heveafoam Sdn Bhd
In the extremely competitive global technical foam market, prominent companies are focused on boosting production, developing biodegradable foam alternatives, and executing strategic mergers and acquisitions to solidify their positions. Leading companies with prowess in research and the ability to design smart insulation technologies are capturing lucrative shares. Several firms in Asia, including Inoac Corporation and Sekisui Chemical, use robust and cost-effective manufacturing capabilities in conjunction with multiple product varieties. Many of the local dominant firms in India and Australia are exporting foam products to meet global demand. Other strategies include supply chain digitization and associations with the automotive, aerospace, and construction sectors to produce specialized, high-performance foams.
Some of the key players operating in the technical foam market are listed below:
Recent Developments
- In July 2025, Covestro introduced advanced flame-retardant encapsulation foam for EV batteries. This polyurethane foam limits thermal propagation and improves battery safety.
- In March 2025, BASF launched biomass balance grades of Elastoflex polyurethane systems for North American furniture applications. These solutions reduce carbon footprint by up to 75% lower than traditional foams.
- Report ID: 2737
- Published Date: Aug 28, 2025
- Report Format: PDF, PPT
- Explore a preview of key market trends and insights
- Review sample data tables and segment breakdowns
- Experience the quality of our visual data representations
- Evaluate our report structure and research methodology
- Get a glimpse of competitive landscape analysis
- Understand how regional forecasts are presented
- Assess the depth of company profiling and benchmarking
- Preview how actionable insights can support your strategy
Explore real data and analysis
Frequently Asked Questions (FAQ)
Technical Foam Market Report Scope
Free Sample includes current and historical market size, growth trends, regional charts & tables, company profiles, segment-wise forecasts, and more.
Connect with our Expert


Copyright @ 2026 Research Nester. All Rights Reserved.
