Plastic Waste Management Market Outlook:
Plastic Waste Management Market size was valued at USD 41.5 billion in 2025 and is projected to reach USD 64.4 billion by the end of 2035, rising at a CAGR of 4.5% during the forecast period, i.e., 2026-2035. In 2026, the industry size of plastic waste management is anticipated at USD 43.3 billion.
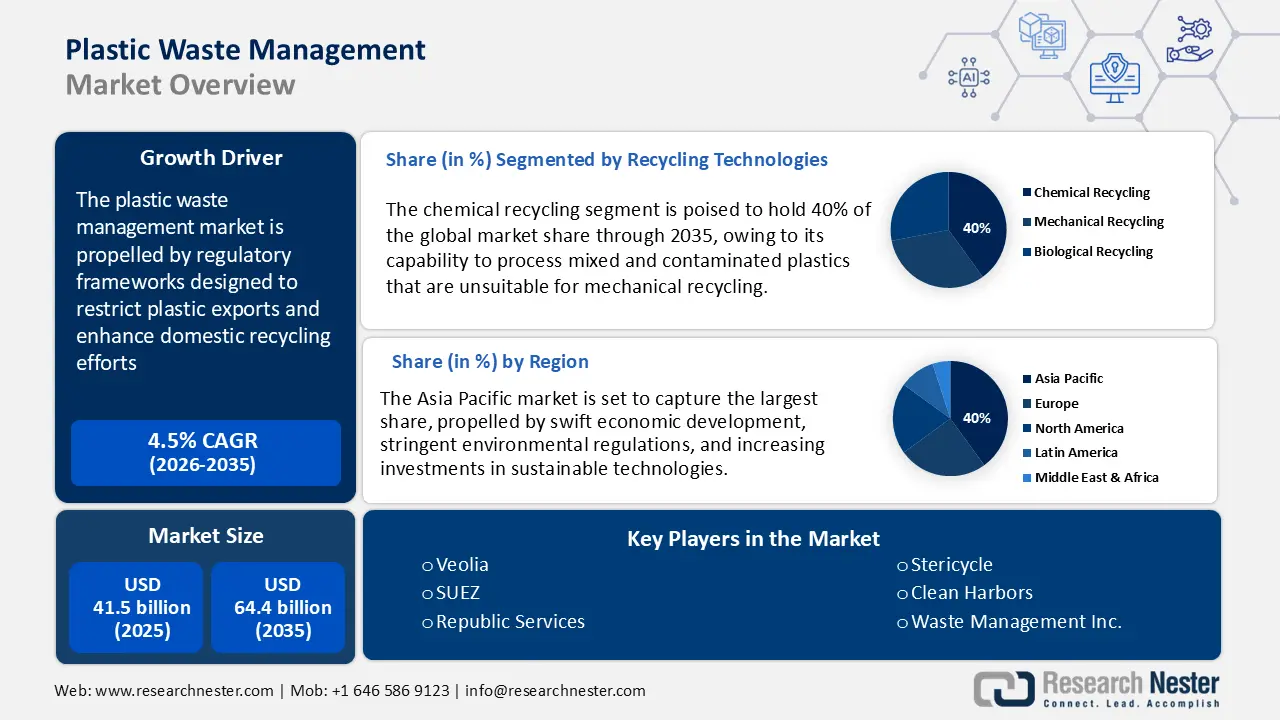
The growth of the market is mainly propelled by regulatory frameworks designed to restrict plastic exports and enhance domestic recycling efforts. The amendment to the Basel Convention 2019 mandates prior informed consent for the export of contaminated plastic waste among 189 countries, thereby limiting the transfer of waste from developed to developing nations. Concurrently, China’s initiative known as Operation National Sword has drastically decreased global imports of plastic waste since 2018. These rules promote investing more in local sorting and recycling plants.
Supply chains for raw materials are increasingly focusing on sourcing recycled feedstock domestically. According to the UN Trade and Development (UNCTAD), in 2023, the global trade in plastics crossed USD 1.1 trillion, totaling 323 million metric tons. The same source also states that more than 78% of all plastic manufactured is commercialized internationally. Also, 75% of all plastics ever produced end up as waste. Furthermore, the European Commission reveals that in 2024, the EU exported 35.7 million tonnes of recyclable raw materials while importing 46.7 million tonnes, which reflects a growing capacity for internal recycling. Research and development investments are supported by government grants and industry levies associated with Extended Producer Responsibility (EPR) schemes under the oversight of Basel. Although consumer-level Consumer Price Index (CPI) data is scarce, service costs continue to be pressured by inflation in upstream feedstock and energy.
Key Plastic Waste Management Market Insights Summary:
Regional Highlights:
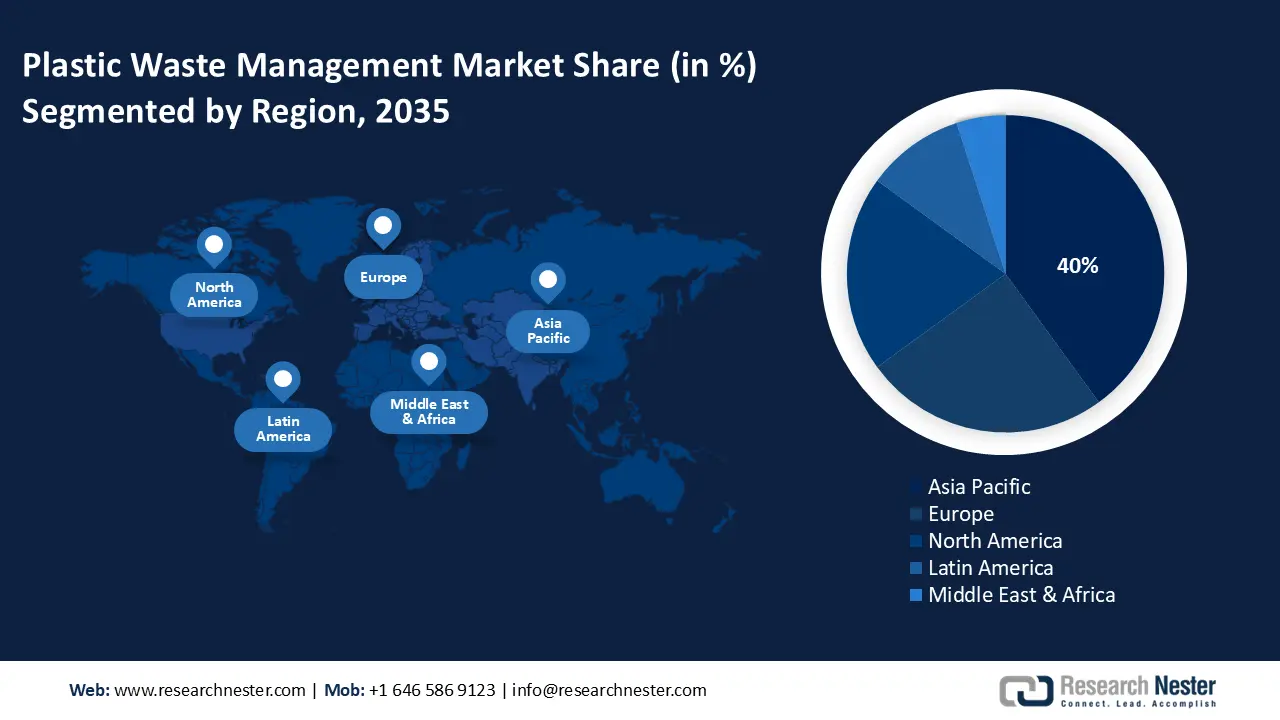
- Asia Pacific is expected to hold a 40% revenue share by 2035 in the plastic waste management market as a result of swift economic development and rising investments in sustainable technologies.
- Europe is anticipated to account for a 30% share through 2035 impelled by stringent environmental regulations and accelerated circular economy initiatives.
Segment Insights:
- The chemical recycling segment is projected to capture 40% of the plastic waste management market by 2035 supported by its capability to convert mixed and contaminated plastics into usable feedstock.
- The mechanical sorting segment is forecasted to secure a 28% share throughout the study period propelled by the growing integration of automated systems to improve recycling efficiency.
Key Growth Trends:
- EU ECHA and REACH-like standards
- Shift toward circular economy models
Major Challenges:
- Pricing pressures from raw material volatility
- High costs of recycling infrastructure
Key Players: Dow Inc., SABIC (Saudi Basic Industries), Mitsubishi Chemical Corporation, LyondellBasell Industries, Covestro AG, LG Chem, Reliance Industries Limited, Mitsui Chemicals, Inc., Formosa Plastics Corporation, INEOS Group, Braskem S.A., Petronas Chemicals Group Berhad, SABIC Innovative Plastics, Queensland Chemical Industries.
Global Plastic Waste Management Market Forecast and Regional Outlook:
Market Size & Growth Projections:
- 2025 Market Size: USD 7.41 billion
- 2026 Market Size: USD 7.78 billion
- Projected Market Size: USD 12.66 billion by 2035
- Growth Forecasts: 5.5% CAGR (2026-2035)
Key Regional Dynamics:
- Largest Region: Asia Pacific (40% Share by 2035)
- Fastest Growing Region: North America
- Dominating Countries: United States, Germany, France, China, Japan
- Emerging Countries: China, India, Japan, South Korea, Thailand
Last updated on : 9 September, 2025
Plastic Waste Management Market - Growth Driver and Challenges
Growth Driver
- EU ECHA and REACH-like standards: According to ECHA’s REACH regulations, chemical manufacturers in the EU are required to register hazardous substances, which include plastic additives, providing comprehensive information on hazards and exposure. This legal structure promotes transparency throughout the plastic chemical supply chain. Consequently, there is an increasing demand for green chemical formulations and environmentally friendly plastic additives. Businesses are investing more in green process designs to fulfill REACH requirements. This regulation is prompting significant changes in the production and management of plastic-related chemicals.
- Shift toward circular economy models: The shift from a linear model (make-use-dispose) to a circular economy model (reduce-reuse-recycle) is set to transform the global market growth throughout the forecast period. Several governments worldwide are implementing strict regulations around plastic packaging, while corporations are focused on mounting ESG and consumer pressure to cut virgin plastic use, which is likely to propel the sales of waste management systems. The EU’s Circular Economy Action Plan, India’s strict mandate for Extended Producer Responsibility (EPR) rules for plastic packaging, and the U.S. state-level initiatives are some of the key market drivers. Furthermore, in California, beverage manufacturers are required to use 50% of recycled content in plastic containers by 2030. Such standardized reduction and recycling targets are creating a profitable environment for plastic waste management solution producers.
- Digitalization of waste management: The move toward digitalization is expected to boost sales of smart plastic waste management solutions in the coming years. Technologies such as IoT-connected collection systems, smart bins, and AI-powered sorting machines are becoming popular as they work efficiently and offer reduced operational costs. Big companies are investing heavily in fast, accurate AI robotic arms that make decisions in real time. In September 2024, Greyparrot introduced a new version of its Greyparrot Analyzer unit. This system is installed above conveyor belts in recycling plants and uses smart cameras to take real-time pictures through AI. This digital trend is likely to speed up the use of smart waste management technologies in the future.
Challenges
- Pricing pressures from raw material volatility: The volatility in raw material prices, influenced by geopolitical events and disruptions in the supply chain, has a considerable effect on chemical manufacturers involved in plastic waste management. For instance, the geopolitical conflicts among several countries create price complexities and diminish profit margins. Manufacturers are challenged with the choice of either absorbing these increased costs or transferring them to customers, which in turn impacts market competitiveness and the stability of demand.
- High costs of recycling infrastructure: The production and installation of sorting and chemical recycling technologies require heavy CAPEX, which potentially limits their adoption in price-sensitive markets. This factor is observed less in the developed areas such as the U.S., Japan, and Europe, as the cost of plastic waste management infrastructure is often covered by public incentives, schemes, subsidies, recycling programs, or sustainability initiatives. The lack of eco-friendly projects and funding is likely to hamper the sales of plastic waste management solutions in some developing economies.
Plastic Waste Management Market Size and Forecast:
| Report Attribute | Details |
|---|---|
|
Base Year |
2025 |
|
Forecast Year |
2026-2035 |
|
CAGR |
4.5% |
|
Base Year Market Size (2025) |
USD 41.5 billion |
|
Forecast Year Market Size (2035) |
USD 41.5 billion |
|
Regional Scope |
|
Plastic Waste Management Market Segmentation:
Recycling Technologies Segment Analysis
The chemical recycling segment is projected to capture 40% of the global plastic waste management market share by 2035, owing to its ability to handle mixed and contaminated plastics that aren't fit for mechanical recycling. This approach aligns with circular economic objectives by transforming waste plastics into feedstock for new materials. The European Chemicals Agency (ECHA) emphasizes the continuous regulatory support for chemical recycling technologies aimed at mitigating plastic pollution and reducing greenhouse gas emissions.
In April 2025, the International Finance Corporation (IFC) reported that nearly 80% of the 308,000 metric tons of new recycling capacity announced each year are from chemical recycling projects. By 2030, the capacity for chemical recycling is expected to cross 5 million metric tons, compared to less than 1 million in 2023. Most of this investment is currently led by the U.S. and Europe, but developing countries are also driving more interest. For instance, Greenback Recycling Technologies is set to build new recycling facilities in Latin America that use microwave technology to handle up to 90,000 metric tons of tough-to-recycle waste, including flexible plastic packaging. Also, PETRONAS Chemical Group aims to construct Asia’s biggest chemical recycling plant. Overall, the recycling movement is poised to double the revenues of key players during the forecast period.
Waste Collection & Sorting Segment Analysis
The mechanical sorting is projected to account for 28% of the global plastic waste management market share throughout the study period, primarily driven by the growing adoption of automation in both municipal and industrial waste management. Governments around the world are advocating enhanced sorting efficiency to improve recycling rates and lessen reliance on landfills. For instance, the U.S. Environmental Protection Agency (EPA) supports innovative sorting technologies through grants and guidelines aimed at achieving the National Recycling Goal of 50% by 2030. Additionally, the European Union’s Circular Economy Action Plan focuses on sustainable growth and also supports enhanced waste sorting methods to reduce contamination in recycled plastics, which in turn boosts the need for mechanical sorting systems.
End user Segment Analysis
The packaging segment is estimated to hold the largest market share during the study period. The robust e-commerce trade is increasing the use of plastic. The report by the United Nations Conference on Trade and Development (UNCTAD) reveals that the e-commerce trade crossed USD 27 trillion in 2022 and is expected to increase at a high pace in the years ahead. The sustainability trend in this sector is further expected to increase the use of recyclable packaging materials. The Reusable Packaging Association (RPA) discloses that the global reusable packaging market was calculated at USD 107 billion in 2023. Overall, high plastic packaging use is likely to accelerate the production and commercialization of smart waste management solutions.
Our in-depth analysis of the global plastic waste management market includes the following segments:
|
Segment |
Subsegment |
|
Recycling Technologies |
|
|
Collection & Sorting |
|
|
Treatment & Disposal |
|
|
Waste to Energy |
|
|
Polymer |
|
|
Source |
|
|
End user |
|

Vishnu Nair
Head - Global Business DevelopmentCustomize this report to your requirements — connect with our consultant for personalized insights and options.
Plastic Waste Management Market - Regional Analysis
Asia Pacific Market Insights
Asia Pacific plastic waste management market is expected to hold 40% of the global revenue share by 2035, mainly driven by swift economic development, stringent environmental regulations, and increasing investments in sustainable technologies. China is at the forefront of this adoption, supported by substantial government incentives and industrial reforms. Meanwhile, Japan and South Korea are concentrating on advancements in green chemistry, whereas India and Malaysia are enhancing their infrastructure and regulatory frameworks to optimize waste processing. The growth of public-private partnerships and increased funding for research and development further strengthen the demand for waste management solutions throughout the region.
China is anticipated to maintain the largest revenue share in the Asia Pacific market, propelled by significant government investments in circular economy strategies and environmental reforms. A report by Earth.Org discloses that the country consumes at least 20% or one-fifth of the world’s plastics. It is also the biggest producer and exporter of single-use and new (virgin) plastics. This highlights that to reduce the carbon footprint, the country is implementing strict regulations on plastic use, which is indirectly increasing the demand for waste management solutions. The modernization of the industrial sector, along with rigorous pollution control regulations, also enhances the demand for sophisticated chemicals used in plastic waste management. Furthermore, government incentives aimed at promoting green manufacturing, coupled with a diverse industrial foundation, support market growth.
Europe Market Insights
Europe is anticipated to account for 30% of the worldwide plastic waste management market share through 2035, due to the stringent regulations implemented by the European Chemicals Agency (ECHA) and ambitious sustainability objectives outlined in the European Green Deal. The U.K., Germany, and France are at the forefront of demand growth, fueled by increasing investments in green chemistry and circular economy initiatives. The government funding and research and development efforts concentrated on advanced recycling and sustainable chemical production are also propelling the trade of plastic waste management solutions.
Germany is projected to hold the largest revenue share of the Europe market throughout the study period, driven by its strong chemical manufacturing sector, sophisticated recycling infrastructure, and governmental policies that encourage sustainable chemical development. The country’s prominence in the adoption of a circular economy and its rigorous environmental regulations are fundamental to this market leadership. The European Environment Agency (EEA) in its report revealed that the plastic packaging recycling rate expanded to over 50% in 2022. This is positively driving the sales of waste management solutions. The same source also estimated that in 2022, the country produced 227 kg of plastic waste per person, which is much higher than the average of 186 kg per person in the 27 EU countries. Overall, investing in Germany is likely to double the revenues of plastic waste management solution manufacturers.
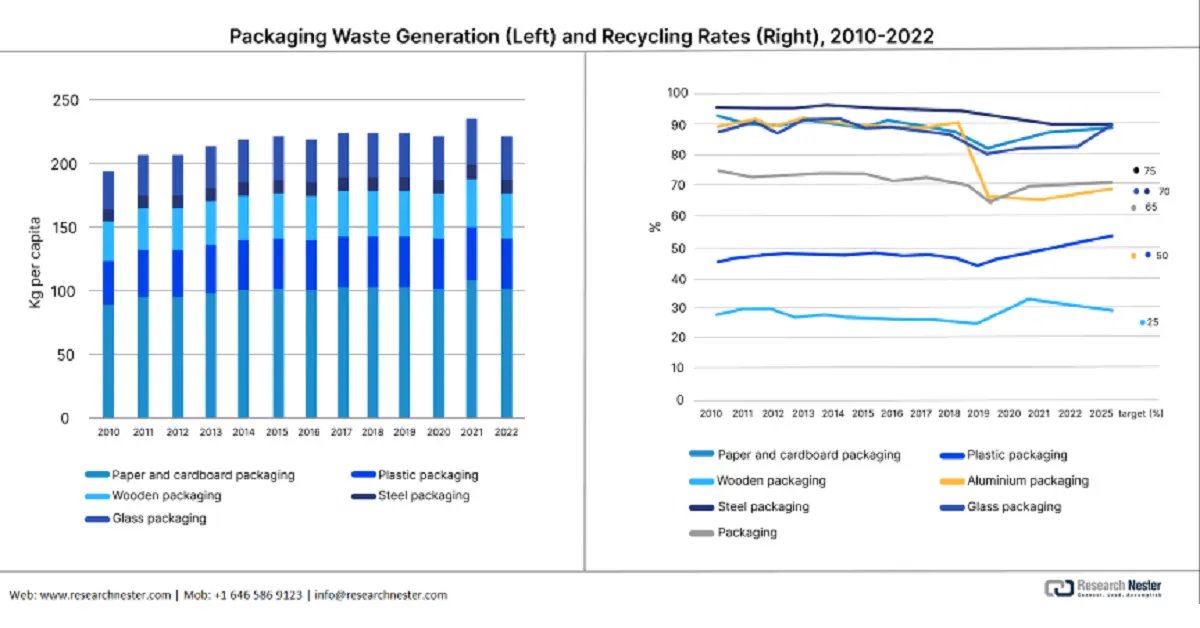
Source: EEA
North America Market Insights
North America plastic waste management market is anticipated to increase at a CAGR of 6.3% from 2026 to 2035. This growth is attributed to the rigorous environmental regulations imposed by the EPA and heightened government investments in sustainable chemical initiatives. The advancements in chemical recycling technologies, along with federal grants aimed at promoting clean energy chemical production, are further accelerating the adoption of plastic waste management solutions. Additionally, demand is bolstered by industrial mandates regarding chemical waste disposal and strategies focused on the circular economy.
The U.S. leads the sales of plastic waste management technologies owing to the mounting regulatory pressure and corporate sustainability targets. The growing public concern over plastic pollution is expected to create a lucrative environment for plastic waste management solution producers. The U.S. Plastics Pact Inc. reports that in 2023, U.S. Pact Activators produced nearly 5.57 million metric tons of plastics. Also, about 33% of all plastic packaging in the country, by weight, was made by these Activators. Most plastic waste is led by the packaging sector, especially single-use plastics used for food, drinks, and online shopping. This makes packaging the main focus for collection and recycling efforts. Overall, the U.S. is the most investment-worthy market for key players.
Key Plastic Waste Management Market Players:
- BASF SE
- Company Overview
- Business Strategy
- Key Product Offerings
- Financial Performance
- Key Performance Indicators
- Risk Analysis
- Recent Development
- Regional Presence
- SWOT Analysis
- Dow Inc.
- SABIC (Saudi Basic Industries)
- Mitsubishi Chemical Corporation
- LyondellBasell Industries
- Covestro AG
- LG Chem
- Reliance Industries Limited
- Mitsui Chemicals, Inc.
- Formosa Plastics Corporation
- INEOS Group
- Braskem S.A.
- Petronas Chemicals Group Berhad
- SABIC Innovative Plastics
- Queensland Chemical Industries
The plastic waste management market is primarily controlled by multinational companies that utilize innovative and sustainable strategies. Major industry players allocate significant resources towards green technologies, initiatives related to the circular economy, and expansion into various regions. Corporations such as BASF and Dow are at the forefront with their cutting-edge recycling solutions, whereas Asian companies, including Mitsubishi Chemical and LG Chem, concentrate on merging digital advancements with environmentally friendly product offerings to sustain their competitive edge and comply with changing global regulations.
The table below presents the top manufacturers in the market:
Recent Developments
- In April 2025, WM Intellectual Property Holdings, L.L.C. announced the opening of four new recycling and renewable natural gas (RNG) projects in the U.S. These projects are part of WM’s USD 3 billion plan to improve sustainability from 2022 to 2026, which includes building or upgrading 39 recycling facilities and adding 20 new RNG facilities owned by WM.
- In February 2024, Tetra Pak announced plans to invest in projects to improve recycling for carton packages in the European Union. These efforts support the goals of the EU’s proposed Packaging and Packaging Waste Regulation (PPWR).
- Report ID: 2770
- Published Date: Sep 09, 2025
- Report Format: PDF, PPT
- Explore a preview of key market trends and insights
- Review sample data tables and segment breakdowns
- Experience the quality of our visual data representations
- Evaluate our report structure and research methodology
- Get a glimpse of competitive landscape analysis
- Understand how regional forecasts are presented
- Assess the depth of company profiling and benchmarking
- Preview how actionable insights can support your strategy
Explore real data and analysis
Frequently Asked Questions (FAQ)
Plastic Waste Management Market Report Scope
Free Sample includes current and historical market size, growth trends, regional charts & tables, company profiles, segment-wise forecasts, and more.
Connect with our Expert


Copyright @ 2026 Research Nester. All Rights Reserved.
