Linolenic Acid Market Outlook:
Linolenic Acid Market size was valued at USD 3.3 billion in 2025 and is projected to reach USD 4.6 billion by the end of 2035, rising at a CAGR of 3.5% during the forecast period, from 2026 to 2035. In 2026, the industry size of linolenic acid is assessed USD 3.8 billion.
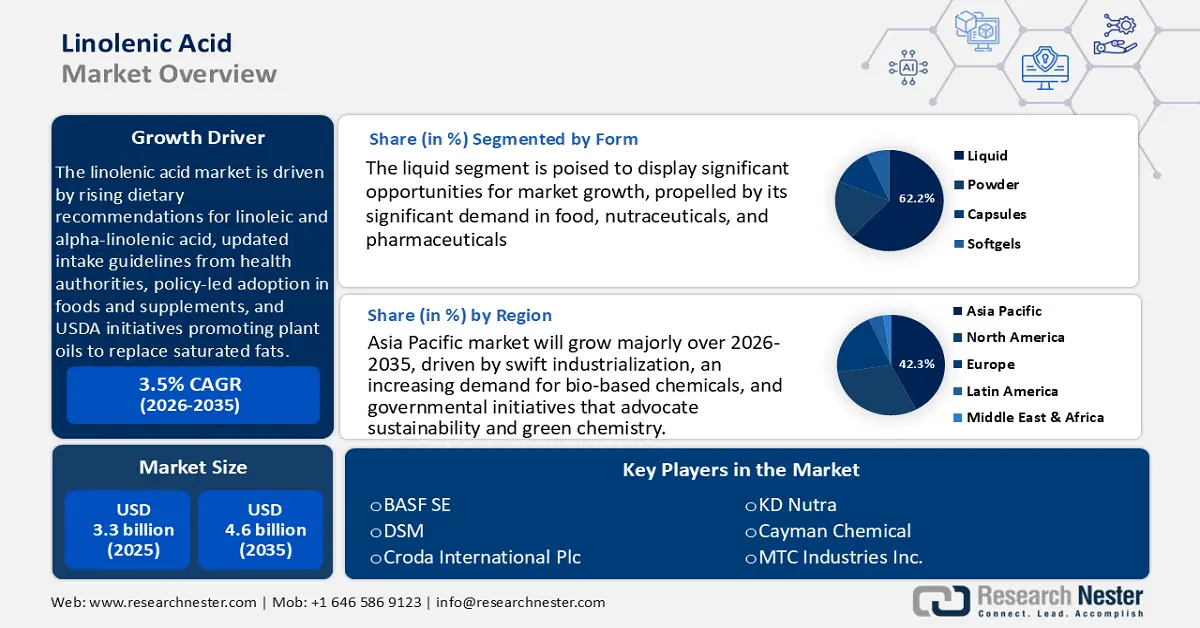
The global linolenic acid market is expected to grow with an upward trend during the projected years, primarily driven by the heightened dietary recommendations for linoleic and alpha-linolenic acid, as acknowledged by health authorities in the U.S. and Canada. The Dietary Reference Intakes by the U.S. Institute of Medicine suggest that the Adequate Intake (AI) of linoleic acid is 17 grams/day in men and 12 grams/day in women aged 1950 years. In the case of alpha-linolenic acid, the AI amounts to 1.6 grams/day for men and 1.1 grams/day for women of the same age group. These values are related to the average intake levels that are seen to sustain nutritional adequacy. This adoption, driven by the policy of conventional foods and dietary supplements, has prompted changes in labeling standards and has stimulated product reformulations within the domestic market. Similarly, USDA initiatives promote the use of plant oils such as soybean and canola, which further support the transition in the supply chain from saturated fats to polyunsaturated fatty acids.
Raw materials such as soybean, canola, and linseed oils are experiencing volatility in the Producer Price Index (PPI). The Producer Price Index (PPI) of fatty acids (WPU061403991) was 215.418 (Dec 2007 = 100) in August 2025, which shows that the pricing of raw fatty acid materials has continued to increase. This increment in PPI is attributable to the rise in input cost of the supply chain, largely due to the growing demand for certain fatty acids like alpha-linolenic acid, which is largely applied in food, nutraceutical, and cosmetic products, as it has proven beneficial health-wise. This pressure on the demand is driving not only price increases but also an increase in linolenic acid market demand in sustainable production of fatty acids, as industries are moving towards using more plant-based, polyunsaturated fats such as linolenic acid. Global capacity is on the rise through the establishment of extraction facilities in North America and Europe, with assembly lines being set up next to oilseed crushing plants. Federal Research, Development, and Demonstration (RDD) funding supports USDA Agricultural Research Service (ARS) research focused on optimized seed varieties and processing, although specific investment amounts across these initiatives remain aggregated. For instance, the USDA, through its Agricultural Research Service (ARS), is coming up with new varieties of soybean that have equal amounts of linolenic and linoleic acid. It is also investing in the processing research (e.g., testing extrusion pressures/temperatures) in order to retain the health attributes of these varieties. ARS has gone so far as to construct a small soybean crushing plant in Crookston, Minnesota, used to process in batches. The trade volume is steadily increasing, with imports of oilseeds for local crushing and exports of refined acids primarily directed towards food and supplement manufacturers.
Key Linolenic Acid Market Insights Summary:
Regional Highlights:
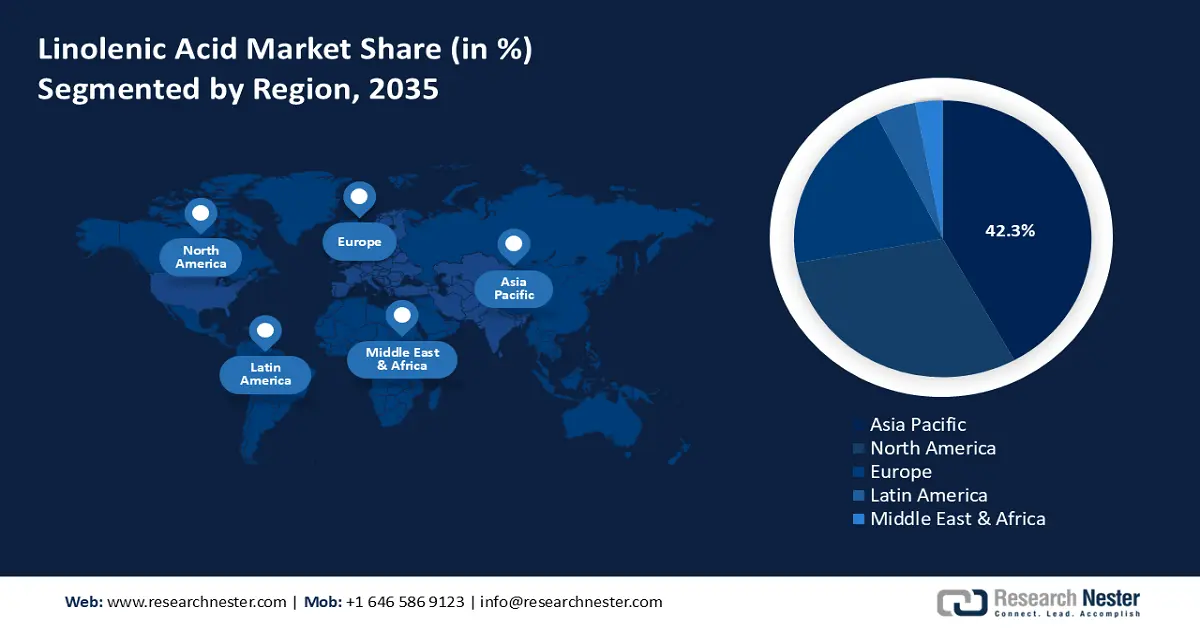
- By 2035, the Asia Pacific region is anticipated to secure nearly 42.3% of revenue in the Linolenic Acid Market, underpinned by swift industrialization and accelerating demand for bio-based chemicals.
- North America is projected to command about 30.4% share by 2035, supported by rising adoption of sustainable technologies and stricter environmental compliance.
Segment Insights:
- The liquid segment is poised to capture about 62.2% share of the Linolenic Acid Market by 2035, propelled by its significant demand in food, nutraceuticals, and pharmaceuticals.
- The functional foods and nutritional supplements segment is anticipated to represent around 47.3% share by 2035, stimulated by heightened health consciousness and growing preference for omega-3-rich diets.
Key Growth Trends:
- Technological innovations in chemical production
- Sustainability initiatives and green chemistry
Major Challenges:
- Regulatory compliance costs and linolenic acid market entry delays
- Trade barriers and export restrictions
Key Players: BASF SE, Dow Chemical Company, Mitsui Chemicals, Inc., Evonik Industries AG, Archer Daniels Midland Company, Shin-Etsu Chemical Co., Ltd., Lotte Chemical Corporation, UPL Limited, Petronas Chemicals Group Berhad, Solvay S.A., Mitsui & Co., Ltd., Celanese Corporation, Australian Industrial Chemicals, LG Chem Ltd., Jubilant Life Sciences Limited.
Global Linolenic Acid Market Forecast and Regional Outlook:
Market Size & Growth Projections:
- 2025 Market Size: USD 3.3 billion
- 2026 Market Size: USD 3.8 billion
- Projected Market Size: USD 4.6 billion by 2035
- Growth Forecasts: 3.5% CAGR (2026-2035)
Key Regional Dynamics:
- Largest Region: Asia Pacific (42.3% Share by 2035)
- Fastest Growing Region: Asia Pacific
- Dominating Countries: United States, China, Japan, Germany, India
- Emerging Countries: Brazil, Indonesia, Malaysia, South Korea, Thailand
Last updated on : 30 September, 2025
Linolenic Acid Market - Growth Drivers and Challenges
Growth Drivers
- Technological innovations in chemical production: Improvements in chemical manufacturing technologies, including more environmentally friendly options and chemical recycling, are favorably impacting linolenic acid market demand. For example, the implementation of cutting-edge catalytic technologies has enhanced production efficiency by 20%, resulting in cost reductions and sustainable development. These advancements allow producers to manufacture linolenic acid more effectively, addressing the increasing need for sustainable chemicals. Additionally, the development of microbial and enzymatic synthesis has significantly enhanced the production of linolenic acid. For example, the fermentation of microorganisms using genetically engineered strains has shorter production cycles, is more stable, and is less environmentally harmful compared to conventional extraction methods. These inventions play an important role in expanding the economic, high-quality linolenic acid.
- Sustainability initiatives and green chemistry: The global movement towards sustainability is increasing the need for renewable chemicals, such as linolenic acid. This expansion is driven by consumer inclinations for environmentally friendly products and regulatory incentives that encourage the adoption of renewable chemicals. In addition, the Green Chemistry Challenge by the U.S. Environmental Protection Agency shows the importance of major environmental benefits that green chemical technologies have achieved. These innovations have saved 830 million pounds of toxic chemicals and solvents annually, conserved 21 billion gallons of water, and avoided the emission of 7.8 billion pounds of carbon dioxide equivalents into the atmosphere. These quantifiable effects highlight the increased regulatory and linolenic acid market pressure on renewable and sustainable chemicals, such as linolenic acid, that are compatible with the green chemistry principles and the minimization of the use of petrochemical inputs. These environmental and economic stimuli are increasingly pushing towards the use of linolenic acid in fields such as food, pharmaceuticals, and cosmetics.
- Economic scale & environmental displacement: The U.S. biobased products industry has an escalating economic scale, and this enhances the demand for linolenic acids when it forms bio-based portfolios. A USDA Economic Impact Analysis shows that the biobased products industry added USD 470 billion to the US economy and provided 4.6 million jobs (direct, indirect, and induced effects). Notably, this industry even replaced about 9.4 million barrels of oil yearly, besides minimizing the amount of greenhouse gases by an estimated 12.7 million metric tons of CO2 equivalents per year. Linolenic acid as a renewable chemical feedstock is better off when regulatory regimes have tougher pricing of carbon and carbon emission levels, and with these numbers of environmental displacements, it will be economical and more policy-wise acceptable.
Global linolenic acids import/export
Oleic, linoleic, or linolenic acids, their salts, exports by country, 2023
|
Country |
Export Value (USD thousands) |
Quantity (kg) |
|
Italy |
48,589.97 |
17,640,100 |
|
China |
33,570.96 |
17,370,100 |
|
European Union |
28,872.41 |
6,746,640 |
|
India |
19,677.19 |
8,999,060 |
|
United States |
15,475.54 |
N/A |
|
Malaysia |
14,759.26 |
7,439,460 |
|
Germany |
11,701.41 |
1,557,150 |
|
France |
11,188.70 |
2,214,900 |
|
United Kingdom |
8,228.53 |
1,646,020 |
Source: worldbank.org
Oleic, linoleic or linolenic acids, their salts imports by country, 2023
|
Country/Region |
Import Value (USD) |
Quantity (kg) |
|
Germany |
36,338.79 |
13,641,000 |
|
European Union |
23,280.35 |
8,259,810 |
|
France |
13,392.93 |
4,118,710 |
|
Spain |
10,808.14 |
N/A |
|
China |
10,634.07 |
3,685,090 |
|
Netherlands |
10,444.87 |
3,233,770 |
|
United States |
8,195.79 |
N/A |
|
Japan |
7,424.48 |
3,018,110 |
Source: worldbank.org
Challenges
- Regulatory compliance costs and linolenic acid market entry delays: Regulatory compliance continues to pose a significant challenge for suppliers of linolenic acid, particularly in the European Union and the U.S. The European Food Safety Authority (EFSA) mandates comprehensive scientific assessments for health claims, which can take between 20 and 25 months and incur significant costs for each application. Consequently, this leads to postponed product launches and increased compliance expenses. In 2023, substantial number of omega-3 product applications experienced delays due to insufficient documentation or the introduction of new safety protocols.
- Trade barriers and export restrictions: Access to raw materials necessary to produce linolenic acid faces obstacles due to trade restrictions, particularly from countries abundant in resources. The European Chemical Industry Council indicated that in 2022, 43% of chemical manufacturers within the EU encountered rising costs attributed to double pricing and export taxes imposed on vegetable oils. Such policies elevate production expenses and diminish the competitive standing of downstream producers.
Linolenic Acid Market Size and Forecast:
| Report Attribute | Details |
|---|---|
|
Base Year |
2025 |
|
Forecast Year |
2026-2035 |
|
CAGR |
3.5% |
|
Base Year Market Size (2025) |
USD 3.3 billion |
|
Forecast Year Market Size (2035) |
USD 4.6 billion |
|
Regional Scope |
|
Linolenic Acid Market Segmentation:
Form Segment Analysis
The liquid segment is expected to account for about 62.2% of the linolenic acid market share by 2035, propelled by its significant demand in food, nutraceuticals, and pharmaceuticals. Liquid linolenic acid is preferred due to its user-friendliness, enhanced absorption, and suitability for use in fortified food and supplement applications. Increasing consumer awareness regarding the health benefits of omega-3 further bolsters this trend. The use of this in dietary supplements and functional beverages is rapidly increasing. Ongoing research and development efforts are also improving the quality and stability of liquid formulations.
Flaxseed oil is a plant-based oil derived from flax seeds that is highly rich in alpha-linolenic acid (ALA), an essential omega-3 fatty acid. A peer-reviewed publication in the Journal of Food Science and Technology reveals that flaxseed oil has ALA of its total fatty acids of between 39.90% to 60.42% and is therefore one of the richest sources of plant-based omega-3s. The use of liquid-form ALA in nutraceuticals and functional foods is one of the reasons that drives demand towards the products in the form of liquids. On the same note, Chia oil is an enriched oil that is soluble in chia seeds and is known to have high levels of ALA and antioxidant effects. A study in Food Production, Processing and Nutrition has found the chia seed oil to contain about 61.1% ALA, which increases its usefulness as a cardiovascular and metabolic health supplement. The increasing consumption of chia oil in nutritional supplements and health-promotional preparations contributes further to the increase of the liquid linolenic acid segment.
Application Segment Analysis
The increasing consumer interest in functional foods and nutritional supplements is anticipated to represent around 47.3% of the linolenic acid market by 2035. This expansion is driven by heightened health consciousness and the rising popularity of diets rich in omega-3. Linolenic acid is being extensively integrated into dairy products, baked goods, and beverages to improve their nutritional profile. Applications for functional foods are particularly on the rise in areas such as North America and Europe. This trend signifies a notable transition towards consumption that prioritizes preventive health and wellness.
Dairy alternatives, such as plant-based milk products, have experienced higher demand with the growing interest of consumers in vegan and lactose-free products. The plant-based alternatives occupy a potentially substantial portion of the dairy market. The production tendency of plant-based dairy alternatives expanded with an expected rate of over 18.5% in 2023. Fortified beverages are enriched with alpha-linolenic acid and omega-3 fatty acids, which are growing to fulfil the increasing health awareness in the linolenic acid market, and scientific publications reveal their nutritional value and growing consumption patterns. These segments play a significant role in the expansion of the segment of Food & Nutrition subsegment by meeting the needs of health-conscious individuals who consider functional nutrition and plant-based nutrition as their priorities.
Distribution Channel Segment Analysis
Online distribution channel is one of the important channels in the linolenic acid market, expected to grow substantially by 2035. U.S. Census Bureau projects that in the second quarter of 2025, 16.3% of all U.S. retail sales would be e-commerce sales, totaling USD 304.2 billion. This is an increment of 5.3% as compared to the same quarter last year. Online shopping has expanded due to the preference people have towards online shopping, convenience, and easy product comparison. The demand for linolenic acid products is likely to increase as the number of consumers using online platforms to buy health supplements and functional foods increases, which will increase the linolenic acid market share of the online distribution channel.
Our in-depth analysis of the linolenic acid market includes the following segments:
|
Segments |
Subsegments |
|
Form |
|
|
Application |
|
|
Source
|
|
|
Distribution Channel |
|

Vishnu Nair
Head - Global Business DevelopmentCustomize this report to your requirements — connect with our consultant for personalized insights and options.
Linolenic Acid Market - Regional Analysis
Asia Pacific Market Insights
Asia Pacific region is anticipated to account for nearly 42.3% of the linolenic acid market revenue by the year 2035. The factors driving this growth include swift industrialization, an increasing demand for bio-based chemicals, and governmental initiatives that advocate sustainability and green chemistry. Enhanced research and development expenditures, along with regulatory backing in nations such as Japan and China, are propelling innovation and the uptake of linolenic acid products within the pharmaceutical, cosmetic, and food industries. Additionally, according to the World Integrated Trade Solution (WITS), the World Bank, Malaysia had exported around 7,439 tons (7,439,460 kg) of oleic, linoleic, and linolenic acids in 2023 with an export revenue of around USD 14.76 million exported in salts. Meanwhile, the imports of these acids to Indonesia were mostly imported by its neighbors, with India (450 tons) (1374980kg) and China (718 tons) (718251kg) among the top importers. These inter-business transactions are indicative of the intra-regional integration of demand and supply chains of bio-based fatty acids in the Asia Pacific as a result of the increasing industrial use of these products in the pharmaceutical, cosmetics, and food sectors.
China’s linolenic acid market is poised to lead the region, with the largest share by 2035, propelled by its extensive industrial infrastructure, significant government investment, and regulatory policies that promote innovations in green chemistry. This growth is further supported by strategic investments in sustainable chemical technologies and the incorporation of linolenic acid into the pharmaceutical and food industries. Furthermore, through bioengineering and sustainable agriculture, China has been able to achieve a lot in improving the production and accumulation of linoleic acid and alpha-linolenic acid. The genetic engineering of crops to enhance ALA content has become a significant solution to the enhancement of the nutritional value, and these sustainable methods enable environmentally-friendly production, which can meet the demands of the whole globe. The attempts demonstrate the high interest of the country in creating an eco-friendly and efficient way of making the necessary fatty acids, which helps the country to keep its leading position on the bio-based chemical market at the international level.
The linolenic acid market in India is likely to grow with the fastest CAGR over the forecast period from 2026 to 2035, owing to the growing health awareness and demand for omega-3 fatty acid supplements and functional foods. The increasing growth is stimulated by the high population of the nation, urbanization, and the increased disposable income, which enhances the consumption of fatty acids in the diet, such as alpha-linolenic acid (ALA). India is advantageous in the production of major raw materials like flaxseed and soybean oils domestically, as well as the rising imports to address the increasing linolenic acid market demands. As per the National Nutrition Monitoring Bureau and other authoritative agencies, the average visible fat intake in Indian families comes to around 15 grams per unit of consumption per day, which is less than the advised 20 grams. The dietary factors of the Indians consist of plant-based fats that are high in linoleic acid (n-6 PUFA) and extremely low in alpha-linolenic acid (n-3 PUFA), which is estimated at 20-50mg/day. This plays with an imbalance in fatty acids, and India has a double burden of malnutrition and non-communicable diseases, where 53% of deaths are because of NCDs. The rates of obesity have been on the rise, and the number of obese men has grown, increasing from 0.4 million to 9.8 million, and the number of obese women has grown from 0.8 million to 20 million. The distorted n-6/n-3 ratio and low overall fat consumption indicate that dietary balancing is necessary to enhance the health of the population.
North America Market Insights
The North American linolenic acid market is projected to account for 30.4% revenue share over the projected years. The growth drivers encompass a rising demand for bio-based chemicals within the pharmaceutical and food industries, bolstered by rigorous environmental regulations and governmental investments in sustainable technologies. Government initiatives that encourage sustainability and ensure chemical safety are driving linolenic acid market acceptance in multiple sectors. The use of plant-based oils that contain high levels of alpha-linolenic acid, such as soybean and flaxseed oils, has continued to rise in the North American region. This development goes in line with a wider nutritional reform towards healthier lipid profiles, driven by increasingly high consumer levels of awareness and dietary advice in favor of omega-3 fatty acids. Increased consumption of these oils has increased the intake of alpha-linolenic acid in the diet, which helps prevent cardiovascular disease and curb inflammation. In addition, according to the U.S Environmental Protection Agency (EPA), there are still ongoing regulatory incentive programs that encourage the production of bio-based chemicals, and this indirectly encourages the production and use of biobased fatty acids, such as linolenic acid, which will facilitate a greener chemical industry environment within North America.
U.S. linolenic acid market is expected to dominate the North American region by 2035, attributed to the crucial role played by governmental assistance in enhancing the linolenic acid market. Federal investment in chemical safety and innovation accounts for approximately 3.4% of the industrial innovation budget, fostering environmentally friendly manufacturing practices. Additionally, the American Chemistry Council (ACC) enhances the development of bio-based plastics by cutting the use of fossil-based substances and enhancing the application of recycled and renewable feeds. The principles of ACC encourage the responsible production of bio-based plastics to ensure that U.S. companies will achieve sustainability targets, such as the goal of making 100% of U.S. plastic packaging reusable, recyclable, or recoverable by 2040, and one that 30% of plastic packaging will contain recycled material by 2030. Similarly, the U.S BioPreferred Program, managed by the USDA, promotes federal agencies and businesses to acquire and utilize biobased products to encourage market demand and creativity. The voluntary labelling of the program and federal purchasing needs motivate the production and utilization of renewable and bio-based chemicals, including linolenic acid, which leads to expansion in the U.S. linolenic acid market via sustainable production and purchase plans. These initiatives enhance production efficiency, minimize environmental impact, and contribute to market expansion.
The linolenic acid market in Canada is projected to grow steadily during the forecast years, mainly led by flaxseed production, which is a large source of alpha-linolenic acid. Canada is exhibiting high agricultural potential in flaxseed production, with a high of 257,974 metric tons to date in 2024, which is a consistent output to sustain both domestic processing and export demand. Flaxseed is also one of the main sources of alpha-linolenic acid, and the consistent production of the product in Canada is important in terms of providing a stable supply to the nutraceutical, food, and bio-based chemical industries. Continued production of flax seeds strengthens Canada as a major producer of the linolenic acid value chain. The scientists of the Canadian Grain Commission claimed that the oil composition of Canada Western Brown Flaxseed was 44.8% and that alpha-linolenic acid (C18:3) was 55.8% of the oil. These values make Canada a major producer of oil rich in ALA to meet the increasing demand in the nutraceutical, functional foods, and bio-based chemical industries. The export trends, international price of oilseeds, and sustainable agriculture investment also affect linolenic acid market dynamics.
Canada Agriculture Production: Canola from 2020 to 2024
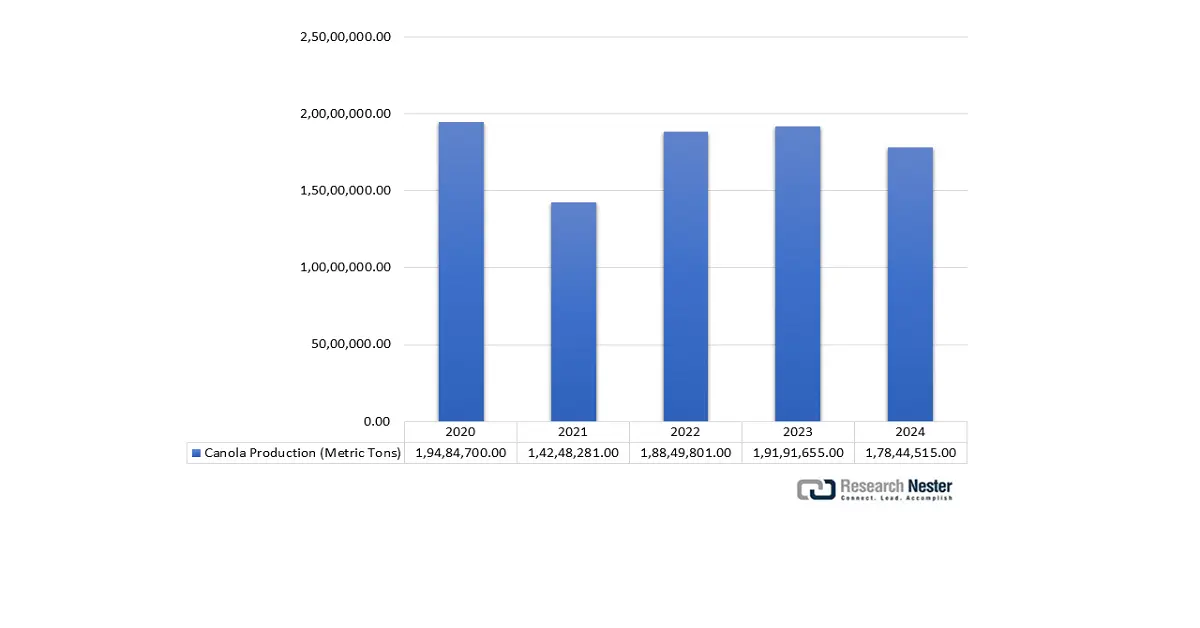
Source: CEIC
Europe Market Insights
Europe is anticipated to hold 20.6% of the linolenic acid market revenue by the year 2035, primarily fueled by stringent environmental regulations imposed by the European Chemicals Agency (ECHA) and a growing commitment to sustainable chemical practices in line with the European Green Deal. The demand for bio-based linolenic acid chemicals is increasing across the food, pharmaceuticals, and cosmetics industries, bolstered by innovation grants and public-private partnerships facilitated by Horizon Europe. New stricter regulations by the European Chemicals Agency (ECHA) and large-scale sustainability efforts by the European Green Deal are the primary causes of this growth. The European Commission is spending more than €7.3 billion via its work programme Horizon Europe 2025 to enhance research, innovation, and competitiveness in all fields, including sustainable bioeconomy and food production. Having allocated funds specifically on food, bio economy, natural resources, agriculture, and environment, this funding will aid in the development of sustainable fatty acid production, like linolenic acid, which encourages the use of greener alternatives and less reliance on traditional sources. This project is in line with the increasing market demand in the European linolenic acid market of sustainable and plant-based omega-3 fatty acids, which drives innovation and competitive development in the market.
Key Linolenic Acid Market Players:
- BASF SE
- Company Overview
- Business Strategy
- Key Product Offerings
- Financial Performance
- Key Performance Indicators
- Risk Analysis
- Recent Development
- Regional Presence
- SWOT Analysis
- Dow Chemical Company
- Mitsui Chemicals, Inc.
- Evonik Industries AG
- Archer Daniels Midland Company
- Shin-Etsu Chemical Co., Ltd.
- Lotte Chemical Corporation
- UPL Limited
- Petronas Chemicals Group Berhad
- Solvay S.A.
- Mitsui & Co., Ltd.
- Celanese Corporation
- Australian Industrial Chemicals
- LG Chem Ltd.
- Jubilant Life Sciences Limited
The global linolenic acid market is characterized by intense competition, dominated by significant multinational companies mainly from the USA, Europe, and Asia. Leading firms concentrate on strategic investments in sustainable production technologies, expanding their capacities, and diversifying geographically to uphold their linolenic acid market dominance. Partnerships and research and development initiatives aimed at eco-friendly product lines are crucial for growth in response to rising regulatory and consumer expectations. The table below enumerates the top 15 global manufacturers of linolenic acid, outlining their market shares and countries of origin. This information offers valuable insights into regional production capabilities and the principal players in the industry.
Top Global Linolenic Acid Manufacturers: Market Share & Country of Origin
Recent Developments
- In May 2025, Bioriginal Food & Science Corp. introduced the first non-GMO high GLA borage oil in the industry with a 25% GLA concentration, the highest and only non-GMO source of GLA in the market, to increase GLA content. It is an innovation of the proprietary selective breeding program of Bioriginal, which takes advantage of high GLA potency and crop yield without genetic modification. The new borage oil has unparalleled purity and bioavailability, which places the product in the human or pet nutrition, such as beauty, joint health, and inflammation support. Oil is grown in the best conditions of the Canadian prairies and produced in a vertically integrated, closed-loop system, which is sustainable and gives quality control. This innovation is a solution to the problem of supply inconsistencies and is the answer to increased consumer demand based on clean-label and natural ingredient-based products.
- Report ID: 2936
- Published Date: Sep 30, 2025
- Report Format: PDF, PPT
- Explore a preview of key market trends and insights
- Review sample data tables and segment breakdowns
- Experience the quality of our visual data representations
- Evaluate our report structure and research methodology
- Get a glimpse of competitive landscape analysis
- Understand how regional forecasts are presented
- Assess the depth of company profiling and benchmarking
- Preview how actionable insights can support your strategy
Explore real data and analysis
Frequently Asked Questions (FAQ)
Linolenic Acid Market Report Scope
Free Sample includes current and historical market size, growth trends, regional charts & tables, company profiles, segment-wise forecasts, and more.
Connect with our Expert


Copyright @ 2026 Research Nester. All Rights Reserved.
