Industrial Valves Market Outlook:
Industrial Valves Market size was valued at USD 88.36 billion in 2025 and is projected to reach USD 133.29 billion by the end of 2035, rising at a CAGR of 4.4% during the forecast period, i.e., 2026-2035. In 2026, the industry size of industrial valves is assessed at USD 92.07 billion.
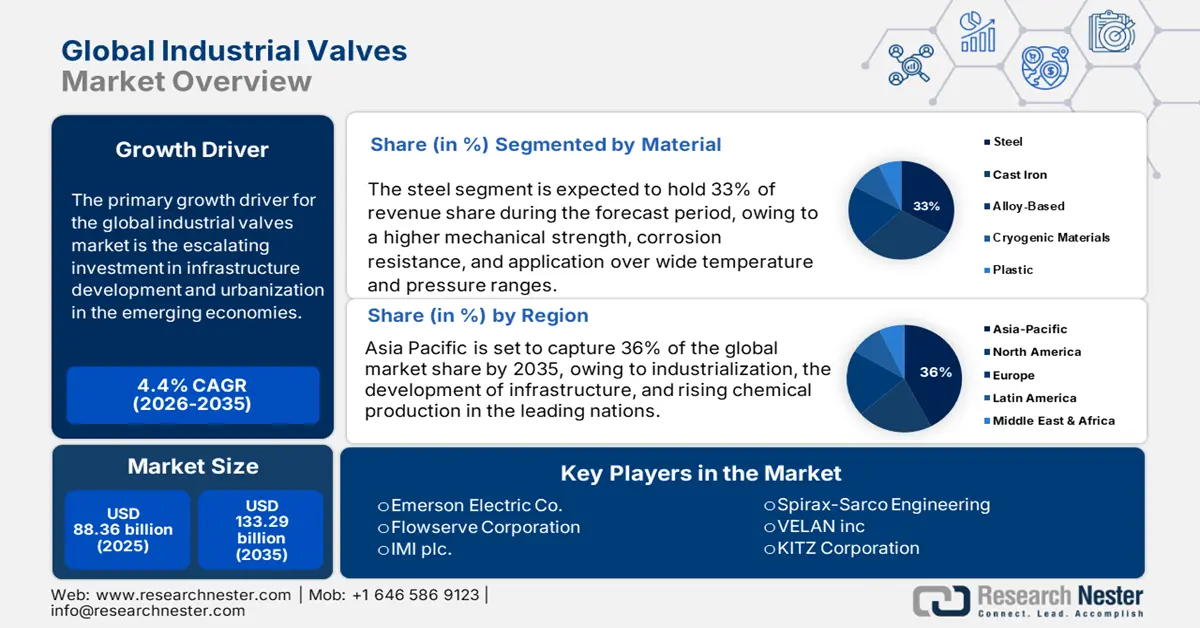
The primary growth driver of the industrial valve market is escalating investment in infrastructure development and urbanization in the emerging economies. Large-scale government plans, such as India's "Gati Shakti" National Master Plan and "Make in India," fuel the demand for industrial valves through increased manufacturing, transportation, and water management initiatives. As observed by India's Ministry of Statistics and Program Implementation (MoSPI), industrial output is expected to grow by more than 5.80% in 2023-24, driving growth in oil refining, electricity generation, and municipal water markets, which are large end-users of industrial valves. Additionally, according to the UN, 68% of the world's population will reside in cities by 2050, with world populations estimated to grow by 2.5 billion by 2050. There is a growing demand for advanced fluid control systems in water treatment and power infrastructure, which is fueling the growth of the market.
Key Industrial Valves Market Insights Summary:
Regional Highlights:
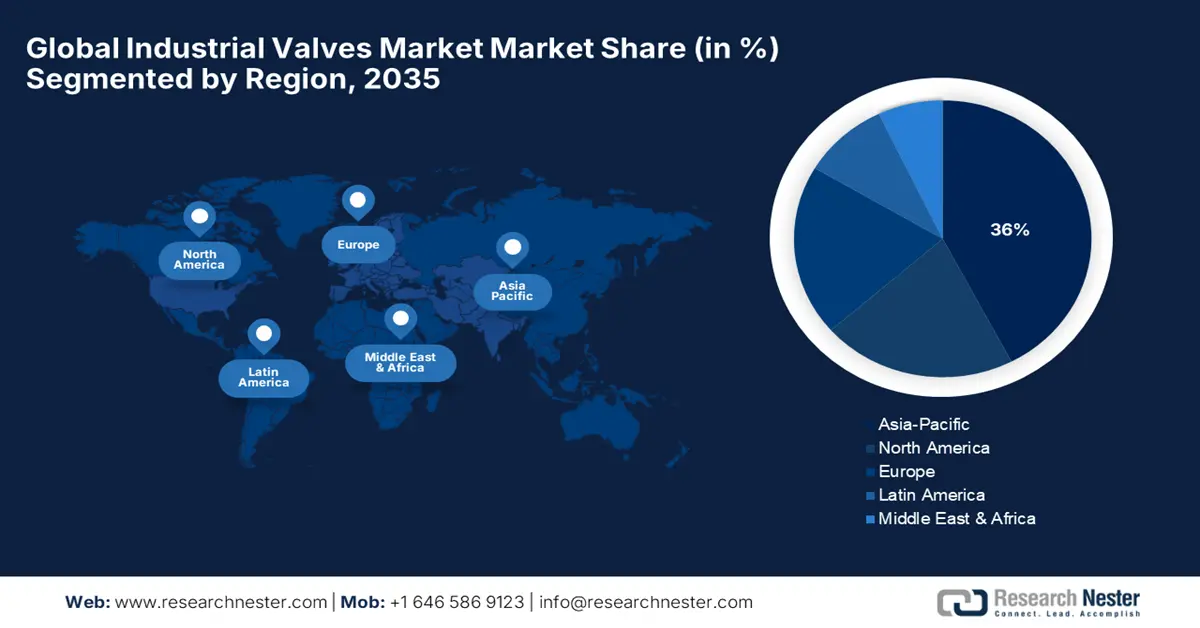
- Asia Pacific is projected to capture 36% share by 2035, owing to rapid industrialization, infrastructure investments, and rising demand in water, power, and pharmaceutical sectors.
- North America is expected to hold 18% share by 2035, driven by strong industrial demand, pipeline and refinery upgrades, and adoption of smart valve technologies.
Segment Insights:
- Steel segment is projected to generate 33% of total revenue by 2035, driven by high mechanical strength, corrosion resistance, and broad industrial applicability.
- Valves sized 1–6″ segment is expected to account for 35.6% share, propelled by midstream infrastructure upgrades and increased adoption in chemical, water, oil & gas, and power industries.
Key Growth Trends:
- Expansion of oil & gas and energy sectors
- Water & wastewater infrastructure development
Major Challenges:
- Pricing pressures from raw material volatility and compliance costs
- Regulatory barriers and market access limitations
Key Players: Emerson Electric Co., Flowserve Corporation, IMI plc, Spirax-Sarco Engineering, Velan Inc., KITZ Corporation, Cameron (a Schlumberger company), Metso Outotec, Parker Hannifin Corporation, Larsen & Toubro Limited, LG Industrial Systems Co., SMC Corporation, Velosi Engineering, Aurecon Group, Kyowa Valve Co., Ltd.
Global Industrial Valves Market Forecast and Regional Outlook:
Market Size & Growth Projections:
- 2025 Market Size: USD 88.36 billion
- 2026 Market Size: USD 92.07 billion
- Projected Market Size: USD 133.29 billion by 2035
- Growth Forecasts: 4.4% CAGR (2026-2035)
Key Regional Dynamics:
- Largest Region: Asia Pacific (36% Share)
- Fastest Growing Region: Asia Pacific
- Dominating Countries: China, United States, Germany, Japan, India
- Emerging Countries: Brazil, South Korea, Mexico, Indonesia, Australia
Last updated on : 9 September, 2025
Industrial Valves Market - Growth Drivers and Challenges
Growth Drivers
- Expansion of oil & gas and energy sectors: The increasing investments in upstream exploration, LNG infrastructure, and refinery upgrades fueled by demand are driving the market expansion. According to the U.S. Energy Information Administration (EIA), U.S. gross exports of liquefied natural gas are forecasted to be 12 billion cubic feet (bcf) per day in 2024, 15 bcf per day in 2025, and 16 bcf per day in 2026. Shale formations accounted for roughly 78% (37.87 trillion cubic feet) of all dry natural gas production in the United States in 2023. Additionally, aging refineries in regions like the U.S. Gulf Coast and Europe are replacing outdated valves to comply with stricter EPA emissions standards, with valve replacement and refinery maintenance costs. These trends underscore how energy sector growth directly propels industrial valve demand.
- Water & wastewater infrastructure development: The water & wastewater infrastructure development is a key driver of the industrial valves market, as per the World Bank, the global investments in water systems are projected to exceed $1.37 trillion by 2030. The U.S. Bipartisan Infrastructure Law allocated more than $50 billion for water infrastructure upgrades, including smart valves for leak detection and pressure management. India’s Jal Jeevan Mission provided more than 10.76 Crore (55.62%) of rural families had regular access to tap water in sufficient quantities and of the recommended quality as of December 2022. The global smart water valve market is driven by demand for automated and IoT-enabled valves in municipal systems. Additionally, aging water networks in Europe require urgent valve replacements. The new EIB Group Water Resilience Program has been developed in consultation with and in harmony with the European Commission's Water Resilience Strategy and is expected to mobilize €40 billion of global water investments by 2027.
Demand Analysis of the Industrial Valves Market
Top Pressure Reducing Valves Exporters in 2023
|
Exporter |
Trade Value (USD millions) |
Quantity (Kg) |
|
European Union |
742,856.04 |
15,410,600 |
|
Germany |
546,592.02 |
7,035,610 |
|
United States |
484,055.22 |
8,448,200 |
|
China |
386,070.55 |
26,786,700 |
|
Italy |
361,436.05 |
11,500,800 |
|
Mexico |
213,381.68 |
13,466,400 |
|
United Kingdom |
181,889.23 |
- |
|
Korea, Rep. |
173,482.12 |
3,486,560 |
|
Japan |
133,947.23 |
1,848,370 |
|
India |
89,608.60 |
3,921,890 |
Source: WITS
Challenges
- Pricing pressures from raw material volatility and compliance costs: Raw material price fluctuation and compliance costs are exerting strict pricing pressures on industrial valve manufacturers, particularly stainless steel and special alloys production costs. Steel prices across the globe increased as a result of shortages (WTO). Both of them overcome the spirit of pricing flexibility, especially for SMEs. Several U.S. manufacturers in 2023 postponed expansion plans, unable to pass on rising costs without impacting customer prices, thereby suppressing overall market growth.
- Regulatory barriers and market access limitations: Stringent environmental and safety regulations are still a hindrance for industrial valve suppliers to pursue international growth. In 2022, China's Ministry of Ecology and Environment (MEE) enhanced chemical safety regulations, inducing another six months on average for valve certifications decline in revenue for affected companies. On the contrary, domestic suppliers like Emerson Electric enhanced market share in 2023 with the introduction of low-emission technologies. However, higher compliance costs are a hindrance to small firms. WTO data show non-tariff barriers, specifically regulatory compliance, have become the most significant industrial value trade barrier since 2021.
Industrial Valves Market Size and Forecast:
| Report Attribute | Details |
|---|---|
|
Base Year |
2025 |
|
Forecast Year |
2026-2035 |
|
CAGR |
4.4% |
|
Base Year Market Size (2025) |
USD 88.36 billion |
|
Forecast Year Market Size (2035) |
USD 133.29 billion |
|
Regional Scope |
|
Industrial Valve Market Segmentation:
Material Segment Analysis
Steel is expected to continue to be the dominant material for valves, generating nearly 33% of the total revenue by 2035 due to its higher mechanical strength, corrosion resistance, and application over wide temperature and pressure ranges, in which steel remains the most preferred option in chemical, oil & gas, and power industries. Stainless-steel valves are meant for use in highly corrosive chemical environments and pressurized systems. According to the Japan Ministry of Economy, Trade and Industry (METI), demand for high-grade steel valves was 23.49 million tons in 2022, as modernizations have prioritized refineries and petrochemical plants. The steel production landscape in Japan further strengthens this segment by minimizing price volatility and lessening dependency on imports.
Size Segment Analysis
The valves sized 1–6″ segment is expected to account for 35.6% of total revenue and maintain the largest market share until the year 2035. These mid-range valves find maximum application in chemical processing, water treatment, oil and gas, and power generation industries due to their balance between flow capacity and ease of integration with standard pipeline systems. Their usability across both manual adjustments and automated control systems makes them essential in operational workflows. This growing reliance is largely driven by midstream infrastructure upgrades and increased construction activity surrounding chemical storage facilities. As operations become more complex and safety standards tighten, such technologies are no longer optional but integral to efficient and compliant execution. These factors collectively underscore their rising importance in industrial environments.
Type Segment Analysis
The ball valve segment is expected to account for 35.6% of total revenue and maintain the largest market share until the year 2035. Its flexibility, tough construction, and sealing capabilities at high-pressure and high-temperature conditions, ball valves the most prevalent industrial valve type. Ball valves are commonly used within the oil & gas industry, chemicals, water treatment, and power generation. Ball valves require little maintenance, can shut off quickly, and have a long service life. Additionally, ball valves are adaptable to automation, which can aid in capitalizing on their largest share of the market.
Our in-depth analysis of the global industrial valve market includes the following segments:
| Segment | Sub-Segments |
|
Type |
|
|
Material |
|
|
Size |
|
|
End user |
|

Vishnu Nair
Head - Global Business DevelopmentCustomize this report to your requirements — connect with our consultant for personalized insights and options.
Industrial Valve Market - Regional Analysis
Asia Pacific Market Insights
The industrial valves market in Asia-Pacific (APAC) is experiencing robust growth, driven by rapid industrialization, energy demand, and infrastructure investments. The region is set to capture 36% of the global market share by 2035, with China and India leading sales volumes. The water & wastewater sector is another key driver, with millions of valves annually deployed under initiatives like China’s Sponge Cities and India’s Jal Jeevan Mission. Additionally, power plant expansions (coal, renewables) and pharmaceutical growth further boost demand. Smart valve adoption is rising and supported by IoT integration in Japan and South Korea.
The industrial valves market in China is growing rapidly, driven by massive energy projects, water infrastructure upgrades, and manufacturing expansion. The country accounts for over 30% of APAC's valve demand, with major sales annually for oil & gas pipelines. The chemical industry fuels demand for corrosion-resistant valves, and smart valve adoption is rising with government-backed IoT integration. Strict environmental regulations also push upgrades to low-emission valves.
India assigned Rs. 3.6 Lakh Crore to the estimated outlay of Jal Jeevan Mission as part of the 'Har Ghar Jal' program over five years from 2019-2024. The 15th Finance Commission has identified drinking water supply and sanitation as a national priority and has graced the Rural Local Bodies / Panchayat Raj Institutions (RLBs/PRIs) with funds amounting to Rs. 2.36 lakh Crore from 2021-22 to 2025-26. Consequently, 60% of the above fund, i.e, Rs. 1.42 lakh Crore has been provided as Tied Grants, use exclusively only for drinking water, rainwater harvesting, and sanitation & maintenance of open-defecation free (ODF) village. This unprecedented level of investment in rural areas all over the country is leading to increased economic activities, an enhanced rural economy, and enhanced job opportunities for rural communities. This is a step of progress to ensure a potable water supply with improved sanitation in villages towards transforming these villages into 'WASH enlightened ' villages. As per the Government of India, in 2022-23, so far, released total of Rs 22,975.34 Crore has been released to 21 eligible States for implementing Jal Jeevan Mission, financial year 2022-23.
North America Market Insights
The industrial valves market in North America is set to capture 18% of the global market share by 2035, and it is experiencing steady growth, driven by strong demand across industries such as oil & gas, chemicals, power generation, and water treatment. The North American industrial valve market will benefit from a highly developed manufacturing base and considerable investment in infrastructure, such as pipeline and refinery upgrades. Growing technologies such as smart valves and automated flow control only add to the impetus for industrial valve adoption. The growing emphasis on sustainability among businesses and the effects of environmental regulations affecting energy usage, corrosion reduction, and improved efficiencies will further aid the market growth in the long term.
The U.S. will easily dominate the North American market due to the primarily large-scale oil & gas production, petrochemical complexes, and water infrastructure projects. Factors such as the government's focus and strategy on energy security, shale gas exploration, and renewable energy will further support valve use in all refineries and related power plants. The increasing advancements in automation in process industries are also largely attributed to further uptake of control valves and smart valves. The effects of EPA promoting water reuse and recycling, as well as greater emission restrictions, will continue to shape the growth of the U.S. industrial valves market across numerous industries.
U.S. Valves Trade Data (2024)
|
Exporting Country |
Value (USD) |
Importing Country |
Value (USD) |
|
Canada |
2.72B |
China |
$3.56B |
|
Mexico |
2.41B |
Mexico |
$3.49B |
|
China |
903M |
Germany |
$1.45B |
|
Germany |
877M |
Japan |
$1.38B |
|
United Kingdom |
669M |
Italy |
$1.05B |
Source: OEC
Europe Market Insights
The industrial valves market in Europe is set to capture 17% of the global market share by 2035, and it is growing steadily, driven by energy transition, infrastructure modernization, and stringent environmental regulations. However, continuing demand for industrial valves from the water treatment, oil & gas, and chemicals sectors supports growth. With the EU driving a focus towards sustainable manufacturing and automation, the opportunity for valves further expands. Increased consumption of renewable energy projects and the electrical supply grid, combined with improved distribution networks, will further drive the development, manufacturing, and use of industrial valves in a very wide range of industrial applications. Additionally, industrial valves rely on other steel bars for durable construction, ensuring strength, longevity, and performance in demanding industrial applications.
Germany’s Other Steel Bars Trade in 2023
|
Exporting Country |
Value (USD) |
Importing Country |
Value (USD) |
|
France |
$228M |
Italy |
$248M |
|
China |
$159M |
China |
$227M |
|
Italy |
$153M |
Austria |
$181M |
|
Austria |
$134M |
Spain |
$133M |
|
Poland |
$102M |
France |
$122M |
Source: OEC
Key Industrial Valves Market Players:
- Emerson Electric Co.
- Company Overview
- Business Strategy
- Key Product Offerings
- Financial Performance
- Key Performance Indicators
- Risk Analysis
- Recent Development
- Regional Presence
- SWOT Analysis
- Flowserve Corporation
- IMI plc
- Spirax-Sarco Engineering
- Velan Inc.
- KITZ Corporation
- Cameron (a Schlumberger company)
- Metso Outotec
- Parker Hannifin Corporation
- Larsen & Toubro Limited
- LG Industrial Systems Co.
- SMC Corporation
- Velosi Engineering
- Aurecon Group
- Kyowa Valve Co., Ltd.
The global industrial valves market is highly competitive, with leading companies leveraging innovation, digitalization, and sustainability initiatives to maintain and grow market share. US-based giants like Emerson and Flowserve emphasize advanced manufacturing technologies and strategic acquisitions to broaden their product portfolios. European players such as IMI plc focus on energy-efficient valve solutions aligned with stringent environmental regulations. Asian manufacturers, especially from Japan and South Korea, invest heavily in R&D for smart valve technologies and corrosion-resistant materials to cater to evolving chemical industry needs. Japanese companies, including KITZ Corporation and SMC Corporation, strategically expand their global footprint through partnerships and local manufacturing to address regional demand efficiently.
Top Global Manufacturers in the Industrial Valves Market
Recent Developments
- In February 2025, Emerson Electric Co. announced a global expansion plan to enhance manufacturing capacity for smart industrial valves used in chemical processing plants. The investment is expected to focus on integrating IoT-enabled sensors for real-time monitoring and predictive maintenance, targeting a 30% reduction in operational downtime across major refineries in North America, Europe, and Asia. Emerson aims to collaborate with chemical industry leaders and regulatory bodies to meet stricter environmental compliance standards by 2030.
- In November 2024, Flowserve Corporation introduced a sustainability initiative to develop low-leakage, energy-efficient valves designed for chemical plants worldwide. The project aligns with the International Energy Agency’s (IEA) emissions reduction targets and focuses on expanding product lines in emerging markets, including Latin America and Southeast Asia. Flowserve also announced partnerships with several global chemical manufacturers to retrofit existing infrastructure with advanced valve solutions.
- Report ID: 5209
- Published Date: Sep 09, 2025
- Report Format: PDF, PPT
- Explore a preview of key market trends and insights
- Review sample data tables and segment breakdowns
- Experience the quality of our visual data representations
- Evaluate our report structure and research methodology
- Get a glimpse of competitive landscape analysis
- Understand how regional forecasts are presented
- Assess the depth of company profiling and benchmarking
- Preview how actionable insights can support your strategy
Explore real data and analysis
Frequently Asked Questions (FAQ)
Industrial Valves Market Report Scope
Free Sample includes current and historical market size, growth trends, regional charts & tables, company profiles, segment-wise forecasts, and more.
Connect with our Expert


Copyright @ 2026 Research Nester. All Rights Reserved.
