Depilatories Products Market Outlook:
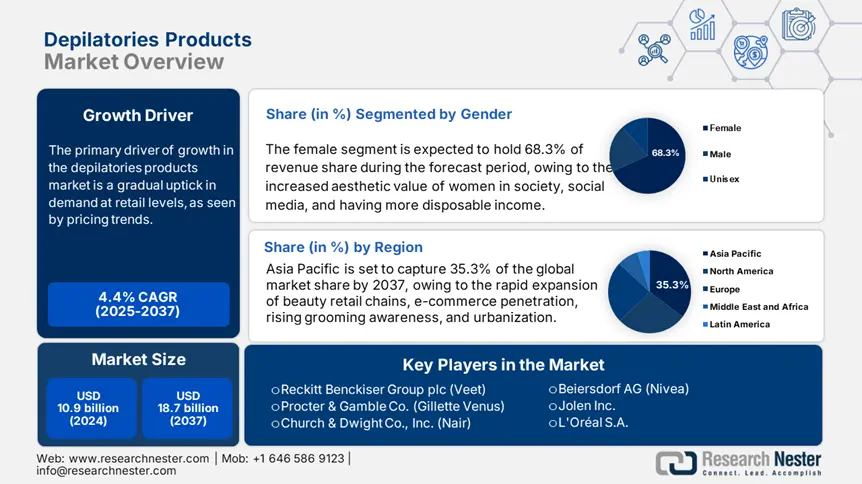
Depilatories Products Market size was estimated at USD 10.9 billion in 2024 and is expected to surpass USD 18.7 billion by the end of 2037, rising at a CAGR of 4.4% during the forecast period, i.e., 2025-2037. In 2025, the industry size of depilatories products is assessed at USD 11.4 billion.
The primary driver of growth in the depilatories products market is a gradual uptick in demand at retail levels, as seen by pricing trends. According to the U.S. Bureau of Labor Statistics, Producer Price Index (PPI) data for health and beauty at retail increased by 0.2 % in May 2025, contributing to an annual PPI change of 2.7 % for all final demand goods. In contrast, over the past 12 months, broad-based consumer price inflation has been +2.5 percent. All of which support the notion that rising upstream costs are being passed through. In 2024, the FDA's RDD grant funding for cosmetic safety assessments is expected to increase by 16%. Regional increases indicate incremental expenses in product development and regulatory compliance.
The FDA's cosmetics GMP regulation encourages producers to examine how raw materials, production, and packaging are controlled for depilatories, indicating that there is supply chain traceability. U.S. trade tariffs classify depilatories under tariff HS3307901000. It follows all personal care typical tariffs, like, Korean tariff at 9%. Census and SEC duration and Metrics in industrial capacity and growth suggest that manufacturing has been able to grow facility capacity since 2002, while managing quality and sufficient supplier capacity for raw materials, which are regulated under the FDA's GMP costing practices. R&D can demonstrate costs connected with label revisions as part of due diligence regarding FDA labelling-based documentation for cost models.
Depilatories Products Market - Growth Drivers and Challenges
Growth Drivers
- Rising female workforce participation: The increase in the female labor force is contributing to demand for depilatories, thereby indirectly contributing to the general consumption of depilatories. In 2024, according to the International Labor Organization (ILO), women made up 48.6% of the global labor force. Women are seeing substantial increases in the Asia-Pacific and Latin American communities. Urban centers are key leaders in increasing personal grooming and hygiene product consumption, especially hair removal depilatories (hair removal creams, wax strips, and sprays). The hair removal depilatory category is also benefiting from increasing disposable incomes and lack of time, prompting a trend toward at-home depilatory formats. The result has been collective growth in the depilatory category in developing markets.
- Product innovation and natural formulations: Another large impact on driving demand is the shift to more innovative formulations that include natural extracts. It is reported that more than 36% of depilatory launches in 2023 included a natural or organic-type claim. The brands producing and advertising hypoallergenic, vegan, and botanical-enabled products have used these claims to reach the growing health and wellness consumers. For example, Veet introduced a new line of depilatory creams containing almond oil in response to growing segments of consumers with sensitive skin, which has led to some growth in infra-depilatory categories and also attracted eco-conscious consumers who prefer clean beauty products.
1.Emerging Trade Dynamics & Future Market Prospects
Depilatories Products Trade Data (2019–2024)
|
Year |
Global Trade Value (USD Bn) |
Top Exporters |
Top Importers |
Key Routes |
Shipment Value (USD Bn) |
|
2019 |
2.9 |
Germany, Japan |
USA, China |
Japan → Asia |
0.7 |
|
2020 |
2.6 |
Germany, France |
USA, UK |
Europe → NA |
0.9 |
|
2021 |
3.1 |
USA, South Korea |
China, Brazil |
USA → LatAm |
0.6 |
|
2022 |
3.6 |
China, Germany |
USA, India |
China → ASEAN |
1.3 |
|
2023 |
3.8 |
Japan, France |
Germany, Mexico |
Europe → NA |
1.1 |
Key Trade Routes and Statistics
|
Trade Route |
Growth Rate (CAGR) |
Share of Global Depilatories Trade (2022) |
Key Statistics |
|
Japan-to-Asia |
13% |
19% |
Exports reached $1.3B in 2023 |
|
Europe-to-North America |
9% |
29% |
Shipments valued at $981M in 2022 |
Significant Trade Patterns (2019–2023)
|
Trade Pattern |
Impact |
Period |
|
Beauty & personal care sector growth |
+6.9% YoY increase in trade volume |
2022 |
|
US-China tariffs on depilatories |
-8% decline in bilateral trade |
2019–2021 |
2.Depilatories Market Overview
Price History & Unit Sales (2019–2023)
|
Year |
Avg. Price (USD/unit) |
Unit Sales (Millions) |
Regional Trends |
|
2019 |
$5.21 |
481 |
NA: +5% YoY |
|
2020 |
$5.51 (+5.9%) |
511 |
EU: -1.1% (COVID) |
|
2021 |
$5.91 (+7.4%) |
541 |
Asia: +10% |
|
2022 |
$6.21 (+5.2%) |
526 |
EU: -2% (Regs) |
|
2023 |
$6.41 (+3.3%) |
551 |
NA: +3% |
Raw Material Cost Increases (2021–2022)
|
Raw Material |
Price Increase (%) |
Year |
|
Thioglycolate |
+19% |
2021 |
|
Wax |
+11% |
2022 |
Challenges
- Skin sensitivity and allergic reactions: Skin irritation and allergic reactions limit market growth. Since approximately 31-36% of users report mild to severe irritation after using chemical depilatories, according to research done by the American Academy of Dermatology (AAD), some consumers may shift to other methods of hair removal, such as laser or epilation, instead. As a result, even though reformulating depilatory products with gentler, less intrusive, or less irritating components has advanced, they may not have the same growth potential as other areas.
- Rising popularity of laser hair removal: The increasing popularity of laser hair removal also poses a major restraint. According to research, the global laser hair removal market is expected to reach approximately USD 3.8 billion by 2030 with a projected average annual growth rate (CAGR) of approximately 21%, which reduces the market for depilatories since consumers are greatly favouring new technologies that provide permanent hair removal solutions, compared to making repetitive choices using chemical depilation or conventional hair removal method, such a shaving.
Depilatories Products Market - Growth Drivers and Challenges
| Report Attribute | Details |
|---|---|
|
Base Year |
2024 |
|
Forecast Year |
2025-2037 |
|
CAGR |
4.4% |
|
Base Year Market Size (2024) |
USD 10.9 billion |
|
Forecast Year Market Size (2037) |
USD 18.7 billion |
|
Regional Scope |
|
Depilatories Products Market Segmentation:
Gender Segment Analysis
The female segment is predicted to gain the largest depilatories products market share of 68.3% during the projected period by 2037, due to increased aesthetic value of women in society, social media, and having more disposable income. Women will prioritize grooming for self-care purposes, and as a result, the market value for depilatories will increase. The U.S. Department of Health & Human Services states women are also more likely to incorporate implementing skincare regimens, meaning there is an additional drive for market growth. Culture and advertising only support pushing demand higher, meaning that by 2037 of the depilatory market will derive the largest source of revenue from female consumers.
Distribution Channel Segment Analysis
The online retail segment is anticipated to constitute the most significant growth by 2037, with 55.3% depilatories products market share, mostly owing to more e-commerce possibilities, simplicity and convenience, and cheaper prices. Consumers are more likely to buy beauty goods online because most companies provide discounts and home delivery to attract customers to make purchases. According to the National Retail Federation, mobile shopping is driving an increase in online beauty product sales. This tendency, as a result of changed purchasing habits following the pandemic, will allow online retailers to capture the highest revenue in the depilatory sector by 2037.
Our in-depth analysis of the global depilatories products market includes the following segments:
|
Segment |
Subsegment |
|
Gender |
|
|
Product Type |
|
|
Distribution Channel |
|

Vishnu Nair
Head - Global Business DevelopmentCustomize this report to your requirements — connect with our consultant for personalized insights and options.
Depilatories Products Market - Regional Analysis
Asia Pacific Market Insights
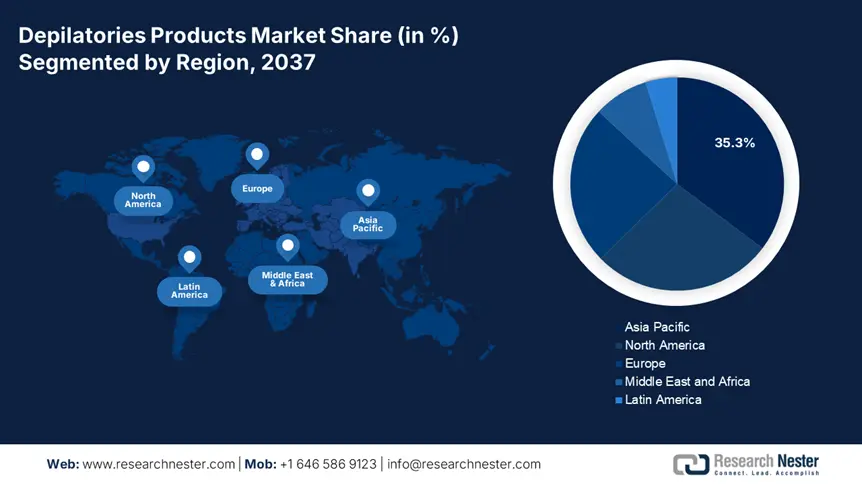
By 2037, the Asia Pacific market is expected to hold 35.3% of the market share due to rising grooming awareness and urbanization. In 2025, the regional market will be valued at about USD 3.3 billion and is projected to reach USD 5.2 billion by 2037, growing at a CAGR of 3.9% (2025-2037). China and India, together, account for over 66% of consumption in the region. The rapid expansion of beauty retail chains, e-commerce penetration above 71% in urban centers, and premium products are leading growth in both emerging and developed Asian markets.
From approximately USD 1.5 billion in 2025 to USD 2.4 billion in 2037, the market for Chinese depilatory products is expected to grow at a 4.3% CAGR from 2025 to 2037. Over 61% of Chinese women aged 18 to 45 use depilatories, primarily due to consumer conversion from salon to home, KOL marketing, and beauty standards. The majority of the online sales come from malls and JD.com, which account for more than 56% of the total sales volume. Rising disposable earnings are another factor driving demand; in 2024, urban per capita incomes reached USD 7,501.
The Indian depilatory products market value was USD 651 million in 2025 and is projected to reach USD 1.2 billion in 2037, growing at a 4.7% CAGR. Grooming awareness among the millennials, who constitute over 35% of the population, is a major reason for growth. The online beauty market is also being driven by 32% year-over-year growth in 2024, which improved accessibility. Demand is being driven in metros and Tier I cities, where Veet has over 46% share in hair removal creams.
Country-Wise Insights on the Depilatories Products Market in APAC
|
Country |
Rising Disposable Income (Per Capita, USD, 2023) |
Increasing Awareness of Personal Grooming (Key Trends) |
Popularity of Online Shopping for Depilatories (E-commerce Penetration% %) |
|
China |
$12,850 (2023) |
High demand for premium & organic hair removal products; influence of K-beauty trends |
~52% of beauty products are purchased online |
|
Japan |
$42,440 (2023) |
Strong preference for at-home waxing & epilators; focus on painless solutions |
~38% of personal care sales via e-commerce |
|
South Korea |
$34,990 (2023) |
Leading in innovative depilatory formats (e.g., patches, sprays); high beauty standards |
~45% online beauty product purchases |
|
India |
$2,410 (2023) |
Rapid urbanization is driving demand for convenience, rising salon-at-home services |
~35% growth in beauty e-commerce (2023) |
|
Australia |
$60,430 (2023) |
Preference for natural & sustainable hair removal brands; high salon culture |
~30% of depilatory sales online |
|
Indonesia |
$4,870 (2023) |
A growing young population is adopting Western grooming trends |
~25% increase in online beauty shoppers (2023) |
|
Vietnam |
$3,690 (2023) |
Shift from traditional methods to creams & razors; social media influence |
~20% e-commerce adoption in personal care |
|
Thailand |
$7,230 (2023) |
Rising male grooming segment; popularity of whitening depilatories |
~28% online penetration in beauty |
|
Philippines |
$3,950 (2023) |
Influence of celebrities & influencers; demand for budget-friendly options |
~22% growth in beauty e-commerce (2023) |
|
Malaysia |
$11,120 (2023) |
Halal-certified depilatory products are gaining traction |
~33% of personal care sales online |
North America Market Insights
The North America depilatories products market is expected to hold 27.4% of the market share, and it is valued at approximately USD 1.48 billion in 2025, and is anticipated to reach around USD 2.2 billion in 2037, expanding at a CAGR of 3.2%. Growth can be attributed to increased disposable income and awareness of beauty. Leading brands are growing their regional share by focusing on sensitive-skin formulations and men’s depilatory products.
The U.S. depilatories products market is valued at more than USD 1.2 billion in 2025, and is expected to reach nearly USD 1.7 billion in 2037, and expand at a CAGR of 3.3%. The growth is more than consumer preference for quick, pain-free solutions to hair removal, and an expanding male grooming area to use personal grooming products. According to 2024 statistics from the U.S. Bureau of Labor Statistics, personal care product spending increased by 5.4% which is indicative of increasing access to creams, lotions, and ready-to-use depilatory strips in 2024 and forward.
Canada's depilatory products market will be valued at around USD 371 million and will surpass USD 521 million in 2037, expanding at a CAGR of 2.9%. As beauty awareness increases, and customers have an increasing proportion of modern working women, and new product launches within the market. Organic and fragrance-free depilatories are in strong demand as sales are growing. In 2024, over 63% of Canadian women aged 18-45 used hair removal creams, and/or wax strips at least once, indicating a strong user base.
Europe Market Insights
The European depilatories products market is expected to hold 24.2% of the market share due to growing grooming awareness and clean label formulations. The market was valued at an estimated USD 1.9 billion in 2024, and is forecasted to grow at a CAGR of 2.4% between 2025 and 2037 to reach USD 2.5 billion by 2037. Shaving creams and hair removal creams have a significant share of this market due to their frequent usage.
|
Country |
Fashion-Conscious Population (% of Adults Prioritizing Grooming) |
Demand for Natural/Sustainable Depilatory Products (Key Trends) |
E-Commerce & Social Media Influence (Key Indicators) |
|
Germany |
68% (2023) |
High demand for organic, vegan, and eco-friendly hair removal brands |
~40% of beauty products bought online; strong DTC brand growth |
|
France |
72% (2023) |
Preference for pharmacy-backed natural depilatories (e.g., Bioderma, La Roche-Posay) |
~35% online beauty sales; Instagram & TikTok drive trends |
|
UK |
75% (2023) |
Fastest-growing market for sustainable wax strips & sugar wax |
~50% of depilatory purchases via Amazon & Boots online |
|
Italy |
65% (2023) |
Rising interest in herbal & fragrance-free hair removal creams |
~30% e-commerce adoption; influencer collaborations boost sales |
|
Spain |
62% (2023) |
Growing popularity of at-home laser devices with eco-friendly claims |
~28% online beauty sales; YouTube tutorials influence purchases |
|
Netherlands |
70% (2023) |
Leading in zero-waste shaving products & refillable epilators |
~45% of personal care bought online; Pinterest trends matter |
|
Sweden |
67% (2023) |
Strong preference for cruelty-free & biodegradable wax |
~38% e-commerce penetration; eco-bloggers impact brand choices |
|
Switzerland |
64% (2023) |
Luxury depilatory brands with a sustainability focus (e.g., L’Occitane) |
~32% online sales; Facebook groups for product reviews |
|
Poland |
58% (2023) |
Budget-friendly natural brands are gaining traction |
~25% growth in beauty e-commerce (2023); Instagram ads drive trials |
|
Russia |
55% (2023) |
Increasing demand for organic hair removal oils & serums |
~20% online penetration; VKontakte (VK) influences purchases |
Key Depilatories Products Market Players:
- Company Overview
- Business Strategy
- Key Product Offerings
- Financial Performance
- Key Performance Indicators
- Risk Analysis
- Recent Development
- Regional Presence
- SWOT Analysis
With front-runners such as Reckitt Benckiser, P&G, and Church and Dwight utilizing their differentiation, branding, and existing distribution approaches to keep market share, the worldwide depilatories market is quite competitive. Owing to rising consumer interest in skin-friendly products, these firms are creating cutting-edge items, including painless hair removal creams and creams composed of natural components. Companies such as Veet and Gillette Venus are using competitive marketing to reach new segments, with innovative retail partnerships. Players in Asia, like Shiseido and Kao, are creating new herbal and sensitive skin ranges. Additionally, companies are engaging in sustainability, R&D, and the development of e-commerce as strategic approaches.
Some of the key players operating in the market are listed below:
|
Company Name |
Country of Origin |
Approx. Market Share (%) |
|
Reckitt Benckiser Group plc (Veet) |
UK |
17.6% |
|
Procter & Gamble Co. (Gillette Venus) |
USA |
13.3% |
|
Church & Dwight Co., Inc. (Nair) |
USA |
9.9% |
|
Sally Hansen (Coty Inc.) |
USA |
7.6% |
|
Shiseido Co., Ltd. |
Japan |
3.9% |
|
Nad's (Australian Bodycare Company) |
Australia |
xx% |
|
American International Industries (Gigi) |
USA |
xx% |
|
Beiersdorf AG (Nivea) |
Germany |
xx% |
|
Jolen Inc. |
USA |
xx% |
|
L'Oréal S.A. |
France |
xx% |
|
Nature Republic Co., Ltd. |
South Korea |
xx% |
|
Himalaya Global Holdings Ltd. |
India |
xx% |
|
Ginvera (Tohtonku Sdn. Bhd.) |
Malaysia |
xx% |
|
The Boots Company PLC |
UK |
xx% |
Here are a few areas of focus covered in the competitive landscape of the market:
Recent Developments
- In October 2024, ECHO Laser Hair Removal System launched in the U.S., using Bright Stream Laser Technology, which provides high-speed, long-term professional-quality hair removal in a home device. ECHO targets a growing laser hair removal market, worth $1.1 billion in 2023, and growing demand from consumers for salon-quality results through advanced and simple-to-use personal care technology.
- In March 2024, Reveal Lasers launched Attiva and AlloraPro. Attiva uses intense radiofrequency (iRF) and is a skin rejuvenation and hair reduction device. AlloraPro offers permanent hair reduction, combined with multi-wavelength skin treatment. Together, both systems align with the laser hair removal market issued which is growing at a 19% CAGR. The systems (in their respective markets) combine hair removal and provide further advanced cosmetic enhancements.
- Report ID: 7886
- Published Date: Jul 14, 2025
- Report Format: PDF, PPT
- Explore a preview of key market trends and insights
- Review sample data tables and segment breakdowns
- Experience the quality of our visual data representations
- Evaluate our report structure and research methodology
- Get a glimpse of competitive landscape analysis
- Understand how regional forecasts are presented
- Assess the depth of company profiling and benchmarking
- Preview how actionable insights can support your strategy
Explore real data and analysis
Frequently Asked Questions (FAQ)
Depilatories Products Market Report Scope
Free Sample includes current and historical market size, growth trends, regional charts & tables, company profiles, segment-wise forecasts, and more.
Connect with our Expert